| |||||||||||||||||||||||||||||
All 47 seats to Teignbridge District Council [lower-alpha 1] 24 seats needed for a majority | |||||||||||||||||||||||||||||
---|---|---|---|---|---|---|---|---|---|---|---|---|---|---|---|---|---|---|---|---|---|---|---|---|---|---|---|---|---|
| |||||||||||||||||||||||||||||
Results map by ward | |||||||||||||||||||||||||||||
|
The 2019 Teignbridge District Council election took place on 2 May 2019 to elect members of Teignbridge District Council in England. At the election, the Liberal Democrats won control of the council. [1]
2019 Teignbridge District Council election [2] [3] | ||||||||||
---|---|---|---|---|---|---|---|---|---|---|
Party | Candidates | Seats | Gains | Losses | Net gain/loss | Seats % | Votes % | Votes | +/− | |
Liberal Democrats | 44 | 26 | N/A | N/A | 15 | 55.3 | 40.5 | 31,993 | +11.5 | |
Conservative | 46 | 12 | N/A | N/A | 19 | 25.5 | 29.6 | 23,346 | –8.2 | |
Independent | 22 | 9 | N/A | N/A | 4 | 19.1 | 13.5 | 10,679 | –1.9 | |
Labour | 29 | 0 | N/A | N/A | 0.0 | 10.0 | 7,898 | +5.3 | ||
UKIP | 10 | 0 | N/A | N/A | 0.0 | 3.3 | 2,586 | –0.2 | ||
Green | 6 | 0 | N/A | N/A | 0.0 | 2.9 | 2,311 | –6.3 |
Incumbents are denoted by an asterisk (*).
Party | Candidate | Votes | % | ±% | |
---|---|---|---|---|---|
Independent | Richard Andrew Daws | 990 | 47.1 | ||
Independent | Mary Elizabeth Colclough* | 848 | 40.3 | ||
Liberal Democrats | Margaret Irene Crompton | 638 | 30.3 | ||
Liberal Democrats | Tessa Carol Amies | 564 | 26.8 | ||
Conservative | Dennis Esmond Smith* | 394 | 18.7 | ||
Conservative | Richard Michael Butterworth | 335 | 15.9 | ||
Majority | 210 | 10.0 | |||
Turnout | 2,121 | 45.62 | |||
Independent win (new seat) | |||||
Independent win (new seat) |
Party | Candidate | Votes | % | ±% | |
---|---|---|---|---|---|
Liberal Democrats | Frederick John Nutley* | 1,420 | 46.4 | ||
Liberal Democrats | Huw William Cox | 996 | 32.5 | ||
Conservative | Sarah Parker-Khan | 984 | 32.2 | ||
Liberal Democrats | Jack Anthony Major | 960 | 31.4 | ||
Labour | Andrew Timothy Stokes | 795 | 26.0 | ||
Conservative | Charles Ernest Dennis* | 656 | 21.4 | ||
Conservative | Shane Nigel Fleming | 563 | 18.4 | ||
Labour | Anne Mary Goulborn | 530 | 17.3 | ||
Independent | Philip Christopher Vogel | 497 | 16.2 | ||
Labour | Patrick John Howard | 407 | 13.3 | ||
Independent | Sylvia Lilian Phillips | 351 | 11.5 | ||
Independent | Zoé Lynn Ellis | 177 | 5.8 | ||
Independent | James Russell Birch Dennis | 132 | 4.3 | ||
Majority | 24 | 0.8 | |||
Turnout | 3,080 | 44.43 | |||
Liberal Democrats win (new seat) | |||||
Conservative win (new seat) |
Party | Candidate | Votes | % | ±% | |
---|---|---|---|---|---|
Liberal Democrats | Andrew Kier MacGregor | 405 | 45.6 | ||
Conservative | Nicholas Timothy Golder* | 376 | 42.3 | ||
UKIP | Llewellyn Williams | 107 | 12.0 | ||
Majority | 29 | 3.3 | |||
Turnout | 901 | 40.55 | |||
Liberal Democrats win (new seat) |
Party | Candidate | Votes | % | ±% | |
---|---|---|---|---|---|
Liberal Democrats | Sally Angela Morgan | 1,083 | 40.8 | ||
Conservative | Avril Joan Kerswell* | 1,070 | 40.3 | ||
Conservative | George John Gribble* | 1,033 | 38.9 | ||
Independent | Eoghan Eamon Kelly | 1,018 | 38.4 | ||
Conservative | Martyn John Evans | 981 | 37.0 | ||
Labour | Lisa Collette Robillard Webb | 641 | 24.2 | ||
Labour | Susan Mary Honnor | 476 | 17.9 | ||
Labour | Ian Hugh Wellens | 404 | 15.2 | ||
Majority | 15 | 0.5 | |||
Turnout | 2,682 | 42.63 | |||
Liberal Democrats win (new seat) | |||||
Conservative win (new seat) | |||||
Conservative win (new seat) |
Party | Candidate | Votes | % | ±% | |
---|---|---|---|---|---|
Independent | Michael John Hocking* | 590 | 37.0 | ||
Conservative | Philip Andrew Bullivant* | 574 | 36.0 | ||
Liberal Democrats | Richard David Jenks | 567 | 35.6 | ||
Liberal Democrats | Brian Christopher Hayes | 533 | 33.4 | ||
Conservative | Elizabeth Gorman Roberts | 376 | 23.6 | ||
Labour | Jamie David Cook | 145 | 9.1 | ||
Labour | Mark Alastair Langabeer | 117 | 7.3 | ||
Majority | 7 | 0.4 | |||
Turnout | 1,610 | 30.93 | |||
Independent win (new seat) | |||||
Conservative win (new seat) |
Party | Candidate | Votes | % | ±% | |
---|---|---|---|---|---|
Liberal Democrats | Gordon Nicholas Hook* | 1,519 | 64.0 | ||
Liberal Democrats | Colin Neil Parker* | 1,162 | 49.0 | ||
Liberal Democrats | Christopher Richard Jenks | 1,023 | 43.1 | ||
UKIP | Steven James Harvey | 416 | 17.5 | ||
Conservative | Christopher Julian Coyle-Moore | 362 | 15.3 | ||
UKIP | Stephen Jamie Witts | 353 | 14.9 | ||
Conservative | Paul Reginald Furneaux Winsor* | 346 | 14.6 | ||
Labour | Jane Haden | 284 | 12.0 | ||
Conservative | Jonathan James Hodgson | 250 | 10.5 | ||
Labour | James William Osben | 230 | 9.7 | ||
Independent | Eloise Rokirilov | 202 | 8.5 | ||
Labour | Rheanne Marie Osben | 196 | 8.3 | ||
Majority | 607 | 25.6 | |||
Turnout | 2,397 | 36.83 | |||
Liberal Democrats win (new seat) | |||||
Liberal Democrats win (new seat) |
Party | Candidate | Votes | % | ±% | |
---|---|---|---|---|---|
Liberal Democrats | Jacqueline Ann Hook* | 639 | 44.8 | ||
Liberal Democrats | Robert Henry Hayes* | 444 | 31.1 | ||
Independent | Paul Kirk Field | 409 | 28.7 | ||
Independent | Julie Ann Jones | 319 | 22.4 | ||
Labour | Ryan William Hall | 245 | 17.2 | ||
Conservative | Anthony Reginald Ballinger | 219 | 15.4 | ||
Conservative | Simon Michael Walker | 183 | 12.8 | ||
Labour | Pauline Angela Wynter | 178 | 12.5 | ||
Majority | 35 | 2.4 | |||
Turnout | 1,452 | 32.09 | |||
Liberal Democrats win (new seat) | |||||
Liberal Democrats win (new seat) |
Party | Candidate | Votes | % | ±% | |
---|---|---|---|---|---|
Liberal Democrats | Richard Michael Keeling* | 918 | 46.6 | ||
Liberal Democrats | Lorraine Margaret Evans* | 698 | 35.4 | ||
Conservative | Georgina Sherwood | 658 | 33.4 | ||
Green | Emily Joyce Simcock | 442 | 22.4 | ||
Conservative | Christopher James Yeo | 422 | 21.4 | ||
Labour | Janette Ann Parker | 233 | 11.8 | ||
Labour | Joseph James Blurton | 208 | 10.6 | ||
Majority | 24 | 0.8 | |||
Turnout | 2,005 | 42.93 | |||
Liberal Democrats win (new seat) | |||||
Liberal Democrats win (new seat) |
Party | Candidate | Votes | % | ±% | |
---|---|---|---|---|---|
Independent | Janet Bradford | 743 | 46.9 | ||
Independent | Liam David Parker | 596 | 37.6 | ||
Liberal Democrats | Michael John Pilkington* | 388 | 24.5 | ||
Liberal Democrats | Michael Douglas Joyce | 338 | 21.3 | ||
Independent | David Howe | 241 | 15.2 | ||
Labour | Oliver Giddings | 168 | 10.6 | ||
Conservative | John Trevor Thomas Phillips | 159 | 10.0 | ||
Conservative | Nicholas Paul Yabsley | 146 | 9.2 | ||
Labour | Paul David Wynter | 133 | 8.4 | ||
UKIP | John Steven Gynn | 102 | 6.4 | ||
Majority | 208 | 13.1 | |||
Turnout | 1,592 | 39.21 | |||
Independent win (new seat) | |||||
Independent win (new seat) |
Party | Candidate | Votes | % | ±% | |
---|---|---|---|---|---|
Liberal Democrats | John Martin Charles Wrigley* | 1,406 | 59.8 | ||
Liberal Democrats | Linda Petherick | 1,173 | 49.9 | ||
Liberal Democrats | Linda Jean Goodman-Bradbury | 982 | 41.8 | ||
Conservative | Lisa Eugene Mayne* | 596 | 25.4 | ||
Green | Christina Gabriel Humphries | 529 | 22.5 | ||
Conservative | Kevin Peter Parsons | 485 | 20.6 | ||
Conservative | Noel Nickless | 445 | 18.9 | ||
UKIP | Judith Ellen Wood | 409 | 17.4 | ||
Majority | 386 | 16.4 | |||
Turnout | 2,374 | 35.27 | |||
Liberal Democrats win (new seat) | |||||
Liberal Democrats win (new seat) |
Party | Candidate | Votes | % | ±% | |
---|---|---|---|---|---|
Liberal Democrats | John Robert Petherick | 722 | 41.3 | ||
Liberal Democrats | Gary William Taylor | 702 | 40.2 | ||
Conservative | Rosalind Mary Prowse* | 561 | 32.1 | ||
Conservative | Humphrey Hawkey Clemens* | 518 | 29.7 | ||
Green | John Patrick Crawford Watson | 405 | 23.2 | ||
UKIP | Douglas Reay Waring Wood | 277 | 15.9 | ||
Majority | 141 | 8.1 | |||
Turnout | 1,763 | 36.86 | |||
Liberal Democrats win (new seat) | |||||
Liberal Democrats win (new seat) |
Party | Candidate | Votes | % | ±% | |
---|---|---|---|---|---|
Independent | Adrian Patch | 376 | 37.5 | ||
Independent | Robert Howard Steemson | 321 | 32.0 | ||
Conservative | Jeremy Owen Christophers* | 222 | 22.1 | ||
Labour | Philip Cunningham | 57 | 5.7 | ||
Independent | Jessica Mai Hodge | 27 | 2.7 | ||
Majority | 55 | 5.5 | |||
Turnout | 1,013 | 49.10 | |||
Independent win (new seat) |
Party | Candidate | Votes | % | ±% | |
---|---|---|---|---|---|
Liberal Democrats | John Peter Alistair Dewhirst* | 786 | 80.0 | ||
Conservative | Lloyd Roland Fursdon | 197 | 20.0 | ||
Majority | 589 | 60.0 | |||
Turnout | 998 | 48.45 | |||
Liberal Democrats win (new seat) |
Party | Candidate | Votes | % | ±% | |
---|---|---|---|---|---|
Liberal Democrats | Charles John Sinclair Nuttall | 1,258 | 49.1 | ||
Liberal Democrats | Nicholas Andrew Swain | 1,194 | 46.6 | ||
Liberal Democrats | Alison Grace Foden | 1,133 | 44.2 | ||
Conservative | Kevin Andrew Lake* | 1,058 | 41.3 | ||
Conservative | John Robert Goodey* | 1,006 | 39.3 | ||
Conservative | Adrian Lewis Wood | 890 | 34.7 | ||
Labour | Sarah Elizabeth Krys | 288 | 11.2 | ||
Labour | Anthony Krys | 232 | 9.1 | ||
Majority | 75 | 2.9 | |||
Turnout | 2,608 | 40.15 | |||
Liberal Democrats win (new seat) | |||||
Liberal Democrats win (new seat) |
Party | Candidate | Votes | % | ±% | |
---|---|---|---|---|---|
Liberal Democrats | Alan Michael Connett* | 848 | 77.7 | ||
Green | Megan Kathryn Debenham | 149 | 13.7 | ||
Conservative | Lucille Mary Michelle Baker | 93 | 8.5 | ||
Majority | 699 | 64.0 | |||
Turnout | 1,094 | 46.65 | |||
Liberal Democrats win (new seat) |
Party | Candidate | Votes | % | ±% | |
---|---|---|---|---|---|
Independent | Michael John Haines* | 917 | 52.2 | ||
Liberal Democrats | Sheila Mary Cook* | 704 | 40.1 | ||
Conservative | Andrew Martin Thirkell Hartley | 570 | 32.5 | ||
Liberal Democrats | Cameron Charles Whitford | 533 | 30.4 | ||
Conservative | Fiona Grace Muddeman | 251 | 14.3 | ||
Majority | 134 | 7.6 | |||
Turnout | 1,765 | 36.98 | |||
Independent win (new seat) | |||||
Liberal Democrats win (new seat) |
Party | Candidate | Votes | % | ±% | |
---|---|---|---|---|---|
Independent | Beryl Austen* | 663 | 46.7 | ||
Conservative | Ronald Peart* | 520 | 36.6 | ||
Liberal Democrats | Marie Chadwick | 491 | 34.6 | ||
Green | Jennifer Mary Osborne | 314 | 22.1 | ||
Conservative | Robert James Perry | 252 | 17.8 | ||
Liberal Democrats | David John Corney-Walker | 183 | 12.9 | ||
Majority | 29 | 2.0 | |||
Turnout | 1,427 | 28.67 | |||
Independent win (new seat) | |||||
Conservative win (new seat) |
Party | Candidate | Votes | % | ±% | |
---|---|---|---|---|---|
Conservative | William Herbert Percy Thorne* | 445 | 36.4 | ||
Liberal Democrats | David William Rollason* | 443 | 36.3 | ||
Independent | Antony Darryl David Dempster | 422 | 34.6 | ||
Liberal Democrats | Philip Chadwick | 367 | 30.1 | ||
UKIP | Jacqueline Mary Hooper | 265 | 21.7 | ||
Conservative | Sam Morfey | 203 | 16.6 | ||
Majority | 21 | 1.7 | |||
Turnout | 1,223 | 27.50 | |||
Conservative win (new seat) | |||||
Liberal Democrats win (new seat) |
Party | Candidate | Votes | % | ±% | |
---|---|---|---|---|---|
Conservative | Michael Harrold Jeffery* | 537 | 48.1 | ||
Liberal Democrats | John Farrand-Rogers | 422 | 37.8 | ||
Labour | Brian McAuley | 157 | 14.1 | ||
Majority | 115 | 10.3 | |||
Turnout | 1,145 | 47.12 | |||
Conservative win (new seat) |
Party | Candidate | Votes | % | ±% | |
---|---|---|---|---|---|
Conservative | Christopher Stuart Clarance* | 663 | 65.5 | ||
Liberal Democrats | Julie Mary Gregory | 284 | 28.1 | ||
Labour | Colin John Baigent | 65 | 6.4 | ||
Majority | 115 | 10.3 | |||
Turnout | 1,032 | 50.17 | |||
Conservative win (new seat) |
Party | Candidate | Votes | % | ±% | |
---|---|---|---|---|---|
Conservative | Stephen John Kinross Purser | 841 | 49.9 | ||
Conservative | Terence Charles Mark Tume | 667 | 39.6 | ||
Liberal Democrats | Briony Falch | 589 | 34.9 | ||
Green | Mary Anne McFarlane | 472 | 28.0 | ||
Liberal Democrats | Karen Tracy Chaplin | 361 | 21.4 | ||
Labour | Michael Edwin Megee | 249 | 14.8 | ||
Majority | 78 | 4.7 | |||
Turnout | 1,722 | 42.69 | |||
Conservative win (new seat) | |||||
Conservative win (new seat) |
Party | Candidate | Votes | % | ±% | |
---|---|---|---|---|---|
Independent | Jacqueline Orme* | 634 | 39.1 | ||
Liberal Democrats | Alison Margaret Eden* | 589 | 36.3 | ||
Liberal Democrats | Peter Malcolm Williams | 552 | 34.1 | ||
Conservative | Keith Ronald Underhill | 422 | 26.0 | ||
Labour | Lillian Georgina Jean Chasteau | 278 | 17.1 | ||
UKIP | David Anthony Gunn | 237 | 14.6 | ||
Labour | Noah Steven Nelson Chasteau | 236 | 14.6 | ||
Majority | 37 | 2.2 | |||
Turnout | 1,639 | 37.88 | |||
Independent win (new seat) | |||||
Liberal Democrats win (new seat) |
Party | Candidate | Votes | % | ±% | |
---|---|---|---|---|---|
Conservative | Robert Julius Phipps | 705 | 42.2 | ||
Conservative | Ella Sylvia Russell* | 625 | 37.4 | ||
Liberal Democrats | Catriona Thomas | 467 | 27.9 | ||
Liberal Democrats | Brian Leslie Dennis Wright | 466 | 27.9 | ||
UKIP | Christopher Charles Whitlock | 246 | 14.7 | ||
Labour | Marilyn Anne Warrener | 227 | 13.6 | ||
Labour | Donald Bruce Mattock | 211 | 12.6 | ||
Majority | 158 | 4.7 | |||
Turnout | 1,709 | 43.07 | |||
Conservative win (new seat) | |||||
Conservative win (new seat) |
Party | Candidate | Votes | % | ±% | |
---|---|---|---|---|---|
Liberal Democrats | David Nicholas Cox* | 649 | 49.7 | ||
Liberal Democrats | Nina Susan Jeffries | 394 | 30.2 | ||
Conservative | David Andrew Matthews* | 291 | 22.3 | ||
Labour | Jacqueline Mary Jackson | 270 | 20.7 | ||
Labour | Jeffrey Lee Pocock | 238 | 18.2 | ||
Independent | Colin Joseph Authers | 206 | 15.8 | ||
Conservative | June Green | 198 | 15.2 | ||
UKIP | Geraldine Williams | 174 | 13.3 | ||
Majority | 35 | 2.4 | |||
Turnout | 1,314 | 33.63 | |||
Liberal Democrats win (new seat) | |||||
Liberal Democrats win (new seat) |
Mid Devon is a local government district in Devon, England. Its council is based in Tiverton.
Teignbridge is a local government district in Devon, England. Its council is based in Newton Abbot.
Newton Abbot is a market town and civil parish on the River Teign in the Teignbridge District of Devon, England. Its 2011 population of 24,029 was estimated to reach 26,655 in 2019. It grew rapidly in the Victorian era as the home of the South Devon Railway locomotive works. This later became a major steam engine shed, retained to service British Railways diesel locomotives until 1981. It now houses the Brunel industrial estate. The town has a race course nearby, the most westerly in England, and a country park, Decoy. It is twinned with Besigheim in Germany and Ay in France.
Teignbridge was, from 1983 until 2010, a county constituency represented in the House of Commons of the Parliament of the United Kingdom. It elected one Member of Parliament (MP) by the first past the post system of election.
The 2005 United Kingdom local elections were held on Thursday 5 May 2005, with various councils and local government seats being contested in England and Northern Ireland, and a local referendum taking place on the Isle of Wight on the issue of a directly elected mayor. These local elections were held in conjunction with the 2005 general election across the entire United Kingdom.
South Hams District Council is the local authority for the South Hams District in Devon, England. The council is elected every four years. Since the last boundary changes in 2015, 31 councillors have been elected from 20 wards: eleven of which elect one councillor, seven elect two councillors and two elect three councillors. Between 1999 and 2014, 40 councillors were elected from 30 wards.
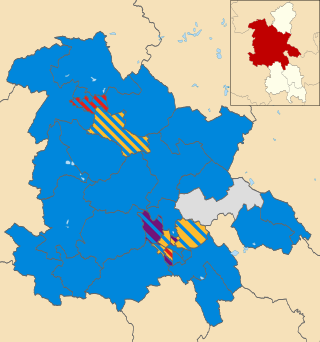
Aylesbury Vale District Council was the council for the non-metropolitan district of Aylesbury Vale in Buckinghamshire, England, which existed as a local government area from 1974 to 2020. The council was elected every four years from 1973 until 2020. At the time of its abolition, the council had 59 councillors, elected from 33 wards.
Central Devon is a constituency represented in the House of Commons of the UK Parliament since 2010 by Mel Stride, a Conservative.
Newton Abbot is a constituency in Devon represented in the House of Commons of the UK Parliament since its 2010 creation by Anne Marie Morris, a Conservative.
The 2001 United Kingdom local elections took place on Thursday 7 June 2001. Elections took place for all of the English shire counties, some English unitary authorities and all of the Northern Ireland districts. The elections were delayed from the usual date of the first Thursday in May due to the 2001 foot and mouth crisis and were held on the same day as the 2001 general election.
Mid Devon District Council in Devon, England is elected every four years. Since the last boundary changes in 2003, 42 councillors have been elected from 24 wards.
Francis Fulford is a member of the United Kingdom's landed gentry, the 23rd Fulford to have owned and inhabited Great Fulford manor house in Devon. After briefly working as a stockbroker, he has had a career as a television personality and presenter.
Stokeinteignhead is a village and civil parish in the Teignbridge district of Devon, England, above the southern bank of the estuary of the River Teign. The parish has a short boundary on the estuary, and is otherwise surrounded, clockwise from the north, by the parishes of Shaldon, Torbay, Coffinswell and Haccombe with Combe. It is twinned with the French commune of Trévières, Calvados.
Teignbridge District Council in Devon, England is elected every four years. Since the last boundary changes in 2019, 47 councillors have been elected from 24 wards.
The 2015 Teignbridge District Council election took place on 7 May 2015 to elect members of Teignbridge District Council in England. This was on the same day as other local elections. At the election, the Conservatives won control of the council.
The 2019 United Kingdom local elections took place on Thursday 2 May 2019, with 248 English local councils, six directly elected mayors in England, and all 11 local councils in Northern Ireland being contested.
The 2019 Bolsover District Council election took place on 2 May 2019 to elect all 37 members of Bolsover District Council in England. This was on the same day as other local elections.
The 2021 Devon County Council election took place alongside the other local elections. All 60 councillors to Devon County Council were elected. A total of 256,974 votes were cast including spoiled ballots.
The 2023 Teignbridge District Council election took place on 4 May 2023 to elect members of Teignbridge District Council in Devon, England. This would be on the same day as other local elections across England.