2019 Waverley Borough Council election

Last updated

2019 Waverley Borough Council election
Flag of Surrey.svg
  2015 2 May 2019 (2019-05-02) 2023  

All 57 seats to Waverley Borough Council
29 seats needed for a majority
 First partySecond partyThird party
  No image wide.svg No image wide.svg No image wide.svg
Party Conservative Residents Liberal Democrats
Last election53 seats, 52.0%3 seats, 5.2%0 seats, 15.0%
Seats won231514
Seat changeDecrease2.svg 30Increase2.svg 12Increase2.svg 14
Popular vote25,74912,73417,150
Percentage39.7%19.6%26.5%
SwingDecrease2.svg 12.3%Increase2.svg 14.4%Increase2.svg 11.5%

 Fourth partyFifth partySixth party
  No image wide.svg No image wide.svg No image wide.svg
Party Labour Green Independent
Last election0 seats, 12.5%0 seats, 3.1%1 seat, 7.1%
Seats won221
Seat changeIncrease2.svg 2Increase2.svg 2Steady2.svg
Popular vote4,3623,2051,230
Percentage6.7%4.9%1.9%
SwingDecrease2.svg 5.8%Increase2.svg 1.8%Decrease2.svg 5.2%

Waverley wards 2019.svg
Winner of each seat at the 2019 Waverley Borough Council election

Council control before election


Conservative

Council control after election


No overall control

The 2019 Waverley Borough Council election took place on 2 May 2019 to elect members of Waverley Borough Council in England as one of the 2019 local elections. [1] [2]

Contents

Results

In the 2015 elections the Conservatives won 53 seats, the Farnham Residents Party won 3 and an Independent won the remaining seat. However, before the 2019 election the composition of the council had changed through by-elections to 50 Conservatives, 6 Farnham Residents and 1 Liberal Democrat. [3]

2019 Waverley Borough Council election
PartyCandidatesSeatsGainsLossesNet gain/lossSeats %Votes %Votes+/−
  Conservative 5723030Decrease2.svg 3040.439.725,749–12.3
  Residents 1715120Increase2.svg 1226.319.612,734+14.4
  Liberal Democrats 2714140Increase2.svg 1424.626.517,150+11.5
  Labour 20220Increase2.svg 23.56.74,362–5.8
  Green 6220Increase2.svg 23.54.93,205+1.8
  Independent 2100Steady2.svg1.81.91,230–5.2

Following the election, a Liberal Democrat - Farnham Residents Association - Labour - Green coalition was formed, replacing the previous Conservative administration.

Cllr Paul Follows (Liberal Democrat) became leader of the council with Cllr Peter Clark (Farnham Residents Association) becoming his deputy.

Ward Results

Alford, Cranleigh Rural and Ellens Green

Alford, Cranleigh Rural and Ellens Green (1 seat)
PartyCandidateVotes%±%
Conservative Kevin Deanus Unopposed N/A -62.9
Turnout N/AN/A
Conservative hold Swing

Blackheath and Wonersh

Blackheath and Wonersh (1 seat)
PartyCandidateVotes%±%
Conservative Michael Goodridge 387 58.1 +58.1
Liberal Democrats Robert Ellis16324.5N/A
Green Richard Goldsmith9013.5N/A
Labour Simon Hall263.9N/A
Turnout 67345.2+45.2
Conservative hold Swing

Bramley, Busbridge and Hascombe

Bramley, Busbridge and Hascombe (2 seats)
PartyCandidateVotes%±%
Conservative Richard Seaborne 774 62.5 -5.0
Green Martin D'Arcy 590 47.7 N/A
Conservative Stewart Stennett53843.5-31.3
Turnout 1,25234.9
Conservative hold Swing
Green gain from Conservative Swing

Chiddingfold and Dunsfold

Chiddingfold and Dunsfold (2 seats)
PartyCandidateVotes%±%
Conservative John Gray 617 55.0 -3.6
Conservative Anna James 606 54.0 -10.9
Green Lou Whyte40636.2N/A
Liberal Democrats John Leston34430.7N/A
Labour Tony Johnson12110.8-9.9
Turnout 1,13737.3
Conservative hold Swing

Cranleigh East

Cranleigh East (3 seats)
PartyCandidateVotes%±%
Liberal Democrats Richard Cole 779 46.5 +22.0
Liberal Democrats Ruth Reed 702 41.9 +18.8
Conservative Mary Foryszewski 678 40.4 -5.6
Liberal Democrats Ken Reed66439.6+14.5
Conservative Angela Richardson 64838.6-6.0
Conservative Andrew Blurton61036.4-7.3
Labour Mark West28016.7+2.5
Turnout 1,71633.3
Liberal Democrats gain from Conservative Swing
Conservative hold Swing

Cranleigh West

Cranleigh West (2 seats)
PartyCandidateVotes%±%
Conservative Liz Townsend 669 60.8 +9.5
Conservative Patricia Ellis 560 50.9 -5.4
Liberal Democrats Nigel Sanctuary43139.1+8.7
Liberal Democrats Fabian Cole36933.5+10.6
Turnout 1,12535.9
Conservative hold Swing

Elstead and Thursley

Elstead and Thursley (2 seats)
PartyCandidateVotes%±%
Conservative Jenny Else 819 78.5 +11.4
Conservative David Else 744 71.3 +13.4
Labour Jessica Webster27226.1N/A
Turnout 1,08335.5
Conservative hold Swing

Ewhurst

Ewhurst (1 seat)
PartyCandidateVotes%±%
Conservative Val Henry 461 76.3 +19.9
Labour James Mitchell14323.7N/A
Turnout 62538.6
Conservative hold Swing

Farnham Bourne

Farnham Bourne (2 seats)
PartyCandidateVotes%±%
Residents Roger Blishen 749 58.7 N/A
Conservative Carole Cockburn 679 53.2 +53.2
Liberal Democrats Cosmo Lupton38029.8N/A
Conservative Martin Lear37929.7+29.7
Turnout 1,28040.7
Residents gain from Conservative Swing
Conservative hold Swing

Farnham Castle

Farnham Castle (2 seats)
PartyCandidateVotes%±%
Residents David Beaman 885 70.6 +22.6
Residents George Hesse 813 64.8 N/A
Liberal Democrats Peter Telford29023.1-10.8
Conservative Sarah Anson19315.4-21.3
Conservative Liz Wheatley1249.9-19.6
Turnout 1,26239.8
Residents hold Swing
Residents gain from Conservative Swing

Farnham Firgrove

Farnham Firgrove (2 seats)
PartyCandidateVotes%±%
Residents Jerry Hyman 853 63.0 N/A
Residents John Neale 767 56.6 N/A
Liberal Democrats Adam Chambers31022.9-6.5
Conservative Simon Foale27220.1-31.7
Conservative Sam Pritchard25618.9-19.5
Labour Anthony Watts876.4-11.1
Turnout 1,36242.0
Residents gain from Conservative Swing

Farnham Hale and Heath End

Farnham Hale and Heath End (2 seats)
PartyCandidateVotes%±%
Residents Sally Dickson 821 72.2 N/A
Residents Michaela Gray 709 62.4 N/A
Conservative Mike Hodge26623.4-26.7
Conservative Denise Le Gal21518.9-20.3
Labour Rebecca Kaye12811.3-10.1
Turnout 1,14334.5
Residents gain from Conservative Swing

Farnham Moor Park

Farnham Moor Park (2 seats)
PartyCandidateVotes%±%
Residents Andy MacLeod* 992 74.9 +35.2
Residents Michaela Martin 899 67.8 N/A
Liberal Democrats Richard Soper26019.6-5.6
Conservative Pat Frost24618.6-24.3
Conservative Rashida Nasir14811.2-25.0
Turnout 1,33236.2
Residents gain from Independent Swing
Residents gain from Conservative Swing

Farnham Shortheath and Boundstone

Farnham Shortheath and Boundstone (2 seats)
PartyCandidateVotes%±%
Residents John Ward 814 71.0 +37.6
Residents Kika Mirylees 790 68.9 +18.0
Conservative Adrian Waller22519.6-25.9
Conservative Tom van den Broek21718.9-15.5
Labour Andrew Jones11810.3-4.1
Turnout 1,15635.4
Residents gain from Conservative Swing
Residents hold Swing

Farnham Upper Hale

Farnham Upper Hale (2 seats)
PartyCandidateVotes%±%
Residents Penny Marriott 813 75.7 +27.0
Residents Peter Marriott 690 64.2 +26.6
Labour Howard Kaye18617.3+2.3
Conservative Owen Barry17316.1-26.4
Conservative Stephen Barr12111.3-21.9
Turnout 1,08133.8
Residents hold Swing
Residents gain from Conservative Swing

Farnham Weybourne and Badshot Lea

Farnham Weybourne and Badshot Lea (2 seats)
PartyCandidateVotes%±%
Liberal Democrats Daniel Hunt 701 50.7 +17.0
Liberal Democrats Mark Merryweather 604 43.6 N/A
Residents Bob Blower45632.9N/A
Residents David Quick38828.0N/A
Conservative Chris Storey20915.1-25.6
Conservative Nabeel Nasir16111.6-28.2
Labour Joan Anniballi654.7-14.0
Turnout 1,39641.1
Liberal Democrats gain from Conservative Swing

Farnham Wrecclesham and Rowledge

Farnham Wrecclesham and Rowledge (2 seats)
PartyCandidateVotes%±%
Residents Brian Edmonds 675 52.1 N/A
Residents Peter Clark 620 47.8 N/A
Conservative Robert Ramsdale39030.1-20.0
Conservative Lynley Griffiths31524.3-31.6
Liberal Democrats Rosamund Lupton26520.4N/A
Labour Tim Corry1199.2-12.5
Turnout 1,30538.8
Residents gain from Conservative Swing

Frensham, Dockenfield and Tilford

Frensham, Dockenfield and Tilford (2 seats)
PartyCandidateVotes%±%
Conservative Brian Adams 683 60.7 +60.7
Conservative Julia Potts 590 52.4 +52.4
Green Susan Ryland45440.3N/A
Labour Natasha Fletcher22820.2N/A
Turnout 1,14637.5
Conservative hold Swing

Godalming Binscombe

Godalming Binscombe (2 seats)
PartyCandidateVotes%±%
Liberal Democrats Paul Rivers 729 63.9 +28.3
Labour Nick Palmer 467 40.9 +7.9
Conservative Anne Gray37532.9-10.8
Conservative David Hunter30226.5-22.2
Turnout 1,16438.0
Liberal Democrats gain from Conservative Swing
Labour gain from Conservative Swing

Godalming Central and Ockford

Godalming Central and Ockford (2 seats)
PartyCandidateVotes%±%
Liberal Democrats Paul Follows 1,073 74.1 N/A
Liberal Democrats Anne-Marie Rosoman 878 60.6 N/A
Conservative Kirsty Walden29220.2-31.1
Conservative Tristan Hopper27519.0-25.5
Labour Richard Ashworth17912.4-19.9
Turnout 1,45939.8
Liberal Democrats gain from Conservative Swing

Godalming Charterhouse

Godalming Charterhouse (2 seats)
PartyCandidateVotes%±%
Green Steve Williams 865 67.6 +34.1
Conservative Steve Cosser 504 39.4 -20.1
Labour Kate Cooney44634.8+8.9
Conservative Andrew Bolton42233.0-17.4
Turnout 1,29247.3
Green gain from Conservative Swing
Conservative hold Swing

Godalming Farncombe and Catteshall

Godalming Farncombe and Catteshall (2 seats)
PartyCandidateVotes%±%
Liberal Democrats Penny Rivers 1,012 73.7 +46.1
Labour George Wilson 484 35.3 +17.3
Conservative Nicholas Williams39528.8-11.1
Conservative Ross Welland31723.1-21.6
Turnout 1,39638.3
Liberal Democrats gain from Conservative Swing
Labour gain from Conservative Swing

Godalming Holloway

Godalming Holloway (2 seats)
PartyCandidateVotes%±%
Liberal Democrats Joan Heagin 1,034 61.6 N/A
Conservative Peter Martin 737 43.9 -27.0
Conservative Tom Martin64238.3-26.6
Labour Toby Westcott-White46527.7-1.9
Turnout 1,69850.8
Liberal Democrats gain from Conservative Swing
Conservative hold Swing

Haslemere Critchmere and Shottermill

Haslemere Critchmere and Shottermill (3 seats)
PartyCandidateVotes%±%
Liberal Democrats Jacqueline Robini 1,034 57.1 +23.0
Liberal Democrats Peter Nicholson 894 49.4 +24.2
Liberal Democrats John Robini 887 49.0 +24.8
Conservative James Edwards61934.2-18.4
Conservative Carole King56631.3-16.5
Conservative Phoebe Sullivan47226.1-18.9
UKIP Adam Wade18410.2N/A
Turnout 1,83741.6
Liberal Democrats gain from Conservative Swing

Haslemere East and Grayswood

Haslemere East and Grayswood (3 seats)
PartyCandidateVotes%±%
Conservative Simon Dear 1,001 45.6 -1.2
Conservative Stephen Mulliner 999 45.1 -7.8
Conservative Robert Knowles 976 44.1 -6.5
Liberal Democrats Terry Weldon81937.0N/A
Green Gary Lloyd80036.1N/A
Liberal Democrats Elizabeth Pamplin79635.9+13.3
Labour Adrian La Porta2029.1-6.5
Turnout 2,27944.5
Conservative hold Swing

Hindhead

Hindhead (2 seats)
PartyCandidateVotes%±%
Liberal Democrats Jerome Davidson 544 48.6 +32.7
Conservative Peter Isherwood 542 48.4 -12.0
Liberal Democrats Geoffrey Whitby54248.4+34.5
Conservative Gerrard Hall43739.0-19.8
Labour David Irwin797.1N/A
Turnout 1,16035.6
Liberal Democrats gain from Conservative Swing
Conservative hold Swing

Milford

Milford (2 seats)
PartyCandidateVotes%±%
Liberal Democrats Christine Baker 646 50.7 N/A
Independent John Lee 629 49.3 +13.6
Conservative Simon Drake35627.9-35.5
Conservative Adam Taylor-Smith31524.7-12.6
UKIP Rosaleen Egan20315.9-7.1
Turnout 1,28241.0
Liberal Democrats gain from Conservative Swing
Independent gain from Conservative Swing

Shamley Green and Cranleigh North

Shamley Green and Cranleigh North (1 seat)
PartyCandidateVotes%±%
Conservative Chris Howard Unopposed N/A -79.5
Turnout N/AN/A
Conservative hold Swing

Witley and Hambledon

Witley and Hambledon (2 seats)
PartyCandidateVotes%±%
Conservative Jan Floyd-Douglass 617 51.0 -11.7
Conservative Trevor Sadler 615 50.9 -2.5
Independent Maxine Gale60149.7N/A
Labour George Davies26722.1+5.0
Turnout 1,22540.7
Conservative hold Swing

By-elections

Milford

Milford: 13 February 2020
PartyCandidateVotes%±%
Independent Maxine Gale 452 50.6 N/A
Conservative Carmel Oates32836.7+8.8
Independent Rosaleen Egan11312.7-3.2
Majority12413.9
Turnout 89328.1-12.9
Independent gain from Independent Swing N/A

Cranleigh East

Cranleigh East: 7 October 2021
PartyCandidateVotes%±%
Liberal Democrats Philip Townsend 903 56.8 +10.3
Conservative Rosemary Burbridge68643.2+4.6
Majority21713.6
Turnout 1,58930.6-2.7
Liberal Democrats hold Swing +2.8

Frensham, Dockenfield & Tilford

Frensham, Dockenfield & Tilford: 12 May 2022
PartyCandidateVotes%±%
Independent David Munro 492 42.1 N/A
Green Susan Ryland35430.3-10.0
Conservative Nabeel Nasir32327.6-33.1
Majority13811.8
Turnout 1,16935.9-1.6
Independent gain from Conservative Swing N/A

Hindhead

Hindhead: 23 June 2022
PartyCandidateVotes%±%
Liberal Democrats Julian Spence 537 54.6 +6.2
Conservative Ged Hall44645.4-3.0
Majority919.2
Turnout 98329.8-5.8
Liberal Democrats gain from Conservative Swing +4.6

Chiddingfold and Dunsfold

Chiddingfold and Dunsfold: 1 December 2022
PartyCandidateVotes%±%
Liberal Democrats Dave Busby 652 66.6
Conservative Ian Mitchell29730.3
Labour Rebecca Aitken303.1
Majority35536.3
Turnout 979
Liberal Democrats gain from Conservative Swing

Related Research Articles

<span class="mw-page-title-main">South West Surrey (UK Parliament constituency)</span> Parliamentary constituency in the United Kingdom, 1983 onwards

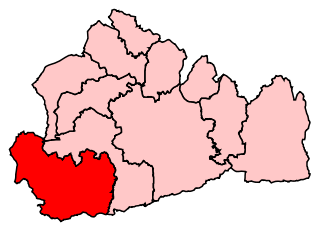
South West Surrey is a constituency represented in the House of Commons of the UK Parliament. Since 2005, the seat has been represented by Conservative MP Jeremy Hunt, the current chancellor of the Exchequer and the former Culture Secretary, Health Secretary and Foreign Secretary.

<span class="mw-page-title-main">Wimbledon (UK Parliament constituency)</span> Parliamentary constituency in the United Kingdom, 1885 onwards

Wimbledon is a constituency in Greater London represented in the House of Commons of the UK Parliament. Since 2005, the seat has been held by Stephen Hammond of the Conservative Party.

<span class="mw-page-title-main">Brent London Borough Council elections</span> Local elections in London

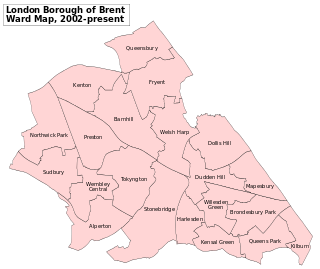
Brent London Borough Council in London, England is elected every four years. Since the last boundary changes in 2002, 63 councillors have been elected from 21 wards.

Elections to Slough Borough Council were held on 4 May 2006. One third of the council was up for election. This was the 121st Slough general local authority election since Slough became a local government unit in 1863.

An election to Slough Borough Council was held on 10 June 2004. The whole council was up for election. This was the 120th Slough general local authority election, since Slough became a local government unit in 1863, including both whole Council elections and elections by thirds.

Elections to the Borough Council in Slough, England, were held on 3 May 2007. One third of the council was up for election. This was the 122nd Slough general local authority election since Slough became a local government unit in 1863.

<span class="mw-page-title-main">2010 Barking and Dagenham London Borough Council election</span> 2010 local election in England

The 2010 Barking and Dagenham Council election took place on 6 May 2010 to elect members of Barking and Dagenham London Borough Council in London, England.

<span class="mw-page-title-main">Merton London Borough Council elections</span> Political party in the United Kingdom

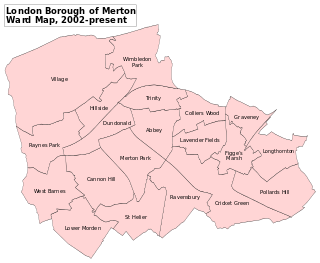
Merton London Borough Council in London, England is elected every four years; it has administrative control over the London Borough of Merton.

<span class="mw-page-title-main">2010 Barnet London Borough Council election</span> 2010 local election in England

The 2010 Barnet Council election took place on 6 May 2010 to elect members of Barnet London Borough Council in London, England. The whole council was up for election and the Conservative party stayed in overall control of the council.

<span class="mw-page-title-main">2015 Blackpool Borough Council election</span> Local election in Blackpool, England

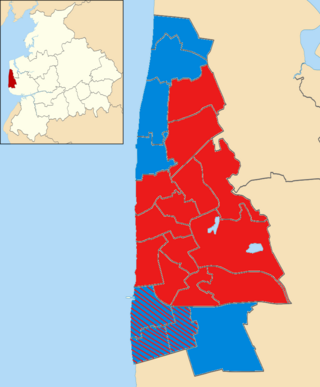
The 2015 Blackpool Borough Council election took place on 7 May 2015 to elect members of Blackpool Borough Council in England. All 21 wards of 2 seats each on the council were contested with newly elected members next due to serve a four-year term and next contest their seats in 2019. This election took place on the same day as other local elections as well as the 2015 UK General Election.

The 1982 Barking and Dagenham Borough Council election took place on 6 May 1982 to elect members of Barking and Dagenham London Borough Council in London, England. The whole council was up for election and the Labour Party stayed in overall control of the council.

The 1986 Barking and Dagenham Borough Council election took place on 8 May 1986 to elect members of Barking and Dagenham London Borough Council in London, England. The whole council was up for election and the Labour Party stayed in overall control of the council.

The 1990 Barking and Dagenham Borough Council election took place on 3 May 1990 to elect members of Barking and Dagenham London Borough Council in London, England. The whole council was up for election and the Labour Party stayed overwhelmingly in overall control of the council.

The 1994 Barking and Dagenham Borough Council election took place on 5 May 1994 to elect members of Barking and Dagenham London Borough Council in London, England. The whole council was up for election and the Labour Party stayed in overall control of the council.

Elections for the London Borough of Merton were held on 8 May 1986 to elect members of Merton London Borough Council in London, England. This was on the same day as other local elections in England and Scotland.

<span class="mw-page-title-main">2018 Barnet London Borough Council election</span> 2018 local election in England

The 2018 Barnet Borough Council election took place on 3 May 2018 to elect members of Barnet Borough Council in England. It took place on the same day as other local elections in 2018. In the last election, the Conservatives won control of the council with 32 seats, compared to 30 for Labour and 1 for the Liberal Democrats. On 15 March 2018, following the resignation of a Conservative councillor, the council was in a state of no overall control. The election on 3 May 2018 saw the Conservatives take back overall control with a majority of 13.

<span class="mw-page-title-main">2002 Merton London Borough Council election</span>

Elections for the London Borough of Merton were held on 2 May 2002. This was on the same day as other local elections in England. These elections were held under new ward boundaries, which increased the number of councillors to sixty from fifty-seven. Labour remained in overall control of the council with a reduced majority.

<span class="mw-page-title-main">2019 Guildford Borough Council election</span> Local election in Surrey, England

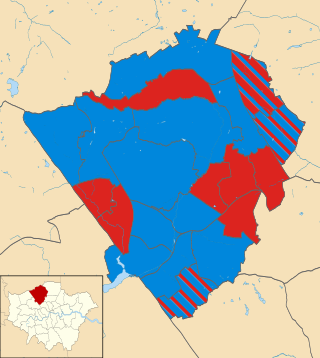
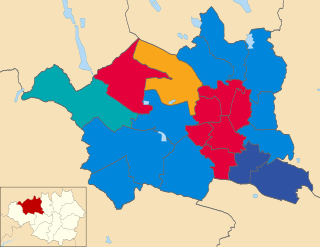
The 2019 Guildford Borough Council election were held on 2 May 2019, to elect all 48 seats to the Guildford Borough Council in Surrey, England as part of the 2019 local elections.

<span class="mw-page-title-main">2021 Bolton Metropolitan Borough Council election</span>

The 2021 Bolton Metropolitan Borough Council election to elect members of Bolton Metropolitan Borough Council took place on 6 May 2021, on the same day as other local elections.

<span class="mw-page-title-main">2022 Colchester Borough Council election</span> 2022 UK local government election

Elections to Colchester Borough Council took place on 5 May 2022. Eighteen members of the council were elected: one from 16 of the 17 wards, and two councillors from New Town & Christ Church ward, following the death of incumbent councillor Nick Cope, elected in 2019 and due to serve until 2023.

References

  1. "Upcoming elections & referendums". The Electoral Commission. Archived from the original on 24 May 2019. Retrieved 27 June 2019.
  2. "2 May 2019 local election results" Waverley Borough Council. Accessed 2019-06-27.
  3. "Your Councillors". modgov.waverley.gov.uk. 26 July 2019.