Related Research Articles
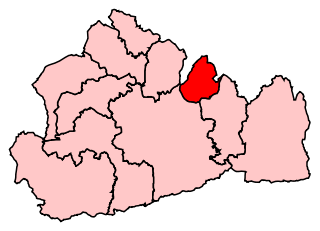
Epsom and Ewell is a constituency in Surrey represented in the House of Commons of the UK Parliament since 2001 by Chris Grayling, a Conservative.

Elections to Amber Valley Borough Council were held on 10 June 2004. One third of the council was up for election and the Conservative Party held overall control of the council. Overall turnout was 44%.

Elections to Amber Valley Borough Council were held on 4 May 2006. One third of the council was up for election and the Conservative Party held overall control of the council. Overall turnout was 34%.

Elections to Amber Valley Borough Council were held on 3 May 2007. One third of the council was up for election and the Conservative Party held overall control of the council. Overall turnout was 37.7%.

One third of Mole Valley District Council in Surrey, England is elected each year, followed by one year when there is an election to Surrey County Council instead.
Elections to Mole Valley Council were held on 7 May 1998. One third of the council was up for election and the council stayed under no overall control.
Elections to Mole Valley Council were held on 6 May 1999. One third of the council was up for election and the council stayed under no overall control.
Elections to Mole Valley Council were held on 4 May 2000. The whole council was up for election with boundary changes since the last election in 1999. The council stayed under no overall control.
Elections to Mole Valley Council were held on 2 May 2002. One third of the council was up for election and the council stayed under no overall control.
Elections to Mole Valley Council were held on 1 May 2003. One third of the council was up for election and the council stayed under no overall control.
Elections to Mole Valley Council were held on 10 June 2004. One third of the council was up for election and the council stayed under no overall control. Overall turnout was 49.8%.
Elections to Mole Valley Council were held on 3 May 2007. One third of the council was up for election and the Conservative Party kept overall control of the council. Overall turnout was 46.5%.
Elections to Mole Valley Council were held on 1 May 2008. One third of the council was up for election and the Conservative Party stayed in overall control of the council. Overall turnout was 46.5% a drop from the 47.2% seen in the 2007 election.

The 2010 Winchester Council election took place on 6 May 2010 to elect members of Winchester District Council in Hampshire, England. One third of the council was up for election and the Liberal Democrats gained overall control of the council from the Conservative Party.

Local elections were held in the United Kingdom in 1980. These were the first annual local elections for the new Conservative Prime Minister Margaret Thatcher. Though the Conservatives in government lost seats, the projected share of the vote was close: Labour Party 42%, Conservative Party 40%, Liberal Party 13%. Labour were still being led by the former prime minister James Callaghan, who resigned later in the year to be succeeded by Michael Foot.

The 2011 Amber Valley Borough Council election took place on 5 May 2011 to elect members of Amber Valley Borough Council in Derbyshire, England. One third of the council was up for election and the Conservative Party stayed in overall control of the council.
The 2015 Mole Valley District Council election took place on 7 May 2015 to elect approximately one-third of members to Mole Valley District Council in England coinciding with other local elections held simultaneously with a general election which resulted in increased turnout compared to the election four years before. Some two-member wards such as Holmwoods did not hold a local election in this year, being contested in even-numbered years.

The 2018 United Kingdom local elections were held on Thursday 3 May 2018, with local council elections taking place in all 32 London boroughs, 34 metropolitan boroughs, 67 district and borough councils and 17 unitary authorities. There were also direct elections for the mayoralties of Hackney, Lewisham, Newham, Tower Hamlets and Watford.
The 2019 Mole Valley District Council election took place on 2 May 2019 to elect approximately one-third of members to Mole Valley District Council in England, coinciding with other local elections held simultaneously across 248 councils in England and all 11 councils in Northern Ireland. The 2019 Mole Valley local election outcomes are outlined below in the summary results chart and the detailed results charts for each ward. The 2019 election results are compared against the results when these wards were last contested four years previously, on the same day as the General Election of May 2015. The difference in the results for certain political parties is stark. This is largely influenced by an excellent result for the Conservatives on their general election winning day in May 2015, but a terrible result for the Conservatives in May 2019 when, nationally, the Government of Theresa May had failed to ‘deliver Brexit’ by the anticipated date of 29 March 2019. But even taking the national backdrops of these two very different local elections into account, it was still a spectacularly poor set of results for the Conservatives in Mole Valley in these 2019 local elections and a very good set of results for the Liberal Democrats. Some Mole Valley wards did not hold a local election in 2019, being contested instead in even-numbered years.
The 2018 Mole Valley District Council election took place on 3 May 2018 to elect approximately one-third of members to Mole Valley District Council in England, coinciding with other local elections. The Conservatives went into the elections with a majority of 1, but lost control of the council, leaving it with no overall majority. The 2018 election results are compared against the results when these wards were last contested four years previously, in 2014.
References
- 2006 Mole Valley election result
- Ward results Archived 14 December 2007 at the Wayback Machine