
Norfolk is a county in East Anglia in England. It borders Lincolnshire to the northwest, Cambridgeshire to the west and southwest, and Suffolk to the south. Its northern and eastern boundaries are the North Sea and to the northwest, The Wash. The county town is the city of Norwich. With an area of 2,074 square miles (5,370 km2) and a population of 859,400, Norfolk is a largely rural county with a population density of 401 per square mile. Of the county's population, 40% live in four major built up areas: Norwich (213,000), Great Yarmouth (63,000), King's Lynn (46,000), and Thetford (25,000).
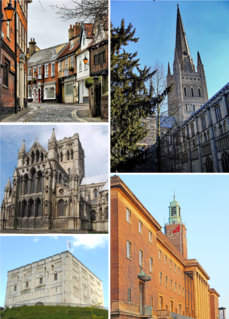
Norwich is a city in Norfolk, on the River Wensum about 100 miles (160 km) north-east of London. As the county town of Norfolk and seat of the See of Norwich, with one of the country's largest medieval cathedrals, it is claimed traditionally as the chief city of East Anglia. The population of the Norwich City Council local authority area was estimated at 143,135 in 2019, whilst the wider built-up area had a population of 213,166.
One third of the Norwich District City Council in Norfolk, England is elected each year, followed by one year without election. Since the last boundary changes in 2004, 39 councillors have been elected from 13 wards.

Local elections were held in the United Kingdom on 6 May 1976. Elections were for one third of the seats on Metropolitan borough councils and for all seats on Non-Metropolitan district councils in England; and for all seats on the Welsh district councils.

Adrian Philip Ramsay is a former British politician who served as Deputy Leader of the Green Party of England and Wales from 2008 to 2012 and as Chief Executive of the Centre for Alternative Technology from 2014 to 2018. He was a Norwich City Councillor from 2003 to 2011.
The 2010 United Kingdom local elections were held on Thursday 6 May 2010, when the 2010 general election also took place. Direct elections were held to all 32 London boroughs, all 36 metropolitan boroughs, 76 second-tier district authorities, 20 unitary authorities and various Mayoral posts, all in England. For those authorities elected "all out" these were the first elections since 2006. The results provided some comfort to the Labour Party, losing the general election on the same day, as it was the first time Conservative councillor numbers declined since 1996.

The 2008 Norwich City Council election took place on 1 May 2008 to elect members of Norwich City Council in England. One third of seats were up for election. This was on the same day as other local elections.

The 2007 Norwich City Council election took place on 3 May 2007 to elect members of Norwich City Council in England. One third of seats (13) were up for election. This was on the same day as other local elections.
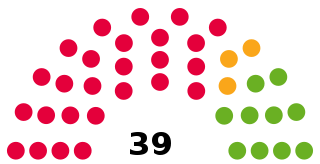
Norwich City Council is the city council for the city of Norwich, Norfolk, England. It consists of 39 councillors, elected to represent 13 wards, each with three councillors. It is currently under Labour control and led by Alan Waters. It forms the lower tier of local government in Norwich, responsible for local services such as housing, planning, leisure and tourism.

The 2011 Norwich City Council election took place on 5 May 2011 to elect members of Norwich City Council in England. One third of seats were up for election. This was on the same day as other local elections and the nationwide referendum on the Alternative Vote.
Elections to Norwich City Council took place on 3 May 2012, the same day as other 2012 United Kingdom local elections. Fifteen out of thirty-nine council seats were up for election and the Labour party gained control of the council from No Overall Control.
Council elections for the Norwich City Council were held on 22 May 2014 as part of the 2014 United Kingdom local elections. The elections were moved from earlier on in May to coincide with the East of England 2014 European Parliament election.

The 2015 Norwich City Council election took place on 7 May 2015 to elect approximately one third of the members of Norwich City Council in England. This was on the same day as other local elections and the UK general election. Thirteen seats were due to be contested, with a further two seats up for election where casual vacancies had arisen. Labour won ten of the available seats, the Green Party won four, and the Liberal Democrats one. The Conservatives gained their highest ever vote in many city wards including Town Close and Thorpe Hamlet, and across Norwich came within almost 2000 votes of the Green Party, however failed to gain any seats. Just one seat changed hands - Wensum - which Labour gained from the Greens. Labour retained overall control of the council with 22 seats out of 39, the Greens continue to form the main opposition with 14 seats, and the Liberal Democrats have 3.
The 2016 Norwich City Council election took place on 5 May 2016 to elect members of Norwich City Council in England. This was on the same day as other local elections. The Labour Party increased their majority at the expense of the Green Party, capturing 4 previously Green-held seats; the Greens retained only Thorpe Hamlet ward, by a margin of 31 votes.
The 2010 Norwich City Council election took place on 9 September 2010 to elect members of Norwich City Council in England. One third of seats were up for election. The elections took place later in the year than other local elections. Norwich had previously been granted permission to become a unitary authority, with local elections postponed until 2011. When the Coalition Government won the general election earlier that year, Norwich's permission to form a unitary authority was overturned. Because of this, the High Court ruled that those councillors who had stayed on beyond their four-year term were no longer constitutionally elected, and would need to seek re-election. This resulted in there being an election in every ward in September to renew the mandate for the wards.

The 2018 Norwich City Council election took on 3 May 2018 to elect members of Norwich City Council in England. This was on the same day as other local elections. 13 of 39 seats (one-third) were up for election.

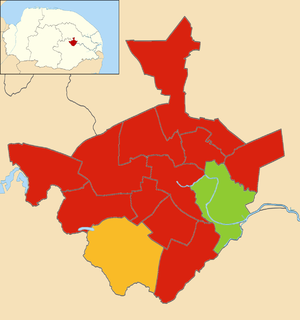
Elections to Norwich City Council were held on 2 May 2019. Following boundary changes, all 39 seats were put up for election, with three councillors being elected per ward using the block vote system. The election saw the Green Party reclaim five seats from the Labour Party, while the Labour Party retained its majority on the council.

The 2010 Exeter City Council election took place on 9 September 2010 to elect members of Exeter City Council in England. One third of seats were up for election. The elections took place later in the year than other local elections. Exeter had previously been granted permission to become a unitary authority, with local elections postponed until 2011. When the Coalition Government won the general election earlier that year, Exeter's permission to form a unitary authority was overturned. Because of this, the High Court ruled that those councillors who had stayed on beyond their four-year term were no longer constitutionally elected, and would need to seek re-election. This resulted in there being an election in every ward in September to renew the mandate for the wards.

The 2004 Norwich City Council election took place on 10 June 2004 to elect members of Norwich City Council in England. This was on the same day as other local elections. This was the first election to be held under new ward boundaries, which reduced the number of seats from 48 to 39. As a result, all seats were up for election. The Liberal Democrats lost overall control of the council, which fell under no overall control.

The 2021 Norwich City Council election took on 6 May 2021 to elect members of Norwich City Council in England. This was on the same day as other local elections. 13 of 39 seats (one-third) were up for election.
