2011 Norwich City Council election

Last updated

2011 Norwich City Council election
  2010 5 May 2011 2012  

13 of 39 seats (One Third) to Norwich City Council
20 seats needed for a majority
 First partySecond party
 
Party Labour Green
Seats before1614
Seats won75
Seats after1815
Seat changeIncrease2.svg2Increase2.svg1
Popular vote14,99011,388
Percentage36.8%28.0%
SwingIncrease2.svg7.9%Increase2.svg1.2%

 Third partyFourth party
 
Party Liberal Democrats Conservative
Seats before54
Seats won10
Seats after42
Seat changeDecrease2.svg1Decrease2.svg2
Popular vote5,1018,345
Percentage12.5%20.5%
SwingDecrease2.svg10.6%Increase2.svg0.2%

Norwich wards 2014, 2012, 2011 and 2010.png
Map showing the 2011 local election results in Norwich.

Council control before election

No Overall Control

Council control after election

No Overall Control

The 2011 Norwich City Council election took place on 5 May 2011 to elect members of Norwich City Council in England. One third of seats were up for election. [1] This was on the same day as other local elections and the nationwide referendum on the Alternative Vote.

Contents

All changes in vote share are calculated with reference to the 2007 election, the last time these seats were contested.

Summary

Labour gained Bowthorpe and Catton Grove from the Conservatives, while the Greens seized Thorpe Hamlet from the Liberal Democrats.

In the affluent south west of the city, the Conservatives and Liberal Democrats had fought very hard to win Eaton following the decision of sitting Liberal Democrat Councillor, Ros Wright (wife of Norwich South MP Simon Wright), to stand down. The Liberal Democrats held on with Caroline Ackroyd securing a majority of 129, although there was a 4.9% swing to the Conservative candidate Chris Groves. Turnout was once again the highest in the city at 58.6%.

After the election, the new makeup of the City Council was:

Turnout across the city was 40.2%, with the AV Referendum being seen as partly responsible for the marked rise.

Election result

Norwich City Council Election, 2011 [1]
PartySeatsGainsLossesNet gain/lossSeats %Votes %Votes+/−
  Labour 720+253.836.814,990+7.9
  Green 510+138.528.011,388+1.2
  Conservative 002-20.020.58,345+0.2
  Liberal Democrats 101-17.712.55,101-10.6
  UKIP 00000.02.2904+1.3

Changes in vote share are relative to the last time these seats were contested in 2007.

Council Composition

Prior to the election the composition of the council was:

161454
LabourGreenLib DemCon

After the election, the composition of the council was:

181542
LabourGreenLib DemCon

Ward results

Bowthorpe

Bowthorpe
PartyCandidateVotes%±%
Labour Mike Sands1,38145.8+8.1
Conservative Andrew Wiltshire1,05334.9-3.2
Green Jean Kathleen Bishop40613.5+0.3
Liberal Democrats Haydn Perrett1735.7-5.3
Majority32810.9
Turnout 3,01335.8
Labour gain from Conservative Swing +5.7

Catton Grove

Catton Grove
PartyCandidateVotes%±%
Labour Paul Kendrick1,15242.8+6.1
Conservative Evelyn Jean Collishaw92233.2-8.8
Green Lee Claire Cozens28410.2-2.9
UKIP Paul Williams2218.0n/a
Liberal Democrats Chris Thomas1966.9-1.2
Majority2309.6
Turnout 277535.3
Labour gain from Conservative Swing

Crome

Crome
PartyCandidateVotes%±%
Labour Alan Henry Waters145052.4+8.0
Conservative Christopher John Baxter68424.7-2.7
Green Christine Patricia Way2679.7-2.4
UKIP Wendy Jane Atkinson2177.8n/a
Liberal Democrats Alexander Lofgren Findlow1485.4-10.7
Majority76627.7
Turnout 276638.2
Labour hold Swing

Eaton

Eaton
PartyCandidateVotes%±%
Liberal Democrats Caroline Sarah Ackroyd1,46734.2-6.5
Conservative Chris Groves1,33831.2-1.8
Labour Verity Jane Sinclair93721.8+10.0
Green Jeremy Bartlett54912.8+1.3
Majority1293.0
Turnout 4,29158.6
Liberal Democrats hold Swing

Lakenham

Lakenham
PartyCandidateVotes%±%
Labour Keith Malcolm Driver1,24441.6+2.1
Liberal Democrats Helen Anne Whitworth63721.3-14.9
Green Penny Edwards55418.5+8.5
Conservative Mathew John Morris24311.8+1.9
UKIP Steve Emmens2016.7+2.3
Majority60720.3
Turnout 2,98941.6
Labour hold Swing

Mancroft

Mancroft
PartyCandidateVotes%±%
Green Amy Grace Stammers1,35541.5+1.9
Labour Co-op Marion Frances Maxwell1,09233.4+6.9
Conservative Stefan Richard Rose49115.0-0.3
Liberal Democrats Simon Richard Nobbs33010.1-8.4
Majority2638.1+1.6
Turnout 3,26841.0
Green hold Swing

Miles Cross

Mile Cross
PartyCandidateVotes%±%
Labour Ralph Edward Gayton1,22751.0+7.4
Conservative Oscar Pinnington44518.5+5.4
Green Ben Francis Duffy34314.2+1.4
Liberal Democrats Carl Edward Mayhew28812.0-18.4
UKIP Richard Crooks1054.4n/a
Majority78232.5
Turnout 2,40832.0
Labour hold Swing

Nelson

Nelson
PartyCandidateVotes%±%
Green Denise Eileen Carlo2,05954.8-6.8
Labour Marian Chapman98626.2+13.3
Conservative Hannah Charley Feiner42511.3+2.5
Liberal Democrats Kate Hannah Atkins2887.7-9.1
Majority1,07328.6
Turnout 3,75849.5
Green hold Swing

Sewell

Sewell
PartyCandidateVotes%±%
Labour Julie Dawn Brociek-Coulton1,18741.2+2.2
Green Megan Susannah Lewis72025.0+1.0
Conservative Tony Barton57319.9+0.9
Liberal Democrats Ian Robert Williams2438.4-9.5
UKIP Glenn Stuart Tingle1605.5n/a
Majority46716.2
Turnout 2,88338.2
Labour hold Swing

Thorpe Hamlet

Thorpe Hamlet
PartyCandidateVotes%±%
Green Jo Henderson1,23839.3+4.8
Labour Co-op Michael John Stonard75323.9+8.4
Conservative William Samuel de Spretter69422.0+6.5
Liberal Democrats Jeremy Nigel Hooke46414.7-19.8
Majority58515.4
Turnout 3,14937.9
Green gain from Liberal Democrats Swing

Town Close

Town Close
PartyCandidateVotes%±%
Green Stephen Ralph Little176344.2-0.1
Labour Co-op Chris Ovel99124.8+9.9
Conservative Christopher David Benjamin76219.1+0.5
Liberal Democrats Mark Johnston46411.6-10.5
Majority77219.4
Turnout 398046.4
Green hold Swing

University

University
PartyCandidateVotes%±%
Labour Co-op Sarah Grenville1,38257.3+7.1
Green Robbie Laird47519.7+3.7
Conservative Tom Cannon32813.6+3.7
Liberal Democrats Andrew Norris Wright2289.4-11.1
Majority90737.6
Turnout 2,41331.3
Labour hold Swing

Wensum

Wensum
PartyCandidateVotes%±%
Green Lucy Frances Galvin1,37543.7-5.4
Labour Co-op Thomas Vaughan1,20838.4+13.7
Conservative Stephen Michael Karanicholas38712.3+1.2
Liberal Democrats Kathy Riviere1755.6-9.4
Majority1675.3
Turnout 3,14540.3
Green hold Swing

Related Research Articles

<span class="mw-page-title-main">Norwich North (UK Parliament constituency)</span> Parliamentary constituency in the United Kingdom, 1950 onwards

Norwich North is a constituency represented in the House of Commons of the UK Parliament since 2009 by Conservative Chloe Smith.

<span class="mw-page-title-main">Norwich South (UK Parliament constituency)</span> Parliamentary constituency in the United Kingdom, 1950 onwards

Norwich South is a constituency in Norfolk represented in the House of Commons of the Parliament of the United Kingdom, since 2015 by Clive Lewis, of the Labour Party.

<span class="mw-page-title-main">2006 United Kingdom local elections</span>

The 2006 United Kingdom local elections were held on Thursday 4 May 2006.

<span class="mw-page-title-main">Politics of Bristol</span> Overview of the politics of Bristol

The city of Bristol, England, is a unitary authority, represented by four MPs representing seats wholly within the city boundaries. As well as these, Filton and Bradley Stoke covers the northern urban fringe in South Gloucestershire and the north eastern urban fringe is in the Kingswood constituency. The overall trend of both local and national representation became left of centre during the latter 20th century, but there was a shift to the right in the 2010 general election. The city has a tradition of local activism, with environmental issues and sustainable transport being prominent issues in the city.

<span class="mw-page-title-main">2006 Colchester Borough Council election</span>

The 2006 Colchester Borough Council election took place on 4 May 2006 to elect members of Colchester Borough Council in Essex, England. One third of the council was up for election and the council stayed under no overall control.

<span class="mw-page-title-main">2009 Norfolk County Council election</span>

The Norfolk County Council election took place on 4 June 2009, coinciding with local elections for all county councils in England.

The 2009 Norwich North by-election was a by-election for the United Kingdom Parliament's House of Commons constituency of Norwich North. The by-election took place due to the resignation of Ian Gibson after being banned from standing as a Labour candidate for the next general election. The writ of election was moved on 30 June 2009 and the by-election took place on 23 July 2009, two days after the start of the summer recess. Unusually for a UK by-election, the counting process was not started until the following day, for a variety of reasons including the high number of postal votes.

<span class="mw-page-title-main">2008 Stroud District Council election</span>

The 2008 Stroud Council election took place on 1 May 2008 to elect members of Stroud District Council in Gloucestershire, England. One third of the council was up for election and the Conservative Party stayed in overall control of the council.

<span class="mw-page-title-main">2011 South Norfolk District Council election</span>

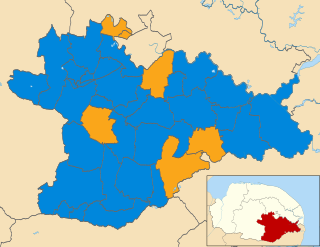
The elections to South Norfolk District Council were held on Thursday 5 May 2011 along with various other local elections around England, elections to the Scottish Parliament, National Assembly of Wales and Northern Ireland Assembly, and a referendum on whether to adopt the Alternative Vote electoral system for elections to the House of Commons. All 46 council seats were up for election. The previous council was controlled by the Conservatives, with the Liberal Democrats being the only opposition.

<span class="mw-page-title-main">2012 Norwich City Council election</span> 2012 city council election for Norwich, England

Elections to Norwich City Council took place on 3 May 2012, the same day as other 2012 United Kingdom local elections. Fifteen out of thirty-nine council seats were up for election and the Labour Party gained control of the council from No Overall Control.

<span class="mw-page-title-main">2013 Norfolk County Council election</span>

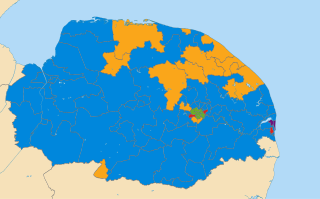
The Norfolk County Council election took place across Norfolk on 2 May 2013, coinciding with local elections for all county councils in England. The results were announced the following day, Friday 3 May 2013. The result brought to an end 12 years of Conservative administration, who finished three seats short of a majority after losing 20 seats, leaving the Council in no overall control (NOC). UKIP and the Labour Party both made gains of 14 and 11 seats respectively. The Liberal Democrats and the Green Party both lost three seats each, whilst an independent won a single seat in North Norfolk.

<span class="mw-page-title-main">2014 London local elections</span>

There were local government elections in London on Thursday 22 May 2014. All councillor seats on the 32 London borough councils were up for election. The electorates of Hackney, Lewisham, Newham and Tower Hamlets also elected their executive mayors, who operate in place of council leaders in those boroughs. Ward changes took place in Hackney, Kensington and Chelsea, and Tower Hamlets, which reduced the total number of councillors by 10 to 1,851. Both the mayoral and councillor elections are four-yearly.

<span class="mw-page-title-main">2014 Norwich City Council election</span> 2014 city council election for Norwich, England

Council elections for the Norwich City Council were held on 22 May 2014 as part of the 2014 United Kingdom local elections. The elections were moved from earlier on in May to coincide with the East of England 2014 European Parliament election.

<span class="mw-page-title-main">2015 United Kingdom general election in Scotland</span> List of election results

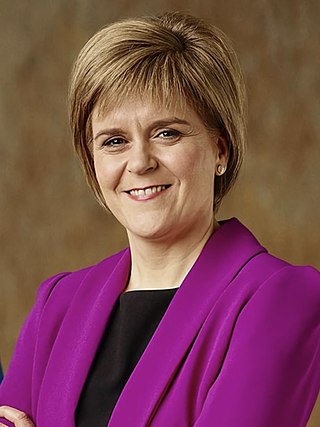
A general election was held in the United Kingdom on 7 May 2015 and all 59 seats in Scotland were contested under the first-past-the-post, single-member district electoral system. Unlike the 2010 general election, where no seats changed party, the Scottish National Party (SNP) won all but three seats in Scotland in an unprecedented landslide victory, gaining a total of 56 seats and taking the largest share of the Scottish vote in sixty years, at approximately 50 per cent. The Labour Party suffered its worst ever election defeat in Scotland, losing 40 of the 41 seats it was defending, including the seats of Scottish Labour leader Jim Murphy and the then Shadow Foreign Secretary Douglas Alexander. The Liberal Democrats lost ten of the eleven seats they were defending, with the then Chief Secretary to the Treasury Danny Alexander and former leader Charles Kennedy losing their seats. The election also saw the worst performance by the Scottish Conservative Party, which received its lowest share of the vote since its creation in 1965, although it retained the one seat that it previously held. In all, 50 of the 59 seats changed party, 49 of them being won by first-time MPs.

<span class="mw-page-title-main">2015 Guildford Borough Council election</span>

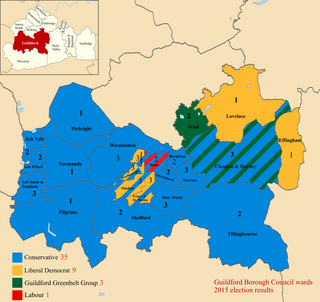
The 2015 Guildford Borough Council election took place on 7 May 2015 to elect members of Guildford Borough Council in England as one of the 2015 local elections, held simultaneously with the General Election.

<span class="mw-page-title-main">2015 Norwich City Council election</span> 2015 city council election for Norwich, England

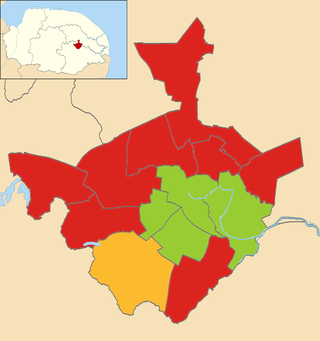
The 2015 Norwich City Council election took place on 7 May 2015 to elect approximately one third of the members of Norwich City Council in England. This was on the same day as other local elections and the UK general election. Thirteen seats were due to be contested, with a further two seats up for election where casual vacancies had arisen. Labour won ten of the available seats, the Green Party won four, and the Liberal Democrats one. The Conservatives gained their highest ever vote in many city wards including Town Close and Thorpe Hamlet, and across Norwich came within almost 2000 votes of the Green Party, however failed to gain any seats. Just one seat changed hands - Wensum - which Labour gained from the Greens. Labour retained overall control of the council with 22 seats out of 39, the Greens continue to form the main opposition with 14 seats, and the Liberal Democrats have 3.

<span class="mw-page-title-main">2016 Norwich City Council election</span> 2016 city council election for Norwich, England

The 2016 Norwich City Council election took place on 5 May 2016 to elect members of Norwich City Council in England. This was on the same day as other local elections. The Labour Party increased their majority at the expense of the Green Party, capturing 4 previously Green-held seats; the Greens retained only Thorpe Hamlet ward, by a margin of 31 votes.

<span class="mw-page-title-main">2018 Norwich City Council election</span> 2018 city council election for Norwich, England

The 2018 Norwich City Council election took on 3 May 2018 to elect members of Norwich City Council in England. This was on the same day as other local elections. 13 of 39 seats (one-third) were up for election.

<span class="mw-page-title-main">2018 Oxford City Council election</span>

The 2018 Oxford City Council election took place on 3 May 2018, to elect 24 of the 48 members of Oxford City Council in England. This was on the same day as other local elections in England. Each of Oxford's 24 wards elected one councillor, with the other seat in each ward next due for election in May 2020.

<span class="mw-page-title-main">2019 Winchester City Council election</span>

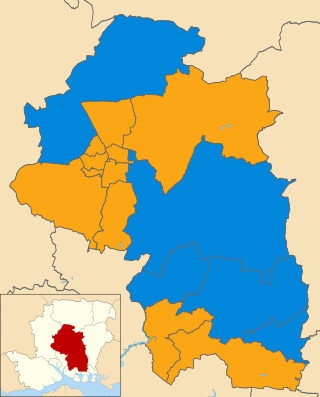
Elections to Winchester City Council took place on Thursday 2 May 2019, alongside other local elections across the country. The Conservatives Party held a narrow majority of one at the last election, with the seats contested in this election being last contested in 2016 election. The Conservatives defended 10 seats, whilst the Liberal Democrats defended 4. Town and parish councils in the city boundary were also up for election.

References

  1. 1 2 "Local Election Results 2011 - Norwich". Local Elections Archive Project. Retrieved 3 May 2016.