Related Research Articles

Broadland is a local government district in Norfolk, England, named after the Norfolk Broads. Its council is based at the Broadland Business Park on the outskirts of Norwich. The district includes the towns of Aylsham, Reepham, Sprowston and Thorpe St Andrew. Several of the district's settlements form part of the Norwich built-up area, lying outside the city's boundaries to the north-west and north-east. The district also includes numerous villages and surrounding rural areas. Some eastern parts of the district lie within The Broads.

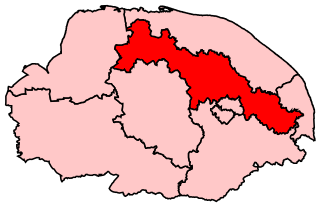
Mid Norfolk is a constituency represented in the House of Commons of the UK Parliament since 2010 by George Freeman, a Conservative.
Dacorum Borough Council in Hertfordshire, England is elected every four years. Since the last boundary changes in 2007, 51 councillors have been elected from 25 wards.
Maldon District Council in Essex, England is elected every four years.
Forest Heath District Council in Suffolk, England was elected every four years. between the last boundary changes in 2003 and the final elections in 2015, 27 councillors were elected from 14 wards. The council was abolished in 2019, with the area becoming part of West Suffolk.
Cotswold District Council in Gloucestershire, England, is elected every four years.
One third of Harrogate Borough Council in North Yorkshire, England was elected each year, followed by one year without election. Since the last boundary changes in 2002, 54 councillors had been elected from 35 wards. The last elections were held in 2018, ahead of the abolition of Harrogate Borough Council on 31 March 2023. Its functions transferred to the new North Yorkshire Council. The first elections to the North Yorkshire Council took place on 5 May 2022, when 21 councillors were elected from 21 divisions in the Borough of Harrogate.
Ashfield District Council elections are held every four years. Ashfield District Council is the local authority for the non-metropolitan district of Ashfield in Nottinghamshire, England. Since the last boundary changes in 2015, 35 councillors are elected from 23 wards.
Bassetlaw District Council elections are held every four years. Prior to 2015, elections were generally held three years out of every four, with a third of the council being elected each time. Bassetlaw District Council is the local authority for the non-metropolitan district of Bassetlaw in Nottinghamshire, England. Since the last boundary changes in 2002, 48 councillors have been elected from 25 wards.
One third of Cherwell District Council in Oxfordshire, England is elected each year, followed by one year without election. Since the last comprehensive boundary changes in 2016, 48 councillors have been elected from 16 wards.
Broadland is a Norfolk constituency, which has been represented in the House of Commons of the UK Parliament since the 2019 general election by Jerome Mayhew, a Conservative.
Harborough District Council elections are generally held every four years. Harborough District Council is the local authority for the non-metropolitan district of Harborough in Leicestershire, England. Since the last boundary changes in 2019, 34 councillors have been elected from 19 wards.
South Oxfordshire District Council, a non-metropolitan district council in Oxfordshire, England is elected every four years.
Windsor and Maidenhead Borough Council is the local authority for the Royal Borough of Windsor and Maidenhead, which is a unitary authority in Berkshire, England. Until 1 April 1998 it was a non-metropolitan district. Elections are held every four years. Since the last boundary changes in 2019 there have been 41 councillors elected from 19 wards.
East Lindsey District Council in Lincolnshire, England is elected every four years. The district is divided into 37 wards, electing 55 councillors. The last ward boundary changes came into effect in 2015.
North Kesteven District Council in Lincolnshire, England is elected every four years.
North Norfolk District Council in Norfolk, England is elected every four years.
Mid Devon District Council elections are held every four years to elect Mid Devon District Council in Devon, England. Since the last boundary changes in 2023 the council has comprised 42 councillors, representing 22 wards, with each ward electing one, two or three councillors.
Gravesham Borough Council elections are held every four years to elect Gravesham Borough Council in Kent, England. Since the last boundary changes in 2023, the council has comprised 39 councillors, representing 17 wards.

Teignbridge District Council in Devon, England is elected every four years. Since the last boundary changes in 2019, 47 councillors have been elected from 24 wards.
References
- ↑ "council and democracy". Broadland District Council. Retrieved 24 February 2010.
- ↑ The District of Broadland (Electoral Arrangements) Order 1977
- ↑ "Broadland Council election, 2003". Archived from the original on 13 August 2012. Retrieved 12 June 2011.
- ↑ Broadland Council election, 2004 Archived July 22, 2011, at the Wayback Machine
- ↑ "Broadland council". * BBC News Online . Retrieved 24 February 2010.
- ↑ legislation.gov.uk - The District of Broadland (Electoral Changes) Order 2003. Retrieved on 3 November 2015.
- ↑ Broadland Council election, 2007 Archived 2011-09-26 at the UK Government Web Archive
- ↑ Broadland Council election, 2011 Archived 2011-05-12 at the Wayback Machine
- ↑ "Declaration of result of poll" (PDF). Broadland District Council. Archived from the original (PDF) on 13 June 2011. Retrieved 24 February 2010.
- ↑ "new councillor elected". Broadland District Council. 6 March 2009. Retrieved 24 February 2010.
- ↑ "Lib Dem victories in Wroxham and Walsingham by-elections". North Norfolk News. 3 October 2009. Retrieved 24 February 2010.[ permanent dead link ]
- ↑ "Lib Dems win Taverham North by-election". Eastern Daily Press . 19 March 2010. Archived from the original on 23 August 2009. Retrieved 19 March 2010.
- ↑ "Local Elections Archive Project — Blofield with South Walsham Ward". www.andrewteale.me.uk. Retrieved 15 December 2023.
- ↑ "Local Elections Archive Project — Aylsham Ward". www.andrewteale.me.uk. Retrieved 15 December 2023.
- ↑ "Local Elections Archive Project — Wroxham Ward". www.andrewteale.me.uk. Retrieved 15 December 2023.
- ↑ "Local Elections Archive Project — Wroxham Ward". www.andrewteale.me.uk. Retrieved 15 December 2023.
- ↑ "Local Elections Archive Project — Aylsham Ward". www.andrewteale.me.uk. Retrieved 15 December 2023.
- ↑ "Local Elections Archive Project — Coltishall Ward". www.andrewteale.me.uk. Retrieved 15 December 2023.
- ↑ "Local Elections Archive Project — Aylsham Ward". www.andrewteale.me.uk. Retrieved 15 December 2023.
- ↑ "Local Elections Archive Project — Brundall Ward". www.andrewteale.me.uk. Retrieved 15 December 2023.
- ↑ "Local Elections Archive Project — Old Catton and Sprowston West Ward". www.andrewteale.me.uk. Retrieved 15 December 2023.
- ↑ "Local Elections Archive Project — Thorpe St Andrew North West Ward". www.andrewteale.me.uk. Retrieved 15 December 2023.
- ↑ "Local Elections Archive Project — Thorpe St Andrew North West Ward". www.andrewteale.me.uk. Retrieved 15 December 2023.
- By-election results Archived 2010-03-29 at the Wayback Machine