2021 Norfolk County Council election

Last updated

2021 Norfolk County Council election
Flag of Norfolk.svg
  2017
2025 

All 84 seats to Norfolk County Council
43 seats needed for a majority
 First partySecond partyThird party
  No image wide.svg No image wide.svg No image wide.svg
LeaderAndrew ProctorSteve Morphew Steffan Aquarone
Party Conservative Labour Liberal Democrats
Leader since1 June 20188 May 201720 April 2020
Leader's seatBlofield & BrundallCatton Grove Melton Constable
Last election55 seats, 48.8%17 seats, 23.2%11 seats, 17.4%
Seats before52169
Seats won58128
Seat changeIncrease2.svg 3Decrease2.svg 5Decrease2.svg 3
Popular vote114,94052,37335,292
Percentage48.8%21.8%15.0%
SwingSteady2.svgDecrease2.svg 1.4%Decrease2.svg 2.4%

 Fourth partyFifth party
  No image wide.svg No image wide.svg
Party Green Independent
Last election0 seats, 4.0%1 seats, 0.7%
Seats before05
Seats won33
Seat changeIncrease2.svg 3Increase2.svg 2
Popular vote24,2629,809
Percentage9.9%4.2%
SwingIncrease2.svg 5.9%Increase2.svg 3.5%

Norfolk County Council election 2021 map.svg
Map showing the results of the 2021 Norfolk County Council elections.

Council control before election

Conservative Party

Council control after election

Conservative Party

The 2021 Norfolk County Council election took place alongside the other 2021 local elections. 83 of the 84 seats to Norfolk County Council were elected. [1] One seat, Sewell in Norwich, had its election delayed to June 17 after Eve Collishaw, the Conservative candidate, died during the election campaign [2]

Contents

The Conservative Party retained control of the council and increased its majority, winning 58 seats with around the same vote share as in the 2017 election: the Liberal Democrats lost three seats in the north of the county, and Labour took losses to the Conservatives in the port towns of King's Lynn and Great Yarmouth as well as three losses to the Green Party who regained ground in southern and central Norwich. [3]

Summary

2017 election

PartySeats
Conservative 55
Labour 17
Liberal Democrats 11
Independent 1
Total84

Composition of council seats before election

PartySeats
Conservative 52
Labour 16
Liberal Democrats 9
Independent 5
Vacant2
Total84

Changes between elections

In between the 2017 election and the 2021 election, the following council seats changed hands:

DivisionDatePrevious PartyNew PartyCauseResulting Council Composition
Con Lab LDem Ind
Yarmouth North and Central17 November 2017 [4] Labour Independent Councillor quit party to sit as an independent member.5516112
Marshland North27 November 2017 [5] Conservative Independent Councillor quit party to sit as an independent member.5416113
Freebridge Lynn5 March 2020 [6] Conservative Vacant Sitting councillor resigned. [7] 5316113
Mundesley9 September 2020 [8] Liberal Democrats Independent Councillor quit party to sit as an independent member.5316104
North Walsham West and Erpingham20 November 2020 [9] Liberal Democrats Conservative Sitting Liberal Democrats Councillor defected to Conservatives.541694
Thetford East2 March 2021 [10] Conservative Vacant Sitting councillor resigned. [11] 531694
West Depwade15 March 2021 [12] Conservative Independent Councillor quit party to sit as an independent member.521695

Election result

2021 Norfolk County Council election
PartyCandidatesSeatsGainsLossesNet gain/lossSeats %Votes %Votes+/−
  Conservative 845841Increase2.svg 369.948.4114,940–0.4
  Labour 841205Decrease2.svg 513.322.152,413–1.1
  Liberal Democrats 69803Decrease2.svg 39.614.935,292–2.5
  Green 63330Increase2.svg 33.610.224,262+6.2
  Independent 19320Increase2.svg 23.64.19,809+3.4
  UKIP 4000Steady2.svg0.00.2386–5.8
  Reform UK 3000Steady2.svg0.00.1194N/A
  Monster Raving Loony 1000Steady2.svg0.0<0.145N/A

Results by division

Breckland

Breckland District Summary
PartySeats+/-Votes%+/-
Conservative 11Steady2.svg19,31561.6–1.6
Labour 1Steady2.svg7,20723.0+0.4
Liberal Democrat 0Steady2.svg2,5738.2+0.6
Green 0Steady2.svg2,0766.6+4.5
UKIP 0Steady2.svg1050.3–4.3
Independent 0Steady2.svg910.3N/A
Total12Steady2.svg31,367100.0

Division results

Attleborough [13]
PartyCandidateVotes%±%
Conservative Rhodri Oliver * 1,597 61.0 –2.5
Labour James Bremner55921.4–2.4
Liberal Democrats Ian Speller46217.6+4.9
Majority1,03839.6–0.0
Turnout 2,64126.4–2.0
Registered electors 10,013+631
Conservative hold Swing –0.0
Dereham North [14]
PartyCandidateVotes%±%
Conservative William Richmond * 1,409 63.3 –2.0
Labour Georgina Bunting61827.8+7.1
Liberal Democrats Brendan Bernard1998.9+3.8
Majority79135.5–9.1
Turnout 2,24227.3–2.1
Registered electors 8,212+301
Conservative hold Swing –4.6
Dereham South [15]
PartyCandidateVotes%±%
Conservative Phillip Duigan * 1,152 51.0 +4.2
Labour Harry Clarke95742.4+8.5
Liberal Democrats Jenny Pitchford1486.6–1.7
Majority1958.6–4.3
Turnout 2,31425.8–3.0
Registered electors 8,954+210
Conservative hold Swing –2.2
Elmham and Mattishall [16]
PartyCandidateVotes%±%
Conservative Bill Borrett * 2,037 64.2 –6.8
Green Philip Morton41012.9N/A
Labour Tara Harris39512.4–6.2
Liberal Democrats Mark Foley33210.5+0.1
Majority1,62751.3–1.1
Turnout 3,20233.9–0.8
Registered electors 9,453+465
Conservative hold Swing –9.9
Guiltcross [17]
PartyCandidateVotes%±%
Conservative Stephen Askew * 1,987 66.5 –2.5
Labour Michael Brindle60120.1+4.8
Liberal Democrats Beverley Bulmer40113.4–2.3
Majority1,38646.4–6.8
Turnout 3,00233.7+2.2
Registered electors 8,906+496
Conservative hold Swing –3.6
Necton and Launditch [18]
PartyCandidateVotes%±%
Conservative Mark Kiddle-Morris * 2,099 63.3 –11.4
Labour Joseph Sisto56917.2–8.1
Green Jane Keidan-Cooper45213.6N/A
Liberal Democrats Matthew Weatherill1955.9N/A
Majority1,53046.2–3.3
Turnout 3,34437.3–0.9
Registered electors 8,958+223
Conservative hold Swing –1.6
Swaffham [19]
PartyCandidateVotes%±%
Conservative Ed Colman * 1,766 68.6 +9.2
Labour John Zielinski42816.6+1.8
Green Peter Bate2339.1N/A
Liberal Democrats Paul Auber1475.7–2.4
Majority1,33852.0+10.4
Turnout 1,33852.0+7.3
Registered electors 8,740+706
Conservative hold Swing +3.7
The Brecks
PartyCandidateVotes%±%
Conservative Fabian Eagle* 2,172 71.3 –0.7
Labour Stuart Terry49513.6+1.6
Green Anne Rix2919.6+1.2
Liberal Democrats Evie-May Ellis1705.6–2.0
Majority167757.6–2.6
Conservative hold Swing
Thetford East
PartyCandidateVotes%±%
Conservative Jane James 967 51.7 +3.6
Labour Susan Dowling68436.6+1.1
Liberal Democrats Jamie Cash1146.1N/A
UKIP Denis Crawford1055.6–10.8
Majority28315.1+2.5
Conservative hold Swing
Thetford West
PartyCandidateVotes%±%
Labour Terry Jermy* 1,204 56.9 +5.4
Conservative Barbara Tullett72034.0+0.8
Liberal Democrats Martin Callam1014.8N/A
Independent Philip Wagstaff914.3N/A
Majority48422.9+4.6
Labour hold Swing
Watton
PartyCandidateVotes%±%
Conservative Claire Bowes* 1,685 66.2 –5.2
Green Timothy Birt38014.9+6.3
Labour Keith Prince32712.8–1.4
Liberal Democrats James Minto1546.1+0.3
Majority130551.3–5.9
Conservative hold Swing
Yare and All Saints
PartyCandidateVotes%±%
Conservative Edward Connolly 1,724 67.5 –5.2
Labour Paul Siegert37014.5+2.2
Green Ann Bowyer31012.1N/A
Liberal Democrats Ulrike Behrendt1505.9–9.0
Majority1,35453.0–4.8
Conservative hold Swing

Broadland

Broadland District Summary
PartySeats+/-Votes%+/-
Conservative 11Steady2.svg19,60052.6–2.8
Liberal Democrat 2Steady2.svg7,34719.7+0.2
Labour 0Steady2.svg6,72118.1–1.7
Green 0Steady2.svg3,4869.4+8.5
Independent 0Steady2.svg780.2N/A
Total13Steady2.svg37,232100.0

Division results

Acle
PartyCandidateVotes%±%
Conservative Lana Hempsall 1,321 54.7 +2.4
Labour Cathy Cordiner-Achenbach50621.0–8.5
Green Caroline Fernandez29512.2N/A
Liberal Democrats Emelye Harvey29312.1+2.4
Majority
Conservative hold Swing
Aylsham
PartyCandidateVotes%±%
Liberal Democrats Steve Riley 1,442 42.7 –1.0
Conservative Hal Turkmen1,42142.1+2.8
Green Andrew Boswell2346.9N/A
Labour Stephen Maseko2026.0–6.5
Independent Jonathan Rackham782.3N/A
Majority210.6–3.8
Liberal Democrats hold Swing
Blofield and Brundall
PartyCandidateVotes%±%
Conservative Andrew Proctor* 1,770 58.8 –3.9
Labour Glenn Springett55318.4+1.9
Green Jan Davis47515.8+10.0
Liberal Democrats Ian Wilson2127.0–2.8
Majority
Conservative hold Swing
Drayton and Horsford
PartyCandidateVotes%±%
Conservative Tony Adams* 1,311 48.3 –15.1
Liberal Democrats Dave Thomas1,10040.5+19.3
Labour Trevor Turk30611.3–4.1
Majority2117.3–34.9
Conservative hold Swing
Hellesdon
PartyCandidateVotes%±%
Conservative Shelagh Gurney* 1,734 59.3 –2.2
Labour Bibin Baby63521.7–3.2
Liberal Democrats David Britcher39613.6–0.1
Green Ken Parsons1575.4N/A
Majority
Conservative hold Swing
Hevingham and Spixworth
PartyCandidateVotes%±%
Liberal Democrats Dan Roper* 1,545 59.1 +11.9
Conservative Chris Corson87233.3–5.5
Labour Tony Hemmingway1997.6–0.4
Majority77325.8+17.5
Liberal Democrats hold Swing
Old Catton
PartyCandidateVotes%±%
Conservative Karen Vincent* 1,420 59.7 –5.4
Labour Jack Manzi58024.4+4.3
Green Ian Chapman2279.5N/A
Liberal Democrats Alan Whiteside1536.4–8.5
Majority
Conservative hold Swing
Reepham
PartyCandidateVotes%±%
Conservative Greg Peck* 1,388 49.3 +5.1
Liberal Democrats Sue Catchpole89331.7+3.6
Green Sarah Morgan31011.0N/A
Labour Tom Rednall2227.9–14.1
Majority
Conservative hold Swing
Sprowston
PartyCandidateVotes%±%
Conservative John Ward* 1,754 53.9 –0.1
Labour Natasha Harpley1,14835.3+5.3
Green Kahn Johnson2126.5N/A
Liberal Democrats Simon Lockett1394.3–4.1
Majority
Conservative hold Swing
Taverham
PartyCandidateVotes%±%
Conservative Stuart Clancy* 1,571 59.1 –7.7
Liberal Democrats Caroline Karimi-Ghovanlou57321.5+10.6
Labour Daryl Wickham35213.2–3.1
Green Claire Marcham1636.1N/A
Majority
Conservative hold Swing
Thorpe St Andrew
PartyCandidateVotes%±%
Conservative Ian Mackie* 1,721 53.7 –9.4
Green Eleanor Laming70522.0N/A
Labour Gurpreet Padda57918.1–4.7
Liberal Democrats Phyllida Scrivens1976.1–8.1
Majority
Conservative hold Swing
Woodside
PartyCandidateVotes%±%
Conservative John Fisher* 1,515 50.6 –4.7
Labour Martin Booth1,00033.4+3.7
Green Jim Green36312.1N/A
Liberal Democrats Victor Morgan1163.9–4.7
Majority51517.2-8.4
Conservative hold Swing
Wroxham
PartyCandidateVotes%±%
Conservative Fran Whymark 1,802 62.7 +3.7
Labour Julia Wheeler43915.3+4.6
Green Nicholas Ball34512.0+6.5
Liberal Democrats Richard Moore28810.0–9.9
Majority
Conservative hold Swing

Great Yarmouth

Great Yarmouth Borough Summary
PartySeats+/-Votes%+/-
Conservative 7Increase2.svg 112,42858.8+13.9
Labour 2Decrease2.svg 15,82127.5–1.2
Green 0Steady2.svg1,6277.7+5.7
Independent 0Steady2.svg5662.7N/A
Liberal Democrat 0Steady2.svg5002.4+0.7
UKIP 0Steady2.svg1210.6–22.1
Reform UK 0Steady2.svg740.4N/A
Total9Steady2.svg21,137100.0

Division results

Breydon
PartyCandidateVotes%±%
Conservative Carl Smith* 1,615 63.5 +15.8
Labour Trevor Wainwright67626.6–2.8
Green Hannah Morris1716.7N/A
Liberal Democrats Gareth Howe833.3N/A
Majority
Conservative hold Swing
Caister on Sea
PartyCandidateVotes%±%
Conservative Penny Carpenter* 1,642 66.9 +17.1
Labour Stuart Hellingsworth68527.9+8.1
Green Kenneth Petersen1265.1–2.0
Majority
Conservative hold Swing
East Flegg
PartyCandidateVotes%±%
Conservative James Bensly 1,975 72.3 +17.9
Labour Edd Bush38414.1–0.6
Green Hannah Gray32812.0+6.4
Liberal Democrats Nicholas Read431.6N/A
Majority
Conservative hold Swing
Gorleston St Andrews
PartyCandidateVotes%±%
Conservative Graham Plant* 1,369 56.9 +10.8
Labour Jo Thurtle73430.5–3.1
Green Tracey Darnell1817.5+3.3
Liberal Democrats Gordon Smith1245.1N/A
Majority
Conservative hold Swing
Lothingland
PartyCandidateVotes%±%
Conservative Carl Annison 1,687 62.6 +15.1
Labour Tony Wright51419.1–4.9
Independent Adrian Myers35313.1N/A
Green Trevor Rawson1395.2N/A
Majority
Conservative hold Swing
Magdalen
PartyCandidateVotes%±%
Labour Colleen Walker* 1,082 48.2 +0.2
Conservative Ivan Murray-Smith97843.6+10.2
Green Georgie Oatley1838.2N/A
Majority
Labour hold Swing
West Flegg
PartyCandidateVotes%±%
Conservative Andy Grant 1,432 68.2 +5.5
Green Emma Punchard29914.2N/A
Labour Claire Wardley28713.7–3.7
Liberal Democrats Rebecca Woods823.9–4.2
Majority
Conservative hold Swing
Yarmouth Nelson and Southtown
PartyCandidateVotes%±%
Labour Mike Smith-Clare* 760 44.6 +1.9
Conservative Daniel Candon68140.0+15.1
Green Rebecca Durant1096.4N/A
Liberal Democrats Mark Godfrey794.6+0.7
Reform UK Mick Riley744.3N/A
Majority
Labour hold Swing
Yarmouth North and Central
PartyCandidateVotes%±%
Conservative Graham Carpenter 1,049 46.4 +13.4
Labour Sandy Lysaght69930.9–3.5
Independent Ron Ellis2139.4N/A
UKIP Carrie Talbot1215.3–22.3
Green Anne Killett914.0N/A
Liberal Democrats Tony Harris893.9–1.2
Majority
Conservative gain from Labour Swing

King's Lynn and West Norfolk

King's Lynn and West Norfolk Borough Summary
PartySeats+/-Votes%+/-
Conservative 12Steady2.svg19,52756.5–1.9
Independent 2Increase2.svg 16,02617.4+13.8
Labour 0Decrease2.svg 15,39015.6–4.1
Liberal Democrat 0Steady2.svg1,9975.8–3.9
Green 0Steady2.svg1,4184.1+2.7
UKIP 0Steady2.svg1600.5–6.9
Reform UK 0Steady2.svg560.2N/A
Total14Steady2.svg34,574100.0

Division results

Clenchwarton & King's Lynn South
PartyCandidateVotes%±%
Independent Alexandra Kemp* 1,280 57.9 +5.3
Conservative Liam Hind74333.6+6.2
Labour Adam Giles1878.5–5.6
Majority
Independent hold Swing
Dersingham
PartyCandidateVotes%±%
Conservative Stuart Dark* 2,290 73.1 –0.4
Green Jordan Stokes45614.6N/A
Labour George Lankester2387.6–8.3
Liberal Democrats Erika Coward1494.8–5.8
Majority
Conservative hold Swing
Docking
PartyCandidateVotes%±%
Conservative Michael Chenery of Horsbrugh* 1,499 56.5 –12.1
Independent Chris Morley70626.6N/A
Labour Michelle Carter44816.9–1.5
Majority
Conservative hold Swing
Downham Market
PartyCandidateVotes%±%
Conservative Tony White* 1,395 51.9 –8.9
Liberal Democrats Josie Ratcliffe64123.8+10.5
Labour Eamonn McCusker37213.8–0.9
Independent Jackie Westrop28010.4N/A
Majority
Conservative hold Swing
Feltwell
PartyCandidateVotes%±%
Conservative Martin Storey* 1,983 65.2 –3.1
Independent Tom Ryves45615.0N/A
Labour Christopher Harvey41613.7–8.7
Independent Neil Aldridge1856.1N/A
Majority
Conservative hold Swing
Fincham
PartyCandidateVotes%±%
Conservative Brian Long* 1,510 59.6 +0.3
Independent Alan Holmes62924.8N/A
Labour Jo Smith39615.6–1.4
Majority
Conservative hold Swing
Freebridge Lynn
PartyCandidateVotes%±%
Conservative Nick Daubney 1,670 64.7 +7.5
Green Andrew de Whalley51019.7+1.7
Labour Francis Bone40315.6+2.4
Majority
Conservative hold Swing
Gayton and Nar Valley
PartyCandidateVotes%±%
Independent Jim Moriarty 1,370 48.5 N/A
Conservative Olivia Morris1,15640.9–20.9
Labour David Collis29810.6–7.4
Majority
Independent gain from Conservative Swing
Gaywood North and Central
PartyCandidateVotes%±%
Conservative Graham Middleton 1,031 56.1 +10.5
Labour Helen Dalgliesh61633.5+1.0
Liberal Democrats David Mills1317.1+0.8
UKIP Jim Perkins613.3–8.5
Majority
Conservative hold Swing
Gaywood South
PartyCandidateVotes%±%
Conservative Thomas Smith* 980 48.3 +9.6
Labour Micaela Bartrum72435.6+1.4
Liberal Democrats Rob Colwell22811.2–5.5
UKIP Michael Stone994.9–5.5
Majority
Conservative hold Swing
King`s Lynn North and Central
PartyCandidateVotes%±%
Conservative Lesley Bambridge52037.7+7.1
Labour Wilfred Lambert48234.9–11.7
Green Rob Archer25618.6N/A
Liberal Democrats Richard Coward664.8–5.2
Reform UK Gary Bramham564.1N/A
Majority
Conservative gain from Labour Swing
Marshland North
PartyCandidateVotes%±%
Conservative Julian Kirk 1,224 58.2 –13.1
Independent Sandra Squire*57427.3-44.0
Labour Matthew Hannay30514.5–3.1
Majority
Conservative hold Swing
Marshland South
PartyCandidateVotes%±%
Conservative Chris Dawson 1,679 62.8 +2.8
Independent Colin Rose54620.4–0.3
Labour David Hodgkinson2539.5–3.7
Green Alastair Kent1967.3N/A
Majority
Conservative hold Swing
North Coast
PartyCandidateVotes%±%
Conservative Andrew Jamieson* 1,847 64.1 –4.6
Liberal Democrats John Crofts78227.1+17.8
Labour John Simmons2528.7–5.7
Majority
Conservative hold Swing

North Norfolk

North Norfolk District Summary
PartySeats+/-Votes%+/-
Conservative 6Increase2.svg 214,63744.4+5.1
Liberal Democrat 4Decrease2.svg 311,75135.7–6.0
Independent 1Increase2.svg 11,8685.7+5.4
Labour 0Steady2.svg2,3747.2–2.7
Green 0Steady2.svg2,2756.9+3.8
MRLP 0Steady2.svg450.1N/A
Total11Steady2.svg32,950100.0
Cromer
PartyCandidateVotes%±%
Liberal Democrats Tim Adams* 1,745 54.4 +9.8
Conservative Richard Parker1,07133.4–6.0
Labour David Russell2076.5–1.2
Green Mike Bossingham1865.8+2.1
Majority
Liberal Democrats hold Swing
Fakenham
PartyCandidateVotes%±%
Conservative Tom Fitzpatrick* 1,376 53.5 +0.9
Independent John Rest56922.1N/A
Labour Ruth Goodall37114.4+0.4
Green Kris Marshall-Smith25610.0+6.8
Majority
Conservative hold Swing
Holt
PartyCandidateVotes%±%
Conservative Eric Vardy 1,650 47.6 +7.8
Liberal Democrats Sarah Butikofer*1,31137.8–7.8
Green Simon Russell2978.6+5.2
Labour Kay Montandon2126.1+0.4
Majority
Conservative gain from Liberal Democrats Swing
Hoveton and Stalham
PartyCandidateVotes%±%
Conservative Nigel Dixon* 1,613 65.0 +5.2
Liberal Democrats Pierre Butikofer35314.2–9.7
Labour Richard Stowe27411.0–0.7
Green Michael Filgate1576.3+1.7
Independent Paul Rice853.4N/A
Majority
Conservative hold Swing
Melton Constable
PartyCandidateVotes%±%
Liberal Democrats Steffan Aquarone* 1,490 46.6 +1.7
Conservative Jonathan Wilton1,29140.4+7.7
Green Rosie Woolgar2126.6+4.3
Labour Rebecca Shaw2026.3–1.9
Majority
Liberal Democrats hold Swing
Mundesley
PartyCandidateVotes%±%
Independent Edward Maxfield* 1,128 34.0 –8.5
Liberal Democrats Wendy Fredericks1,05231.7–10.8
Conservative Crispian Riley-Smith89126.8–13.6
Labour Jasper Haywood1404.2–3.6
Green Mark Taylor1093.3N/A
Majority
Independent gain from Liberal Democrats Swing
North Walsham East
PartyCandidateVotes%±%
Liberal Democrats Lucy Shires 1,303 43.9 –10.6
Conservative Pauline Porter1,25642.3+14.8
Labour Graham Jones2187.3–1.3
Green Elizabeth Dixon1916.4+2.9
Majority
Liberal Democrats hold Swing
North Walsham West and Erpingham
PartyCandidateVotes%±%
Liberal Democrats Saul Penfold 1,259 41.7 +7.2
Conservative Jon Payne1,20639.9+9.1
Green Chris Melhuish31510.4+6.6
Labour Claudia Owen2418.0–18.3
Majority
Liberal Democrats hold Swing
Sheringham
PartyCandidateVotes%±%
Conservative Judy Oliver* 1,590 51.1 +5.1
Liberal Democrats Liz Withington1,15737.2–1.3
Labour Ruth Bartlett1715.5–3.5
Green Simon Grewcock1504.8+2.9
Monster Raving Loony Tony Shannocks Poet Bolster451.4N/A
Majority
Conservative hold Swing
South Smallburgh
PartyCandidateVotes%±%
Conservative Richard Price* 1,381 46.6 +4.4
Liberal Democrats Adam Varley1,16539.3–1.0
Green Anne Filgate1986.7+1.6
Labour Finola Gaynor-Powell1334.5–1.1
Independent Nick Coppack862.9N/A
Majority
Conservative hold Swing
Wells
PartyCandidateVotes%±%
Conservative Michael Dalby 1,312 49.8 +23.0
Liberal Democrats Andrew Brown91634.7–26.2
Labour Xenia Horne2057.8+1.6
Green Stephen Green2047.7+5.2
Majority
Conservative gain from Liberal Democrats Swing

Norwich

Norwich City Summary
PartySeats+/-Votes%+/-
Labour 9Decrease2.svg 317,57644.9–0.8
Green 3Increase2.svg 39,43224.1+7.6
Liberal Democrat 1Steady2.svg2,9567.6–3.4
Conservative 0Steady2.svg8,88222.7+0.6
Independent 0Steady2.svg2920.7+0.2
Total13Steady2.svg39,138100.0

Division results

Bowthorpe
PartyCandidateVotes%±%
Labour Mike Sands* 1,419 54.3 +4.3
Conservative Roy Ashman75629.0–1.2
Independent Jonathan Watson29211.2N/A
Liberal Democrats Sean Bennett1445.5+0.2
Majority
Labour hold Swing
Catton Grove
PartyCandidateVotes%±%
Labour Steve Morphew* 1,321 49.9 +2.2
Conservative Richard Potter92234.8–3.4
Green Tony Park30011.3+4.5
Liberal Democrats Nigel Lubbock1054.0–0.6
Majority
Labour hold Swing
Crome
PartyCandidateVotes%±%
Labour Alison Birmingham 1,073 45.2 –4.7
Conservative Jonathan Emsell96740.8+8.6
Green Judith Ford24210.2+3.8
Liberal Democrats Victor Scrivens903.8–0.2
Majority
Labour hold Swing
Eaton
PartyCandidateVotes%±%
Liberal Democrats Brian Watkins* 1,640 39.3 –7.2
Labour Peter Prinsley1,17228.1+10.8
Conservative John Ward96723.2–4.9
Green Jane Saunders3959.5+3.3
Majority
Liberal Democrats hold Swing
Lakenham
PartyCandidateVotes%±%
Labour Brenda Jones* 1,453 55.9 +5.6
Conservative Helen Betts81831.5+12.7
Liberal Democrats Penelope Hubble32912.7+1.5
Majority
Labour hold Swing
Mancroft
PartyCandidateVotes%±%
Green Jamie Osborn 1,819 51.9 +27.7
Labour Danny Douglas*1,16533.2–13.3
Conservative Craig Harvey52114.9–3.0
Majority
Green gain from Labour Swing
Mile Cross
PartyCandidateVotes%±%
Labour Chrissie Rumsby* 1,084 49.8 +1.0
Conservative Stephen Bailey61128.1+5.9
Green Fiona Dowson37317.1+7.0
Liberal Democrats Susan Holland1074.9–1.5
Majority
Labour hold Swing
Nelson
PartyCandidateVotes%±%
Green Paul Neale 1,945 48.1 +10.7
Labour Caroline Sykes1,76543.7–3.6
Conservative Iain Gwynn3328.2+1.2
Majority
Green gain from Labour Swing

Due to the death of Evelyn Collishaw, the Conservative candidate, after the close of nominations, the election for Sewell division was delayed until 17 July.

Sewell
PartyCandidateVotes%±%
Labour Julie Brociek-Coulton* 1,132 45.3 –14.2
Green Adrian Holmes1,00540.2+29.0
Conservative Simon Jones32012.8–4.6
Liberal Democrats Helen Arundell401.6–5.8
Majority
Labour hold Swing
Thorpe Hamlet
PartyCandidateVotes%±%
Green Ben Price 1,654 42.6 +9.8
Labour Cavan Stewart1,42736.8+1.8
Conservative Jonathan Gillespie80120.6–2.1
Majority
Green gain from Labour Swing
Town Close
PartyCandidateVotes%±%
Labour Emma Corlett* 2,191 53.9 +2.0
Conservative Mary Chacksfield87621.6–1.7
Green Willem Buttinger72117.7+3.8
Liberal Democrats Neil Hardman2766.8–2.1
Majority
Labour hold Swing
University
PartyCandidateVotes%±%
Labour Matthew Reilly 980 51.7 –7.1
Green John Greenaway41922.1+9.2
Conservative Henry Lynn37719.9+3.4
Liberal Democrats Huw Sayer1186.2–0.1
Majority
Labour hold Swing
Wensum
PartyCandidateVotes%±%
Labour Maxine Webb 1,394 52.1 +2.7
Conservative David King61423.0+6.0
Green Teresa Belton55920.9–1.9
Liberal Democrats Gordon Dean1074.0–0.3
Majority
Labour hold Swing

South Norfolk

South Norfolk District Summary
PartySeats+/-Votes%+/-
Conservative 11Steady2.svg20,55150.2–7.6
Liberal Democrat 1Steady2.svg8,16819.9–4.7
Labour 0Steady2.svg7,32417.9+1.0
Green 0Steady2.svg3,9489.6+8.8
Independent 0Steady2.svg8882.2N/A
Reform UK 0Steady2.svg640.2N/A
Total12Steady2.svg40,943100.0

Division results

Clavering
PartyCandidateVotes%±%
Conservative Barry Stone 1,742 49.2 –3.0
Liberal Democrats Ian Stone94726.7–6.9
Green Eric Wareham48413.7N/A
Labour Alison Green36910.4–3.7
Majority
Conservative hold Swing
Costessey
PartyCandidateVotes%±%
Liberal Democrats Sharon Blundell 1,387 37.9 –7.0
Conservative John Irving1,26134.4+0.4
Labour Jamal Sealey73019.9+4.4
Green Owen Watkins2837.7+2.1
Majority
Liberal Democrats hold Swing
Diss and Roydon
PartyCandidateVotes%±%
Conservative Keith Kiddie* 1,512 53.6 –0.3
Liberal Democrats Trevor Wenman59421.1–7.7
Labour Pam Reekie45416.1+2.5
Green David Reynolds2599.2+5.5
Majority
Conservative hold Swing
East Depwade
PartyCandidateVotes%±%
Conservative Martin Wilby* 1,700 62.5 –4.6
Labour James Eddy46317.0+0.4
Green Andrew Newby33012.1N/A
Liberal Democrats Bernard Chauly2278.3–8.0
Majority
Conservative hold Swing
Forehoe
PartyCandidateVotes%±%
Conservative Daniel Elmer 1,622 45.6 –12.6
Liberal Democrats Vivienne Clifford-Jackson97927.5+4.4
Labour John Morland53114.9–3.8
Green Ian Boreham36310.2N/A
Reform UK Tom Matthews641.8N/A
Majority
Conservative hold Swing
Henstead
PartyCandidateVotes%±%
Conservative Vic Thomson* 1,744 46.9 –10.2
Liberal Democrats David Fairbairn1,04428.1+4.7
Labour Chris Smith52314.1–5.4
Green Julie Young40911.0N/A
Majority
Conservative hold Swing
Hingham
PartyCandidateVotes%±%
Conservative Margaret Dewsbury* 1,644 60.8 –6.6
Green Victoria Walters44016.3N/A
Labour Kendra Cogman35713.2–3.2
Liberal Democrats Gary Blundell2639.7–6.5
Majority
Conservative hold Swing
Humbleyard
PartyCandidateVotes%±%
Conservative David Bills* 2,087 52.5 –7.2
Labour Simon Chapman97124.4+7.9
Green Janet Bearman49412.4N/A
Liberal Democrats Julian Halls42610.7–13.1
Majority
Conservative hold Swing
Loddon
PartyCandidateVotes%±%
Conservative Kay Mason Billig 2,007 53.9 –9.3
Labour Jeremy Rowe1,37236.9+18.6
Liberal Democrats Gill Stone3429.2–9.3
Majority
Conservative hold Swing
Long Stratton
PartyCandidateVotes%±%
Conservative Alison Thomas* 1,763 62.7 –1.7
Labour David Vail51518.3+2.3
Green Shaun Button2759.8N/A
Liberal Democrats Jon Norton2609.2–10.3
Majority
Conservative hold Swing
West Depwade
PartyCandidateVotes%±%
Conservative Barry Duffin 1,632 43.6 –21.7
Independent Beverley Spratt*88823.7–41.6
Labour Alyson Read47812.8–2.8
Liberal Democrats Bob McClenning39410.5–8.6
Green Carol Sharp3499.3N/A
Majority
Conservative hold Swing
Wymondham
PartyCandidateVotes%±%
Conservative Robert Savage 1,837 46.3 –9.6
Liberal Democrats Suzanne Nuri-Nixon1,30532.9+9.7
Labour Christopher Bunting56114.1–6.8
Green Paul Sutcliff2626.6N/A
Majority
Conservative hold Swing

Changes 2021–2025

Gaywood South

Gaywood South: 29 July 2021
PartyCandidateVotes%±%
Liberal Democrats Rob Colwell 648 39.3 +28.1
Labour Micaela Bartrum56134.0–1.6
Conservative Phil Trask37822.9–25.4
Independent Robin Talbot352.1New
UKIP Michael Stone281.7–3.2
Majority875.3N/A
Turnout 1,65017.3
Liberal Democrats gain from Conservative Swing Increase2.svg14.9

Gaywood North and Central

Gaywood North and Central: 1 December 2022
PartyCandidateVotes%±%
Liberal Democrats David Sayers 364 35.6 +28.5
Labour Richard Johnson35634.8+1.3
Conservative Sheila Young25625.1–31.1
Green Vicky Fairweather464.5New
Majority80.8N/A
Turnout 1,02213.7
Registered electors 7,508
Liberal Democrats gain from Conservative Swing Increase2.svg13.6

Swaffham

Swaffham: 4 May 2023
PartyCandidateVotes%±%
Conservative John Nunn 1,288 50.9 –17.7
Labour Terry Land64925.6+9.0
Liberal Democrats Josephine Ratcliffe59623.5+17.8
Majority63925.3–26.7
Turnout 2,53328.7
Registered electors 9,062
Conservative hold Swing Decrease2.svg 13.3

West Depwade

West Depwade: 13 July 2023
PartyCandidateVotes%±%
Green Catherine Rowett 663 29.0 +19.7
Conservative Anthony Holden58225.4–18.2
Liberal Democrats Ian Spratt40917.9+7.4
Independent Beverley Spratt40517.7–6.0
Labour Pamela Reekie22810.0–2.8
Majority813.6N/A
Turnout 2,28724.8
Registered electors 9,256
Green gain from Conservative Swing Increase2.svg19.1

Freebridge Lynn

Freebridge Lynn: 3 August 2023
PartyCandidateVotes%±%
Liberal Democrats John Crofts 669 38.4 N/A
Conservative Olivia Morris53931.0–33.7
Green Michael De Whalley41824.0+4.3
Labour Lesley Marriage1156.6–9.0
Majority1307.4N/A
Turnout 1,74123.8
Liberal Democrats gain from Conservative Swing N/A

In November 2023 two Labour councillors, Emma Corlett and Maxine Webb, left the party to sit as independents. [20] [21]

Related Research Articles

<span class="mw-page-title-main">Breckland District</span> Non-metropolitan district in England

Breckland is a local government district in Norfolk, England. Its council is based in Dereham, although the largest town is Thetford. The district also includes the towns of Attleborough, Swaffham and Watton, along with numerous villages and surrounding rural areas.

<span class="mw-page-title-main">South West Norfolk (UK Parliament constituency)</span> Parliamentary constituency in the United Kingdom, 1885 onwards

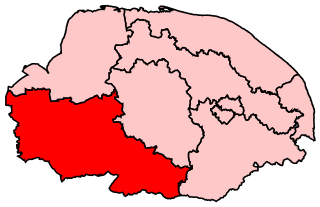
South West Norfolk is a constituency represented in the House of Commons of the UK Parliament since 2010 by Liz Truss of the Conservative Party, who served as Prime Minister of the United Kingdom from September to October 2022.

<span class="mw-page-title-main">Mid Norfolk (UK Parliament constituency)</span> Parliamentary constituency in the United Kingdom, 1885-1918 & 1983 onwards

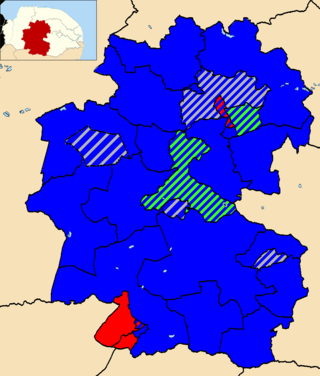
Mid Norfolk is a constituency represented in the House of Commons of the UK Parliament since 2010 by George Freeman, a Conservative.

Norfolk County Council in England is elected every four years. Since the last boundary changes in 2005, 84 councillors have been elected from 84 wards.

Essex County Council in England is elected every four years. Since the last boundary changes in 2005, 75 councillors are elected from 70 wards.

<span class="mw-page-title-main">2005 Suffolk County Council election</span> 2005 UK local government election

Elections to Suffolk County Council were held on 5 May 2005. The whole council was up for election with boundary changes since the last election in 2001 reducing the number of seats by 5. The Conservative Party gained control of the council from no overall control.

<span class="mw-page-title-main">2009 Suffolk County Council election</span> 2009 UK local government election

Elections to Suffolk County Council were held on 4 June 2009 as part of the 2009 United Kingdom local elections on the same day as the elections to the European Parliament. 75 councillors were elected from 63 electoral divisions, which returned either one or two county councillors each by first-past-the-post voting for a four-year term of office. The electoral divisions were the same as those used at the previous election in 2005.

<span class="mw-page-title-main">2009 Norfolk County Council election</span> 2009 UK local government election

The Norfolk County Council election took place on 4 June 2009, coinciding with local elections for all county councils in England.

<span class="mw-page-title-main">2013 Norfolk County Council election</span> 2013 UK local government election

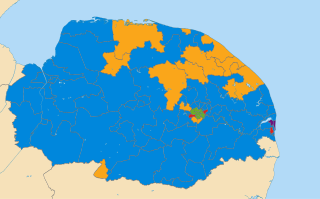
The Norfolk County Council election took place across Norfolk on 2 May 2013, coinciding with local elections for all county councils in England. The results were announced the following day, Friday 3 May 2013. The result brought to an end 12 years of Conservative administration, who finished three seats short of a majority after losing 20 seats, leaving the Council in no overall control (NOC). UKIP and the Labour Party both made gains of 14 and 11 seats respectively. The Liberal Democrats and the Green Party both lost three seats each, whilst an independent won a single seat in North Norfolk.

<span class="mw-page-title-main">2013 Cornwall Council election</span>

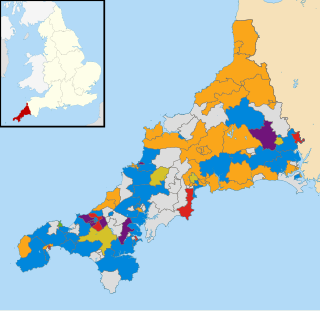
The Cornwall Council election, 2013, was an election for all 123 seats on the council. Cornwall Council is a unitary authority that covers the majority of the ceremonial county of Cornwall, with the exception of the Isles of Scilly which have an independent local authority. The elections took place concurrently with other local elections across England and Wales.

<span class="mw-page-title-main">2013 Suffolk County Council election</span> 2013 UK local government election

Elections to Suffolk County Council took place on 2 May 2013 as part of the 2013 United Kingdom local elections. 75 councillors were elected from 63 electoral divisions, which returned either one or two county councillors each by first-past-the-post voting for a four-year term of office. The electoral divisions were the same as those used at the previous election in 2009.

<span class="mw-page-title-main">2017 Norfolk County Council election</span> 2017 UK local government election

The 2017 Norfolk County Council election took place on 4 May 2017 as part of the 2017 local elections in the United Kingdom.

<span class="mw-page-title-main">2017 Suffolk County Council election</span> 2017 UK local government election

The 2017 Suffolk County Council election took place on 4 May 2017 as part of the 2017 local elections in the United Kingdom. All 75 councillors were elected from 63 electoral divisions, which returned either one or two county councillors each, by first-past-the-post voting, for a four-year term of office.

Robin James Hunter-Clarke is a British politician and solicitor. He is a district councillor, a former county councillor, and has stood as a candidate for election to Parliament, the Senedd and local councils. He was formerly Chief of Staff to Neil Hamilton and UKIP in the Senedd. He was an unsuccessful candidate in both the 2015 and 2017 general election and the 2021 Senedd election.

<span class="mw-page-title-main">2019 Breckland District Council election</span> 2019 UK local government election

The 2019 Breckland District Council election took place on 2 May 2019 to elect members of Breckland District Council in England. This was on the same day as other local elections. The boundaries for this election were the same as those used in 2015.

<span class="mw-page-title-main">2021 Cambridgeshire County Council election</span> 2021 UK local government election

The 2021 Cambridgeshire County Council election took place on 6 May 2021 as part of the 2021 local elections in the United Kingdom. All 61 councillors were elected from 59 electoral divisions, which returned either one or two county councillors each by first-past-the-post voting for a four-year term of office. The election was held alongside a full election for Cambridge City Council, the Cambridgeshire Police and Crime Commissioner, Mayor of Cambridgeshire and Peterborough and one-third of Peterborough City Council.

<span class="mw-page-title-main">2021 Suffolk County Council election</span> 2021 UK local government election

The 2021 Suffolk County Council election took place on 6 May 2021 as part of the 2021 local elections in the United Kingdom. All 75 councillors were elected from 63 electoral divisions, which return either one or two county councillors each, by first-past-the-post voting, for a four-year term of office.

<span class="mw-page-title-main">2021 Hampshire County Council election</span> 2021 UK local government election

Elections to Hampshire County Council took on 6 May 2021 as part of the 2021 United Kingdom local elections. All 78 seats were up for election, with each ward returning either one or two councillors by first-past-the-post voting for a four-year term of office. This took place at the same time as the elections for the Hampshire Police and Crime Commissioner and district councils.

The 2022 North Yorkshire Council election took place on 5 May 2022, alongside the other local elections. These were the last elections to North Yorkshire County Council, and the elected councillors would also serve as the first councillors on the North Yorkshire Council, which replaced the existing county council in April 2023.

<span class="mw-page-title-main">2023 Breckland District Council election</span>

The 2023 Breckland District Council election took place on 4 May 2023 to elect members of Breckland District Council in England. This was on the same day as other local elections. The boundaries for this election were the same as those used in 2015 and 2019.

References

  1. "Home - Norfolk County Council". www.norfolk.gov.uk. Retrieved 3 February 2021.
  2. . "Britain Elects Previews: The South and East". www.britainelects.com. Retrieved 9 May 2021.
  3. "Norfolk County Council election results 2021". www.norfolk.gov.uk. Retrieved 9 May 2021.
  4. George Ryan (17 November 2017). "Calls for by-election after former Labour county councillor becomes an independent". Eastern Daily Press. Retrieved 1 April 2021.
  5. "CMIS > Councillors". norfolkcc.cmis.uk.com.
  6. "CMIS > Councillors".
  7. No by-election was held.
  8. Jessica Frank-Keyes (9 September 2020). "'More concerned with Twitter than Trunch' - former Lib Dem leader quits party". Eastern Daily Press. Retrieved 1 April 2021.
  9. "CMIS > Councillors".
  10. "CMIS > Councillors".
  11. No by-election was held as the resignation was sufficiently close to the upcoming County election.
  12. "CMIS > Councillors".
  13. "Declaration of Result of Poll - Election of a County Councillor for Attleborough" (PDF). breckland.gov.uk. Norfolk County Council. 7 May 2021. Retrieved 23 May 2024.
  14. "Declaration of Result of Poll - Election of a County Councillor for Dereham North" (PDF). breckland.gov.uk. Norfolk County Council. 7 May 2021. Retrieved 23 May 2024.
  15. "Declaration of Result of Poll - Election of a County Councillor for Dereham South" (PDF). breckland.gov.uk. Norfolk County Council. 7 May 2021. Retrieved 23 May 2024.
  16. "Declaration of Result of Poll - Election of a County Councillor for Elmham and Mattishall" (PDF). breckland.gov.uk. Norfolk County Council. 7 May 2021. Retrieved 24 May 2024.
  17. "Declaration of Result of Poll - Election of a County Councillor for Guiltcross" (PDF). breckland.gov.uk. Norfolk County Council. 7 May 2021. Retrieved 24 May 2024.
  18. "Declaration of Result of Poll - Election of a County Councillor for Necton and Launditch" (PDF). breckland.gov.uk. Norfolk County Council. 7 May 2021. Retrieved 24 May 2024.
  19. "Declaration of Result of Poll - Election of a County Councillor for Swaffham" (PDF). breckland.gov.uk. Norfolk County Council. 7 May 2021. Retrieved 24 May 2024.
  20. Thompson, George (29 November 2023). "Labour loses control of Norwich City Council after four resign". BBC News. Retrieved 3 December 2023.
  21. Sinclair, Andrew (29 November 2023). "Sixth Norwich Labour councillor resigns in party row". BBC News. Retrieved 3 December 2023.