| ||||||||||||||||||||||||||||||||||||||||||||||||||||||||||||||||
78 seats on North Northamptonshire Council | ||||||||||||||||||||||||||||||||||||||||||||||||||||||||||||||||
---|---|---|---|---|---|---|---|---|---|---|---|---|---|---|---|---|---|---|---|---|---|---|---|---|---|---|---|---|---|---|---|---|---|---|---|---|---|---|---|---|---|---|---|---|---|---|---|---|---|---|---|---|---|---|---|---|---|---|---|---|---|---|---|---|
|
The 2021 North Northamptonshire Council election took place alongside nationwide local elections. The election was originally due to take place in May 2020, but was postponed due to the COVID-19 pandemic. [1]
It was the inaugural election for the unitary authority, which was created one month before in April 2021, after the merger of the four existing non-metropolitan districts of Corby, East Northamptonshire, Kettering, and Wellingborough. North Northamptonshire absorbed the functions of these districts, plus those of the abolished Northamptonshire County Council. All 26 wards elect 3 councillors each, resulting in 78 councillors being elected and 40 seats being required for a majority. [2]
Party | Candidate | Votes | % | |
---|---|---|---|---|
Conservative | David John Sims | 1,955 | 57.6 | |
Conservative | Kevin Gordon Sydney | 1,888 | 55.6 | |
Conservative | Macaulay Andrew Nichol | 1,857 | 54.7 | |
Labour | Ann Wallington | 1,506 | 44.3 | |
Labour | Ray Beeby | 1,376 | 40.5 | |
Labour | Guy Longfoot-Finch | 1,102 | 32.4 | |
Green | Stevie Jones | 484 | 14.3 | |
Liberal Democrats | Judith Ann Brown | 341 | 10.0 | |
Turnout | 3,396 | 40.2 | ||
Party | Candidate | Votes | % | |
---|---|---|---|---|
Labour | Jean Gloria Addison | 2,062 | 62.2 | |
Labour | Alison Dalziel | 2,044 | 61.7 | |
Labour | Matt Keane | 1,946 | 58.7 | |
Conservative | Rosalie Susan Beattie | 853 | 25.7 | |
Conservative | Glenvil Greenwood-Smith | 776 | 23.4 | |
Conservative | Peter Wathen | 754 | 22.8 | |
Green | Lynne Scannell | 225 | 6.8 | |
Liberal Democrats | Philip Charles Bromhall | 149 | 4.5 | |
Turnout | 3,313 | 36.1 | ||
Party | Candidate | Votes | % | |
---|---|---|---|---|
Labour | John Adam McGhee | 1,619 | 57.1 | |
Labour | Zoe Catherine McGhee | 1,477 | 52.1 | |
Labour | Peter Welsh McEwan | 1,447 | 51.0 | |
Conservative | Ray Boyd | 724 | 25.5 | |
Conservative | Raymond George Jackson | 711 | 25.1 | |
Conservative | Robert John Tustin | 642 | 22.6 | |
Green | Michael Mahon | 312 | 11.0 | |
Liberal Democrats | James Edward McGeown | 153 | 5.4 | |
Turnout | 2,835 | 27.3 | ||
Party | Candidate | Votes | % | |
---|---|---|---|---|
Labour | Mark Pengelly | 2,338 | 70.5 | |
Labour | Lyn Buckingham | 2,212 | 66.7 | |
Labour | William George Colquhoun | 1,852 | 55.8 | |
Conservative | Cameron Steven Andrew Clarke | 783 | 23.6 | |
Conservative | Jayden Watts | 691 | 20.8 | |
Conservative | Cesare Marinaro | 642 | 19.3 | |
Green | Lee Forster | 491 | 14.8 | |
Liberal Democrats | Terri Meechan | 162 | 4.9 | |
Turnout | 3,318 | 33.6 | ||
Party | Candidate | Votes | % | |
---|---|---|---|---|
Labour | Ross Armour | 1,491 | 41.7 | |
Labour | Simon Rielly | 1,482 | 41.4 | |
Labour | Leanne Norma Louise Buckingham | 1,334 | 37.3 | |
Conservative | Lorna Michele Rowan Garner | 1,177 | 32.9 | |
Conservative | Ollie Curtis | 1,176 | 32.9 | |
Conservative | Alexandra Katharine Wellings | 1,116 | 31.2 | |
Liberal Democrats | Chris Stanbra | 969 | 27.1 | |
Liberal Democrats | Penny Smith | 444 | 12.4 | |
Liberal Democrats | Aidan O'Donovan | 439 | 12.3 | |
Turnout | 3,576 | 35.5 | ||
Party | Candidate | Votes | % | |
---|---|---|---|---|
Conservative | Bert Jackson | 1,854 | 56.0 | |
Conservative | Jennie Bone | 1,683 | 50.8 | |
Conservative | Harriet Jane Frances Pentland | 1,681 | 50.8 | |
Independent | Richard Joseph Gell | 708 | 21.4 | |
Labour | Judy Dorothy Caine | 636 | 19.2 | |
Labour | David Leslie Baker | 613 | 18.5 | |
Independent | Peter Tomas | 587 | 17.7 | |
Green | Marnie Fedorowycz | 487 | 14.7 | |
Liberal Democrats | David Hooton | 405 | 12.2 | |
Reform UK | Sean Robert John Lever | 149 | 4.5 | |
Turnout | 3,311 | 29.9 | ||
Party | Candidate | Votes | % | |
---|---|---|---|---|
Conservative | Dorothy Maxwell | 1,817 | 50.4 | |
Conservative | Kirk William Oliver Harrison | 1,770 | 49.1 | |
Conservative | Roger Stuart Powell | 1,763 | 48.9 | |
Labour | Caroline Cross | 1,288 | 35.7 | |
Labour | Jon Gray | 1,137 | 31.5 | |
Labour | Caroline Smith | 788 | 21.8 | |
Green | Joel Wylie | 590 | 16.4 | |
Liberal Democrats | Susan Smith | 267 | 7.4 | |
Reform UK | Matt Davies | 151 | 4.2 | |
Turnout | 3,607 | 31.5 | ||
Party | Candidate | Votes | % | |
---|---|---|---|---|
Conservative | Annabel Lucy de Capell Brooke | 2,831 | 55.5 | |
Conservative | Helen Jane Harrison | 2,281 | 44.7 | |
Conservative | Jason Smithers | 2,133 | 41.8 | |
Liberal Democrats | Charlie Best | 1,606 | 31.5 | |
Liberal Democrats | Caroline Campbell Yeo | 1,212 | 23.8 | |
Labour | Harry Edward James | 936 | 18.4 | |
Green | Luke Jones | 867 | 17.0 | |
Independent | Peter David Peel | 283 | 5.6 | |
Independent | Phillip Maynard Stearn | 217 | 4.3 | |
Turnout | 5,099 | 40.5 | ||
Party | Candidate | Votes | % | |
---|---|---|---|---|
Conservative | Helen Victoria Mary Howell | 2,095 | 66.8 | |
Conservative | Richard John Kenneth Levell | 1,949 | 62.1 | |
Conservative | Lee Robert Charles Wilkes | 1,873 | 59.7 | |
Labour | Pauline Mary Ellis | 614 | 19.6 | |
Labour | Neil Harvey | 540 | 17.2 | |
Labour | Sheila Elizabeth Harvey | 519 | 16.5 | |
Green | Julia Thorley | 408 | 13.0 | |
Liberal Democrats | Garth Ratcliffe | 307 | 9.8 | |
Turnout | 3,136 | 29.0 | ||
Party | Candidate | Votes | % | |
---|---|---|---|---|
Conservative | Barbara Jenney | 1,981 | 63.5 | |
Conservative | Michael Tye | 1,943 | 62.2 | |
Conservative | Gill Mercer | 1,766 | 56.6 | |
Labour | Gail McDade | 687 | 22.0 | |
Labour | Gary Hugh Day | 666 | 21.3 | |
Liberal Democrats | Joe Norris | 581 | 18.6 | |
Green | Grace Siddington | 530 | 17.0 | |
Turnout | 3,122 | 28.2 | ||
Party | Candidate | Votes | % | |
---|---|---|---|---|
Conservative | David Jenney | 1,894 | 59.6 | |
Conservative | Steven John Brian North | 1,810 | 57.0 | |
Conservative | Andy Mercer | 1,680 | 52.9 | |
Labour | Les Rolfe | 849 | 26.7 | |
Labour | Daniel James Ash | 714 | 22.5 | |
Green | Keiron Farrow | 575 | 18.1 | |
Liberal Democrats | Liam Wilson | 514 | 16.2 | |
Turnout | 3,177 | 22.9 | ||
Party | Candidate | Votes | % | |
---|---|---|---|---|
Conservative | Wendy Jane Brackenbury | 2,746 | 55.6 | |
Conservative | David Hereward Gibson Brackenbury | 2,526 | 51.1 | |
Conservative | Geoff Shacklock | 2,117 | 42.8 | |
Independent | Val Carter | 1,712 | 34.6 | |
Labour | Paul George Kirkpatrick | 782 | 15.8 | |
Green | Hope Carpenter | 708 | 14.3 | |
Labour | Jerry Hawkins | 647 | 13.1 | |
Labour | Taffy Chikoto | 599 | 12.1 | |
Liberal Democrats | Jack Duckworth | 398 | 8.1 | |
Independent | John Allan Smoker | 370 | 7.5 | |
Liberal Democrats | Iris Amanda Lerse | 349 | 7.1 | |
Turnout | 4,943 | 37.9 | ||
Party | Candidate | Votes | % | |
---|---|---|---|---|
Conservative | Jan O'Hara | 1,543 | 49.2 | |
Conservative | John Richard Currall | 1,541 | 49.1 | |
Conservative | Chris Smith-Haynes | 1,120 | 35.7 | |
Green | Adrian Watts | 1,004 | 32.0 | |
Liberal Democrats | Chris Groome | 920 | 29.3 | |
Liberal Democrats | Jenny Davies | 786 | 25.0 | |
Independent | Fergus Macdonald | 598 | 19.1 | |
Labour | Mark Anthony Sales | 519 | 16.5 | |
Turnout | 3,139 | 27.5 | ||
Party | Candidate | Votes | % | |
---|---|---|---|---|
Green | Dez Dell | 2,184 | 59.8 | |
Green | Emily-Rose Fedorowycz | 1,780 | 48.7 | |
Green | Sarah Tubbs | 1,726 | 47.3 | |
Conservative | Lesley Anne Thurland | 1,087 | 29.8 | |
Conservative | Ash Davies | 1,002 | 27.4 | |
Conservative | Greg Titcombe | 887 | 24.3 | |
Independent | Bill Parker | 480 | 13.1 | |
Labour | Bryan Bremner Massie | 442 | 12.1 | |
Labour | Martyn Reuby | 355 | 9.7 | |
Independent | Derek Hilling | 120 | 3.3 | |
ADF | Suzanne Brogan | 100 | 2.7 | |
Turnout | 3,652 | 37.1 | ||
Party | Candidate | Votes | % | |
---|---|---|---|---|
Conservative | Mike Tebbutt | 2,011 | 50.9 | |
Conservative | Mark Robert Dearing | 1,981 | 50.1 | |
Conservative | David Alexander Howes | 1,791 | 45.3 | |
Labour | Phil Sawford | 1,393 | 35.2 | |
Labour | Andy Coleman | 956 | 24.2 | |
Labour | Yvonne Claire Scarrott | 791 | 20.0 | |
Independent | Linda Valerie Burnham | 707 | 17.9 | |
Liberal Democrats | Alan James Window | 493 | 12.5 | |
Green | Stevie Lawless | 455 | 11.5 | |
Turnout | 3,954 | 33.3 | ||
Party | Candidate | Votes | % | |
---|---|---|---|---|
Conservative | Lloyd Bunday | 1,871 | 55.2 | |
Conservative | Mark Edward Rowley | 1,817 | 53.6 | |
Conservative | Elliot Keith Prentice | 1,731 | 51.1 | |
Labour | John David Padwick | 1,048 | 30.9 | |
Labour | Jane Pettit | 816 | 24.1 | |
Labour | Tim Sharman | 652 | 19.2 | |
Green | David Lomasney | 647 | 19.1 | |
Liberal Democrats | Ryan James White | 338 | 10.0 | |
Turnout | 3,390 | 34.5 | ||
Party | Candidate | Votes | % | |
---|---|---|---|---|
Conservative | Kevin Nigel Thurland | 1,394 | 42.9 | |
Conservative | Anup Kumar Pandey | 1,392 | 42.9 | |
Conservative | Ian Frederick Jelley | 1,326 | 40.8 | |
Labour | Keli Ryan Watts | 1,309 | 40.3 | |
Labour | Andy Byatt | 1,249 | 38.5 | |
Labour | Clare Patricia Meechan Pavitt | 1,107 | 34.1 | |
Liberal Democrats | Stephen Michael Silver | 439 | 13.5 | |
Turnout | 3,247 | 26.6 | ||
Party | Candidate | Votes | % | |
---|---|---|---|---|
Independent | Jim Hakewill | 1,940 | 52.5 | |
Conservative | Cedwien Margaret Brown | 1,847 | 50.0 | |
Conservative | Joseph John Smyth | 1,489 | 40.3 | |
Conservative | Cliff Moreton | 1,424 | 38.6 | |
Green | Sarah Musselwhite | 827 | 22.4 | |
Labour | Isobel Victoria Stevenson | 726 | 19.7 | |
Labour | Robert Charles Newby | 620 | 16.8 | |
Turnout | 3,693 | 31.0 | ||
Party | Candidate | Votes | % | |
---|---|---|---|---|
Conservative | Scott Anthony Edwards | 1,695 | 47.3 | |
Conservative | Russell Roberts | 1,621 | 45.3 | |
Conservative | Larry Henson | 1,504 | 42.0 | |
Liberal Democrats | Andrew Rivers George Dutton | 970 | 27.1 | |
Labour | Adam Balmer | 819 | 22.9 | |
Labour | Geoff Marshall | 814 | 22.7 | |
Labour | Kat Ivanova | 799 | 22.3 | |
Liberal Democrats | Christopher George McGlynn | 760 | 21.2 | |
Liberal Democrats | Chris Nelson | 590 | 16.5 | |
Reform UK | Jehad Soliman Aburamadan | 198 | 5.5 | |
Turnout | 3,582 | 31.7 | ||
Party | Candidate | Votes | % | |
---|---|---|---|---|
Conservative | Robin John Carter | 1,184 | 48.0 | |
Labour | Anne Marie B Lee | 1,068 | 43.3 | |
Conservative | Paul Marks | 1,037 | 42.0 | |
Conservative | Craig Skinner | 1,014 | 41.1 | |
Labour | Clark James Mitchell | 915 | 37.1 | |
Labour | Arlette Cindy Wrighting | 915 | 37.1 | |
Independent | Glenn Binley | 186 | 7.5 | |
Liberal Democrats | Mel Gosliga | 185 | 7.5 | |
Turnout | 2,467 | 24.6 | ||
Party | Candidate | Votes | % | |
---|---|---|---|---|
Conservative | Paul Anthony Bell | 1,455 | 50.1 | |
Conservative | Matt Binley | 1,374 | 47.3 | |
Conservative | King Babatunda Oloruntoba Adeboye Lawal | 1,199 | 41.3 | |
Labour | Adam William Henley | 1,015 | 34.9 | |
Labour | Sylvia Rosetta Erskine | 956 | 32.9 | |
Labour | Andrea Jayne Watts | 868 | 29.9 | |
Liberal Democrats | Carolyn Frances Ramsbottom | 316 | 10.9 | |
Turnout | 2,906 | 31.0 | ||
Party | Candidate | Votes | % | |
---|---|---|---|---|
Conservative | Tim Allebone | 1,204 | 44.3 | |
Labour | Valerie Frances Anslow | 1,180 | 43.4 | |
Conservative | Philip Todd Irwin | 1,162 | 42.8 | |
Labour | Samuel Lewis Shoesmith | 1,012 | 37.3 | |
Conservative | Brian Kevin Skittrall | 998 | 36.7 | |
Labour | Andrew Michael Julian Scarborough | 988 | 36.4 | |
Liberal Democrats | Neale Robert William McMaster | 323 | 11.9 | |
Turnout | 2,716 | 27.5 | ||
Party | Candidate | Votes | % | |
---|---|---|---|---|
Conservative | Clive Frederick Hallam | 2,551 | 59.8 | |
Conservative | Scott Phillip Brown | 2,468 | 57.9 | |
Conservative | Lora Lawman | 2,440 | 57.2 | |
Green | Olivia Mitchell | 1,160 | 27.2 | |
Labour | Ian Peter Stroud | 1,028 | 24.1 | |
Liberal Democrats | Paula Jane Addison-Pettit | 976 | 22.9 | |
Turnout | 4,266 | 41.8 | ||
Party | Candidate | Votes | % | |
---|---|---|---|---|
Conservative | Jonathan Ekins | 1,491 | 44.5 | |
Conservative | Malcolm John Seeney Ward | 1,457 | 43.5 | |
Conservative | Andrew James Weatherill | 1,424 | 42.5 | |
Labour | Tony Aslam | 1,314 | 39.3 | |
Labour | Elayne Francis | 1,096 | 32.7 | |
Labour | Anthony David Dady | 1,017 | 30.4 | |
Green | Sarah Pearson | 508 | 15.2 | |
Liberal Democrats | John George Ramsbottom | 345 | 10.3 | |
Turnout | 3,347 | 31.4 | ||
Party | Candidate | Votes | % | |
---|---|---|---|---|
Conservative | Ken Harrington | 2,137 | 59.5 | |
Conservative | Graham Michael Lawman | 2,062 | 57.4 | |
Conservative | Malcolm Waters | 1,778 | 49.5 | |
Labour | Clare Margaret Anne Thomson | 1,029 | 28.6 | |
Labour | William Inskip | 976 | 27.2 | |
Labour | Stuart George Scott | 793 | 22.1 | |
Liberal Democrats | Stuart James Simons | 332 | 9.2 | |
Turnout | 3,592 | 35.6 | ||
Party | Candidate | Votes | % | |
---|---|---|---|---|
Conservative | Jon-Paul Carr | 2,108 | 58.1 | |
Conservative | Tom Partridge-Underwood | 2,105 | 58.1 | |
Conservative | Martin James Griffiths | 1,837 | 50.7 | |
Labour | Tim Maguire | 1,037 | 28.6 | |
Labour | Michele Anne Milroy | 587 | 16.2 | |
Independent | Jo Beirne | 577 | 15.9 | |
Labour | John Edward Farrar | 552 | 15.2 | |
Green | Will Morris | 393 | 10.8 | |
Liberal Democrats | David Michael Brown | 280 | 7.7 | |
Turnout | 3,626 | 44.3 | ||
A by-election was held to fill the seat vacated by Cllr Annabel de Capell Brooke. [5]
Party | Candidate | Votes | % | ±% | |
---|---|---|---|---|---|
Liberal Democrats | Charlie Best | 1,683 | 47.2 | +22.6 | |
Conservative | Ollie Curtis | 1,423 | 39.9 | -3.5 | |
Labour | Harry James | 337 | 9.4 | -4.9 | |
Green | Kate Jones | 124 | 3.5 | -9.8 | |
Majority | 260 | 7.3 | N/A | ||
Turnout | 3,577 | 35.5 | -5.0 | ||
Liberal Democrats gain from Conservative | Swing | 13.1 | |||
A by-election was held on 2 February 2023 due to the death of Cllr Kevin Thurland.
Party | Candidate | Votes | % | ±% | |
---|---|---|---|---|---|
Labour | Keli Watts | 1,027 | 38.0 | -3.7 | |
Conservative | Lesley Thurland | 805 | 29.8 | -14.6 | |
Green | Ria Skelton | 658 | 24.4 | +24.4 | |
Liberal Democrats | Stephen Silver | 127 | 4.7 | -9.2 | |
Reform UK | Jehad Aburamadan | 85 | 3.1 | +3.1 | |
Majority | 222 | 8.4 | N/A | ||
Turnout | 2,702 | ||||
Labour gain from Conservative | Swing | 10.9 | |||
Party | Candidate | Votes | % | ±% | |
---|---|---|---|---|---|
Conservative | Anne Melanie Coleman | 1,210 | 54.6 | +5.2 | |
Labour | Chris Ashton | 638 | 28.8 | +6.6 | |
Liberal Democrats | Blythe Cassandra Avery | 157 | 7.1 | -6.3 | |
Breakthrough Party | Dave Merlane | 120 | 5.4 | +5.4 | |
Green | Will Morris | 93 | 4.2 | -10.8 | |
Majority | 572 | 25.8 | |||
Turnout | 19.3 | ||||
Conservative hold | Swing | -1.4 | |||
}}
Party | Candidate | Votes | % | ±% | |
---|---|---|---|---|---|
Conservative | Bill McElhinney | 1,485 | 47.3% | ||
Labour | Richard Tod | 1,055 | 33.6% | ||
Green | Olivia Stevenson | 368 | 11.7% | -0.8% | |
Liberal Democrats | Alan Windows | 234 | 7.5% | -5.0% | |
Turnout | 3,142 | ||||
Conservative hold | Swing | ||||
Lancaster City Council elections are held every four years. Lancaster City Council is the local authority for the non-metropolitan district of Lancaster in Lancashire, England. Since the last boundary changes in 2023, 61 councillors have been elected from 27 wards.
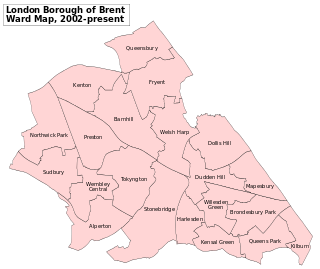
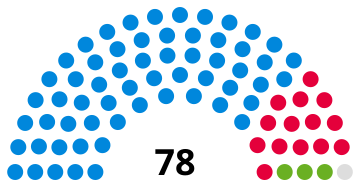
Brent London Borough Council in London, England is elected every four years. Since the last boundary changes in 2022 the council has comprised 57 councillors representing 22 wards, with each ward electing two or three councillors.
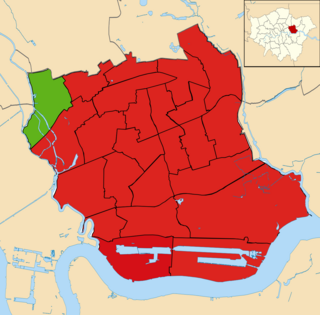
(Kingston upon) Hull City Council is the governing body for the unitary authority and city of Kingston upon Hull. It was created in 1972 as the successor to the Corporation of Hull, which was also known as the Hull Corporation and founded in 1440 by royal charter.
The 2017 West Lothian Council election took place on 4 May 2017 to elect members of West Lothian Council. The election used the 9 wards created as a result of the Local Governance (Scotland) Act 2004, with each ward electing three or four Councillors using the single transferable vote system form of proportional representation, with 33 Councillors being elected. The election resulted in no overall party majority, leading to the Labour Party and the Conservative Party forming a coalition administration.
The 2017 Highland Council election was held on 4 May 2017 to elect members of the Highland Council. The election used the 21 wards created under the Local Governance (Scotland) Act 2004; each ward elected three or four councillors using the single transferable vote system. A total of 74 councillors were elected, six less than in 2012.
The 2021 United Kingdom local elections were held on Thursday 6 May 2021. More than 145 English local councils, around 5,000 councillor seats, thirteen directly elected mayors in England, and 39 police and crime commissioners in England and Wales were contested. On the same day, the 2021 Hartlepool by-election took place, and there were also elections to the Scottish Parliament, Senedd and London Assembly, the last in conjunction with the London mayoral election.
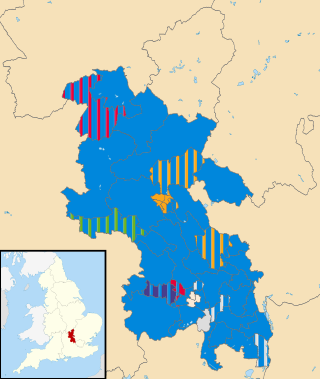
The 2021 Buckinghamshire Council election took place on 6 May 2021, alongside nationwide local elections. The election was originally due to take place in May 2020, but was postponed due to the COVID-19 pandemic.
The 2019 Horsham District Council election took place on 2 May 2019 to elect members of Horsham District Council in England. It was held on the same day as other local elections. Every seat was contested and the Conservatives retained control of the council with a majority of 8.
Elections to Hampshire County Council took on 6 May 2021 as part of the 2021 United Kingdom local elections. All 78 seats were up for election, with each ward returning either one or two councillors by first-past-the-post voting for a four-year term of office. This took place at the same time as the elections for the Hampshire Police and Crime Commissioner and district councils.
The 2021 West Northamptonshire Council election took place during 2021, alongside nationwide local elections. The election was originally due to take place in May 2020, but was postponed due to the COVID-19 pandemic.
The 2021 Sunderland City Council election took place on 6 May 2021 to elect members of Sunderland City Council in England on the same day as other elections across the United Kingdom.
The 2022 Hackney London Borough Council election took place on 5 May 2022. All 57 members of Hackney London Borough Council were up for election. The elections took place alongside the election for the mayor of Hackney, local elections in the other London boroughs, and elections to local authorities across the United Kingdom.
The 2022 Hounslow London Borough Council election took place on 5 May 2022. All 62 members of Hounslow London Borough Council were elected. The elections took place alongside local elections in the other London boroughs and elections to local authorities across the United Kingdom.
The 2022 Newham London Borough Council election took place on 5 May 2022. All 66 members of Newham London Borough Council were elected. The election took place alongside local elections in the other London boroughs and elections to local authorities across the United Kingdom.
Elections to The Highland Council were held on 5 May 2022, the same day as the 31 other Scottish local government elections. As with other Scottish council elections, it was held using single transferable vote (STV) – a form of proportional representation – in which multiple candidates are elected in each ward and voters rank candidates in order of preference.
Elections to Comhairle nan Eilean Siar took place on 5 May 2022 on the same day as the 31 other Scottish local government elections. The election was the first to use the nine wards created under the Islands (Scotland) Act 2018 which allowed for single and dual member wards, with 29 councillors being elected. Each ward elected either 2, 3 or 4 members, using the Single Transferrable Vote electoral system, a form of proportional representation. Following a boundary review the number of wards will increase from nine to 11 while the number of councillors elected will fall from 31 to 29.
Elections to South Lanarkshire Council took place on 5 May 2022 on the same day as the 31 other Scottish local government elections. As with other Scottish council elections, it was held using single transferable vote (STV) – a form of proportional representation – in which multiple candidates are elected in each ward and voters rank candidates in order of preference.
Elections to North Ayrshire Council took place on 5 May 2022 on the same day as the 31 other Scottish local government elections. As with other Scottish council elections, it was held using single transferable vote (STV) – a form of proportional representation – in which multiple candidates are elected in each ward and voters rank candidates in order of preference.
Elections to Argyll and Bute Council took place on 5 May 2022, the same day as the 31 other Scottish local government elections. As with other Scottish council elections, it was held using single transferable vote (STV)—a form of proportional representation—in which multiple candidates are elected in each ward and voters rank candidates in order of preference. New ward boundaries were proposed by Boundaries Scotland in 2021, which would have reduced the total number of councillors to 34. However, these were rejected by the Scottish Parliament and the boundaries used at the previous election remained in place.
Elections to Aberdeenshire Council took place on Thursday 5 May 2022 on the same day as the 31 other Scottish local government elections. As with other Scottish council elections, it was held using single transferable vote (STV) – a form of proportional representation – in which multiple candidates are elected in each ward and voters rank candidates in order of preference.