2021 Shropshire Council election

Last updated

2021 Shropshire Council election
Flag of Shropshire.svg
  2017 6 May 2021 2025  

All 74 seats to Shropshire Council
38 seats needed for a majority
 First partySecond partyThird party
 
Party Conservative Liberal Democrats Labour
Seats won43149
Seat changeDecrease2.svg5Increase2.svg2Increase2.svg1

 Fourth party
 
Party Green
Seats won4
Seat changeIncrease2.svg3

Shropshire UK local election 2021 map.svg
Map showing the results of the 2021 elections. Striped divisions have mixed representation.

Council control before election

Conservative

Council control after election

Conservative

The 2021 Shropshire Council election took place on 6 May 2021 as part of the 2021 United Kingdom local elections. All 74 councillors were elected from 63 electoral divisions which return either one, two or three councillors each by first-past-the-post voting for a four-year term of office.

Contents

Summary

Election result

2021 Shropshire Council election
PartyCandidatesSeatsGainsLossesNet gain/lossSeats %Votes %Votes+/−
  Conservative 744339Decrease2.svg658.144.851,442–4.0
  Liberal Democrats 581431Increase2.svg218.921.925,123+1.8
  Labour 41921Increase2.svg112.218.020,691+1.7
  Green 41430Increase2.svg35.49.510,869+2.0
  Independent 14421Increase2.svg15.45.66,470+1.1
  UKIP 2000Steady2.svg0.00.2218–0.8
  Reform UK 2000Steady2.svg0.00.197New
  Health Concern 0001Decrease2.svg10.00.00–1.3

Though the Conservatives maintained their majority on the council, there was a major shock result that saw the incumbent Conservative leader of the council, Peter Nutting, lose his seat to a Liberal Democrat challenger. [1] He was replaced as leader of the council by Conservative Lezley Picton at the AGM held later that month. [2]

Council composition

Following the last election in 2017, the composition of the council was: [3]

49128311
ConservativeLib DemLabourIGH

After the election, the composition of the council was:

4314944
ConservativeLib DemLabourIG

I - Independent
G - Green Party
H - Health Concern

Ward results

Abbey

Abbey (1 seat) [4]
PartyCandidateVotes%±%
Liberal Democrats Mary Gwendoline Davies 636 38.9 -16.7
Conservative Ian Stuart Burgess48229.4+5.2
Labour Martyn Gordon Harris38623.6+7.9
Green Helen Louise Campbell1338.1New
Majority1549.4-21.9
Turnout 1,637
Liberal Democrats hold Swing -11.0

Albrighton

Albrighton (1 uncontested seat)
PartyCandidateVotes%±%
Conservative Nigel Peter Lumby Uncontested
Conservative hold

Alveley and Claverley

Alveley and Claverley (1 seat)
PartyCandidateVotes%±%
Conservative Elliott Liam Lynch 859 69.3 -5.9
Liberal Democrats Vanessa Naomi Voysey27522.2-2.5
Green Kim Laurette Fitzwarine-Smith1058.5New
Majority58447.1-3.4
Turnout 1,239
Conservative hold Swing -1.7

Bagley

Bagley (1 seat)
PartyCandidateVotes%±%
Conservative Garry David Burchett 419 28.8 -11.1
Liberal Democrats Benedict John Alexander Jephcott40127.6-2.5
Labour Paul David Hollington37225.6-4.4
Independent Peter David Day26218.0New
Majority181.2-8.7
Turnout 1,454
Conservative hold Swing -4.3

Battlefield

Battlefield (1 seat)
PartyCandidateVotes%±%
Conservative Dean Spencer Joseph* 574 60.4 +3.0
Labour Co-op Frankie Rickford29931.4-2.9
Liberal Democrats Helen Louise Tedcastle788.2New
Majority27528.9+5.9
Turnout 951
Conservative hold Swing +3.0

Bayston Hill, Column & Sutton

Bayston Hill, Column & Sutton (3 seats)
PartyCandidateVotes%±%
Labour John Edward Clarke* 2,160 50.6 -5.0
Labour Rosemary Lucy Winifred Dartnall 1,724 40.4 -0.9
Labour Anthony Donald Parsons* 1,712 40.1 -3.6
Conservative Janet Ann Childs1,43933.7+2.2
Conservative James Oliver Louis Katz1,26929.8+0.8
Conservative Simon Alastair Orr1,24629.2+2.5
Green Emma Catherine Mary Bullard61314.4+6.7
Liberal Democrats William Coles4159.7-1.7
Green April Elizabeth Evans4099.6+3.0
Green Diane Louise Monether3297.7N/A
Liberal Democrats Ivana Novotna1874.4N/A
Liberal Democrats Robert Charles Lea1643.8N/A
Turnout 4,285
Labour hold Swing -3.6
Labour hold Swing -0.9
Labour hold Swing -3.1

Belle Vue

Belle Vue (1 seat)
PartyCandidateVotes%±%
Labour Mary Kate Halliday 995 65.1 +22.1
Conservative Saiful Chowdary30720.1-8.2
Green Sara Mai1489.7+5.2
Liberal Democrats Byron Grainger-Jones795.2-23.1
Majority68845.0+30.3
Turnout 1,529
Labour hold Swing +15.2

Bishop’s Castle

Bishop’s Castle (1 seat)
PartyCandidateVotes%±%
Liberal Democrats Ruth Margaret Houghton 1,087 78.2 +4.6
Conservative David Richmond Turner19814.2-6.7
Green Linda Mary Senior1057.55New
Majority88964.0+11.3
Turnout 1,390
Liberal Democrats hold Swing +5.7

Bowbrook

Bowbrook (1 seat)
PartyCandidateVotes%±%
Liberal Democrats Alex Wagner 1,001 62.2 +46.1
Conservative Arlinda Ballcaj32220.0-48.7
Labour Shay Corrigan23814.8New
Reform UK Joe Elliot George Dyas483.0New
Majority67942.2N/A
Turnout 1,609
Liberal Democrats gain from Conservative Swing +47.4

Bridgnorth East & Astley Abbotts

Bridgnorth East & Astley Abbotts (2 seats)
PartyCandidateVotes%±%
Conservative Kirstie Hurst-Knight 892 45.4 -2.5
Conservative Christian James Lea 847 43.2 -12.5
Labour Arlie Chetter60831.0+2.6
Labour Alexa Louise Buffey41521.1N/A
No LabelStephen Anthony Robbins29515.0N/A
Liberal Democrats Nicola Jayne Cooper23812.1-10.6
Liberal Democrats George Harry William Edwards1537.8-13.8
Green Simon Charles Greaves1296.6N/A
Turnout 1,969
Conservative hold Swing -2.6
Conservative hold Swing -16.8

Bridgnorth West and Tasley

Bridgnorth West and Tasley (2 seats)
PartyCandidateVotes%±%
Labour Julia Buckley 1,321 55.0 +38.3
Conservative Leslie John Paul Winwood* 920 38.3 -20.5
Conservative Jonathan James Holland71129.6-17.1
Labour Rachel Elizabeth Connolly66927.9N/A
Liberal Democrats David Norman Cooper33614.0-13.4
Liberal Democrats Richard Douglas Stilwell28211.8-12.8
Green Susan Anne Mary Cunning702.9N/A
Green Robert Austin Cunning602.5N/A
Turnout 2,412
Labour gain from Conservative Swing +27.7
Conservative hold Swing -24.2

Broseley

Broseley (1 seat)
PartyCandidateVotes%±%
Labour Caroline Emma Bagnall 882 55.5 +16.1
Conservative Simon Christopher Harris*62339.2-21.4
Green Clare Nash835.2New
Majority25916.3N/A
Turnout 1,588
Labour gain from Conservative Swing +18.8

Brown Clee

Brown Clee (1 seat)
PartyCandidateVotes%±%
Conservative Robert Stuart Tindall* 742 57.39 -22.38
Independent Linda Jean Jackson29923.12
Liberal Democrats Richard Antony Fox14811.45-8.78
Green Lucy Christina Aphamor1048.04
Majority44334.27-25.27
Turnout 1,293
Conservative hold Swing

Burnell

Burnell (1 seat)
PartyCandidateVotes%±%
Conservative Dan Morris* 1,110 66.03 +16.93
Liberal Democrats Kate King39123.26-23.93
Labour Phil Norton18010.71
Majority71342.77+40.86
Turnout 1,681
Conservative hold Swing

Castlefields and Ditherington

Castlefields and Ditherington (1 seat)
PartyCandidateVotes%±%
Labour Alan Neil Mosley* 717 65.90 +8.30
Conservative David Huw Llwelyn Roberts19017.46+1.88
Green Peter John Gilbert978.92+3.90
Reform UK Peter Charles Moore494.50
Liberal Democrats Matthew David Hamilton Clark353.22
Majority52748.44-10.18
Turnout 1.088
Labour hold Swing

Cheswardine

Cheswardine (1 Seat)
PartyCandidateVotes%±%
Conservative Rob Gittins* 725 69.51 -6.50
Independent Tim Beckett31830.49
Majority40739.02-13.00
Turnout 1,043
Conservative hold Swing

Chirbury & Worthen

Chirbury & Worthen (1 seat)
PartyCandidateVotes%±%
Liberal Democrats Heather Mary Kidd* 1,069 83.84 +6.09
Conservative Anthony Gerard Bevington20616.16-6.09
Majority86367.68+12.18
Turnout 1,275
Liberal Democrats hold Swing

Church Stretton & Craven Arms

Church Stretton & Craven Arms (2 seats)
PartyCandidateVotes%±%
Conservative David William Evans* 1,363 44.82 -6.33
Conservative Hilary Mary Luff 1,175 38.64 -13.94
Liberal Democrats Mark Edward Ernest Morris98332.32+5.18
Liberal Democrats Alan Graham Jolley90929.89+6.21
Green Stephen Charles Hale54117.79+4.34
Green Hilary Raborg Houchin Wendt48215.85+2.93
Turnout 3,057
Conservative hold Swing

Clee

Clee (1 seat)
PartyCandidateVotes%±%
Liberal Democrats Richard Mark Huffer* 756 50.27 -10.72
Conservative Anita Jayne Rose64943.15+4.14
Green David Stuart Clifford Thomlinson996.58
Majority1077.12-14.86
Turnout 1,504
Liberal Democrats hold Swing

Cleobury Mortimer

Cleobury Mortimer (2 seats)
PartyCandidateVotes%±%
Conservative Gwilym Howard Leslie Butler* 1,374 64.48 -0.50
Conservative Simon Richard Harris 1,007 47.25 N/A
Liberal Democrats Zoe Griffin43620.46+8.18
Labour John Mayers Rogers32715.34+0.17
Green Janet Catherine Humphreys26012.20N/A
Green John Charles Jeremy Crowe2099.81N/A
Liberal Democrats Andrew John Sherrington1416.62-2.58
Turnout 2,146
Conservative hold Swing
Conservative gain from Health Concern Swing

Clun

Clun (1 seat)
PartyCandidateVotes%±%
Liberal Democrats Nigel John Hartin* 985 55.09 -0.77
Conservative Jack Limond80344.91+0.77
Majority18210.18-1.54
Turnout 1,788
Liberal Democrats hold Swing

Copthorne

Copthorne (1 seat)
PartyCandidateVotes%±%
Liberal Democrats Rob Wilson 995 58.95 +35.58
Conservative Peter Anthony Nutting*47628.20-31.65
Labour Ian James Matthews21712.86
Majority51930.75N/A
Turnout 1,688
Liberal Democrats gain from Conservative Swing

Corvedale

Corvedale (1 seat)
PartyCandidateVotes%±%
Conservative Cecilia Mary Anne Motley* 998 66.27 -14.13
Green Anne Winifred Swinnerton Dyer44729.68
UKIP Charles Shackerley-Bennett614.05
Majority55136.59-43.81
Turnout 1,506
Conservative hold Swing

Ellesmere Urban

Ellesmere Urban (1 seat)
PartyCandidateVotes%±%
Conservative Geoff Elner 517 51.75 -15.69
Labour Alison Mary Davismes40040.04
Liberal Democrats Rod Keyes828.21-24.35
Majority11711.71-23.17
Turnout 999
Conservative hold Swing

Gobowen, Selattyn & Weston Rhyn

Gobowen, Selattyn & Weston Rhyn (2 seats)
PartyCandidateVotes%±%
Conservative Robert John Macey* 813 46.46 -3.30
Conservative Thomas Mark Jones* 791 45.20 +0.14
Labour Craig David Emery63436.23+12.31
Liberal Democrats Clare Valerie Geary34619.77+2.96
Liberal Democrats Clive Alfred Geary21912.51N/A
Turnout 1,761
Conservative hold Swing

Harlescott

Harlescott (1 seat)
PartyCandidateVotes%±%
Conservative Jeff Anderson 370 44.36 +10.82
Labour Lisa Roberts34741.61-15.53
Green Matt Galliers789.35
Liberal Democrats Artur Fejfer394.68
Majority232.75N/A
Turnout 834
Conservative gain from Labour Swing

Highley

Highley (1 seat)
PartyCandidateVotes%±%
Independent David Tremellen* 451 53.00 +9.87
Conservative Naomi Denise Waterson28633.61+5.13
Labour Charlotte Emily Round11413.40-3.77
Majority16519.39+4.74
Turnout 851
Independent hold Swing

Hodnet

Hodnet (1 seat)
PartyCandidateVotes%±%
Conservative Paul Michael Gillan 597 61.48 -20.54
No LabelKaren Dale Calder*25326.06
Liberal Democrats Sarah Jane Marston12112.46
Majority34435.42
Turnout 971
Conservative hold Swing

Karen Calder was previously elected as a Conservative.

Llanymynech

Llanymynech
PartyCandidateVotes%±%
Conservative Vince Hunt 601 48.55 -13.52
Liberal Democrats Dan Widdon47938.69+23.80
No LabelJohn Martin Jones15812.76
Majority1229.86-29.18
Turnout 1,238
Conservative hold Swing

Longden

Longden (1 seat)
PartyCandidateVotes%±%
Liberal Democrats Roger Arthur Evans* 1,082 67.58 +6.38
Conservative Owain Bryan Llywellyn Roberts40725.42-9.34
Labour Tom Stephen Alexander Doolan1127.00
Majority67542.16+15.72
Turnout 1,601
Liberal Democrats hold Swing

Loton

Loton (1 seat)
PartyCandidateVotes%±%
Conservative Edward Alan Potter* 1,105 75.02 +0.45
Labour Wynn Davies17211.68
Green Michelle Jane Sutton Jones1047.06-2.39
Liberal Democrats Lisa Michelle Walton926.25-9.73
Majority93363.34+4.75
Turnout 1,473
Conservative hold Swing

Ludlow East

Ludlow East (1 seat)
PartyCandidateVotes%±%
Liberal Democrats Tracey Huffer* 505 50.70 -13.50
Conservative James Anthony Durnall31331.43+9.18
Labour Colin Eric James Sheward13213.25-0.29
Green Neil John Taylor464.62
Majority19219.27-22.68
Turnout 996
Liberal Democrats hold Swing

Ludlow North

Ludlow North (1 seat)
PartyCandidateVotes%±%
Liberal Democrats Andy Boddington* 681 51.05 -17.84
Conservative Thomas Ian Scott Bell35326.46+3.19
Independent Graeme Perks19614.69
Green Linda Margaret Hale1047.80+3.65
Majority32824.59-44.30
Turnout 1,334
Liberal Democrats hold Swing

Ludlow South

Ludlow South (1 seat)
PartyCandidateVotes%±%
Liberal Democrats Elizabeth Vivienne Parry* 901 65.43 -0.38
Conservative Josh Boughton37727.38+0.43
Green Anthony David Lempert997.19
Majority52438.05-0.81
Turnout 1,377
Liberal Democrats hold Swing

Market Drayton East

Market Drayton East (1 seat)
PartyCandidateVotes%±%
Conservative Roy Aldcroft* 772 58.26 -14.97
Independent Geoff Chevins36127.25
Labour Charles Henry Warren Love19214.49-12.28
Majority41131.01-15.45
Turnout 1,325
Conservative hold Swing

Market Drayton West

Market Drayton West (2 seats)
PartyCandidateVotes%±%
Conservative Ian Charles Nellins 751 39.28 -10.63
Independent David James Minnery* 701 36.66 -13.25
Conservative Mark Joseph Whittle65934.47-15.14
Independent Roger Alan Hughes*61932.37-17.24
Labour Rob Bentley39320.55-7.50
Turnout 1,938
Conservative hold Swing
Independent gain from Conservative Swing

David Minnery and Roger Hughes were previously elected as Conservatives.

Meole

Meole (1 seat)
PartyCandidateVotes%±%
Liberal Democrats Bernie Bentick 546 35.57 +23.47
Conservative Gwen Burgess47731.07-24.36
Labour Philip Nigel Adams39125.47-2.01
Green Chris Davenport1217.88+2.88
Majority694.50N/A
Turnout 1,535
Liberal Democrats gain from Conservative Swing

Monkmoor

Monkmoor (1 seat)
PartyCandidateVotes%±%
Labour Pam Moseley* 468 43.35 -27.80
Liberal Democrats Slawomir Adam Fejefer37034.20
Conservative Patricia Burchett20919.32--9.53
Green Jeremy Mark Brown343.14
Majority989.15-33.15
Turnout 1,082
Labour hold Swing

Much Wenlock

Much Wenlock (1 seat)
PartyCandidateVotes%±%
Conservative Dan Thomas 931 60.61
Liberal Democrats Imogen Grace Fawcett34522.46
Green Mike Atherton26016.93
Majority58638.15N/A
Turnout 1,536
Conservative hold

At the previous election, the Conservative candidate was elected unopposed.

Oswestry East

Oswestry East (2 seats
PartyCandidateVotes%±%
Conservative John William Price* 889 50.68 +5.29
Conservative Chris Schofield 667 38.03 +2.73
Green Jay Moore50128.56+11.87
Green Olly Rose44625.43+10.61
Labour Graeme Roger Currie32418.47+0.09
Liberal Democrats Lee Kelvin Bennett764.33+0.25
Liberal Democrats Romer Wilfred Hoseason703.99-1.67
Turnout 1,769
Conservative hold Swing

Oswestry South

Oswestry South (1 seat)
PartyCandidateVotes%±%
Green Duncan Alistair Kerr 760 55.68 +8.03
Conservative David Paul Milner*60544.32-8.03
Majority15511.36N/A
Turnout 1,365
Green gain from Conservative Swing

Oswestry West

Oswestry West (1 seat)
PartyCandidateVotes%±%
Green Mike Isherwood 548 53.67 +6.92
Conservative Les Maguire36735.95-10.80
Labour Neil John Sanderson10610.38
Majority18117.72N/A
Turnout 1,021
Green gain from Conservative Swing

Porthill

Porthill (1 seat)
PartyCandidateVotes%±%
Green Julian David Geoffrey Dean* 1,021 56.91 +15.22
Liberal Democrats Graham James Tate32518.12-8.98
Conservative William John Rowland30917.22-13.95
Labour Anwen Margaret Davies1397.75
Majority69638.79+24.24
Turnout 1,794
Green hold Swing

Prees

Prees (1 seat)
PartyCandidateVotes%±%
Conservative Paul Anthony Donald Wynn* 991 76.47 +14.34
Liberal Democrats Julie Marion Bushell30523.53
Majority68652.94+28.68
Turnout 1,296
Conservative hold Swing

Quarry and Coton Hill

Quarry and Coton Hill (1 seat)
PartyCandidateVotes%±%
Liberal Democrats Nat Green* 532 40.92 -15.44
Conservative Robin John Hooper34626.62-5.48
Labour Paul Forrest28822.15
Green Huw Richard Wystan Peach13410.31
Majority18614.30-9.96
Turnout 1,300
Liberal Democrats hold Swing

Radbrook

Radbrook (1 seat)
PartyCandidateVotes%±%
Green Julia Louse Evans 1,032 51.78 +37.00
Conservative Susan Ann Coleman68334.27-24.35
Labour Kevin Dovaston27813.95
Majority34917.51N/A
Turnout 1,993
Green gain from Conservative Swing

Rea Valley

Rea Valley (1 seat)
PartyCandidateVotes%±%
Conservative Nick Hignett* 924 71.35 +16.12
Labour Co-op John Olaf Lewis14711.35
Green Catherine Elizabeth Girvan1229.42+3.51
Liberal Democrats Nicholas Woodforde Deane1027.88-30.98
Majority77760.00+43.63
Turnout 1,295
Conservative hold Swing

Ruyton & Baschurch

Ruyton & Baschurch (1 seat)
PartyCandidateVotes%±%
Conservative Nick Bardsley* 652 47.52 -26.12
Liberal Democrats Robert John Jones56240.96+35.77
Labour David Michael Sharpe15811.52-2.84
Majority906.56-52.73
Turnout 1,372
Conservative hold Swing

Severn Valley

Severn Valley
PartyCandidateVotes%±%
Conservative Claire Margaret Wild* 1,136 59.54 -20.47
Labour Jim Healey57330.03
Green Tim Dawes1427.44-3.11
Liberal Democrats Erwin Franciscus Cornelius van der Stap572.99-6.45
Majority56329.51-39.95
Turnout 1,908
Conservative hold Swing

Shawbury

Shawbury (1 seat)
PartyCandidateVotes%±%
Conservative Simon Paul Anderson Jones* 783 60.37 -16.09
Liberal Democrats Adrian Howard Brown51439.63
Majority26920.74-32.18
Turnout 1,297
Conservative hold Swing

Shifnal North

Shifnal North (1 seat)
PartyCandidateVotes%±%
Independent Kevin David Turley* 806 57.33 -23.85
Conservative Louis Anthony Jenks60042.67+23.85
Majority20614.66-47.70
Turnout 1,406
Independent hold Swing

Shifnal South and Cosford

Shifnal South and Cosford (1 seat)
PartyCandidateVotes%±%
Conservative Edward Francis Bird 952 56.13 -1.01
Independent John Moore42925.29
Labour Jan Henri Coulson31518.57
Majority52330.84+5.18
Turnout 1,696
Conservative hold Swing

St Martin's

St Martin's (1 seat)
PartyCandidateVotes%±%
Conservative Steve Davenport* 688 58.40 -8.14
Labour Natalie Rowley49041.60+8.14
Majority19816.80-16.28
Turnout 1,178
Conservative hold Swing

St Oswald

St Oswald (1 seat)
PartyCandidateVotes%±%
Conservative Joyce Bernadette Barrow* 755 58.57 -0.79
Green Rosie Radford53441.43
Majority22117.14-1.58
Turnout 1,289
Conservative hold Swing

Sundorne

Sundorne (1 seat)
PartyCandidateVotes%±%
Labour Kevin John Pardy* 599 73.05 -0.87
Conservative David William Llwelyn Roberts16420.00-6.08
Green Gareth Egarr445.37
Liberal Democrats Vijay Gajendra Naidu131.59
Majority43553.05+5.21
Turnout 820
Labour hold Swing

Tern

Tern (1 seat)
PartyCandidateVotes%±%
Conservative Lezley May Picton* 866 56.82 -5.80
Labour Co-op Alan William Herbert32621.39+5.73
No LabelMandie Lee18111.88
Green Jamie Edward Russell1519.91+3.92
Majority54044.94-1.95
Turnout 1,524
Conservative hold Swing

The Meres

The Meres (1 seat)
PartyCandidateVotes%±%
Conservative Brian Beckett Williams* 868 50.67 -14.91
Liberal Democrats Helen Margaret Lilian Morgan 84549.33+37.37
Majority231.34-50.25
Turnout 1,713
Conservative hold Swing

Underdale

Underdale (1 seat)
PartyCandidateVotes%±%
Liberal Democrats David Vasmer 535 45.80 +9.43
Labour Eddie Uyan37131.82+2.64
Conservative David John Morgan20017.15-10.43
Green Marina Ann Churm605.15-1.72
Majority16414.06+6.87
Turnout 1,166
Liberal Democrats hold Swing

Wem

Wem (2 seats)
PartyCandidateVotes%±%
Independent Edward Walley Towers 1,141 48.29 N/A
Conservative Peter Broomhall 933 39.48 +3.98
Liberal Democrats Geoff Soul89437.83-25.23
Conservative Chris Parker85336.10+18.81
Turnout 2,382
Independent gain from Liberal Democrats Swing
Conservative gain from Independent Swing

Whitchurch North

Whitchurch North (2 seats)
PartyCandidateVotes%±%
Conservative Peggy Mullock* 1,129 57.43 -15.56
Conservative Tom Biggins* 847 43.08 -5.84
Liberal Democrats Nick Saxby79540.44+26.93
Liberal Democrats Ron Kelley41321.01N/A
UKIP Andy Allen1577.99N/A
Turnout 1,982
Conservative hold Swing

Whitchurch South

Whitchurch South (1 seat)
PartyCandidateVotes%±%
Conservative Gerald Lionel Dakin* 588 62.96 +10.34
Liberal Democrats Gregory Kriangkrai Ebbs34637.04+17.59
Majority24225.92-7.25
Turnout 934
Conservative hold Swing

Whittington

Whittington (1 seat)
PartyCandidateVotes%±%
Conservative Steve Charmley* 638 51.37 -2.07
Liberal Democrats David Walker60448.63+22.65
Majority342.74-24.72
Turnout 1,242
Conservative hold Swing

Worfield

Worfield (1 seat)
PartyCandidateVotes%±%
Conservative Richard Peter Marshall 754 74.95 -1.83
Liberal Democrats Helen Elizabeth Howell14714.61+3.31
Green James Andrew Wrench10510.44
Majority60760.34-4.53
Turnout 1,006
Conservative hold Swing

By-elections

Highley

Highley: 23 June 2022
PartyCandidateVotes%±%
Liberal Democrats Mark Williams 630 54.4 N/A
Conservative Naomi Waterson27924.1-9.5
Labour Liam Atwal23920.7-7.3
Green Clare Nash90.8N/A
Majority35130.3
Turnout 1,15740.3
Liberal Democrats gain from Independent Swing N/A

Bridgnorth West and Tasley

Bridgnorth West and Tasley: 6 October 2022
PartyCandidateVotes%±%
Labour Rachel Connolly 887 55.9 +6.0
Conservative Jonathan Holland48030.2-4.6
Liberal Democrats Richard Stilwell17611.1-1.6
Green Clare Nash452.8+0.2
Majority40725.7
Turnout 1,59428.9
Labour gain from Conservative Swing Increase2.svg5.3

Worfield

Worfield: 7 September 2023
PartyCandidateVotes%±%
Liberal Democrats Andrew Sherrington 400 48.1 +33.6
Conservative Michael Wood39247.1-27.9
Labour Shanti Flynn404.8-5.6
Majority81.0
Turnout 83228.5
Liberal Democrats gain from Conservative Swing Increase2.svg30.7

Alveley & Claverley

Alveley & Claverley: 19 October 2023
PartyCandidateVotes%±%
Liberal Democrats Colin Taylor 662 58.7 +36.5
Conservative Jonathan Davey40836.3-33.0
Labour Ann Philp554.9New
Majority25422.4
Turnout 1,12531.6
Liberal Democrats gain from Conservative Swing Increase2.svg34.7

Related Research Articles

<span class="mw-page-title-main">Aberdeen City Council</span> Unitary authority council in Aberdeen, Scotland

Aberdeen City Council is the local government authority for the city of Aberdeen, Scotland. It was created in 1996, under the Local Government etc. (Scotland) Act 1994, though a sense of Aberdeen as a city, with its own city council, can be traced back to 1900, when the county of the city of Aberdeen was created.

<span class="mw-page-title-main">Leicester City Council</span> Unitary authority in Leicester, England

Leicester City Council is a unitary authority responsible for local government in the city of Leicester, England. It consists of 54 councillors, representing 22 wards in the city, overseen by a directly elected mayor. It is currently controlled by the Labour Party and has been led by mayor Sir Peter Soulsby since 2011. The council also appoints a ceremonial Lord Mayor who chairs council meetings; the directly elected mayor is termed the City Mayor to distinguish the post from the Lord Mayor.

<span class="mw-page-title-main">2007 United Kingdom local elections</span>

The 2007 United Kingdom local elections were held on Thursday 3 May 2007. These elections took place in most of England and all of Scotland. There were no local government elections in Wales though the Welsh Assembly had a general election on the same day. There were no local government elections in Northern Ireland. Just over half of English councils and almost all the Scottish councils began the counts on Friday, rather than Thursday night, because of more complex arrangements regarding postal votes.

<span class="mw-page-title-main">North Yorkshire Council</span> Unitary authority in England

North Yorkshire Council, known between 1974 and 2023 as North Yorkshire County Council, is the unitary authority which governs the non-metropolitan county of North Yorkshire, England. It is one of five unitary authorities which governs the larger ceremonial county of North Yorkshire. The council is based at County Hall, Northallerton, and consists of 90 councillors. It is a member of the York and North Yorkshire Combined Authority.

Shropshire Council elections are held every four years, and since 2009 74 councillors have been elected from 63 electoral divisions.

The 2005 elections to Shropshire County Council took place on 5 May 2005, alongside the 2005 general election across the entire United Kingdom.

<span class="mw-page-title-main">2010 Swindon Borough Council election</span> 2010 UK local government election

The 2010 Swindon Borough Council election took place on 6 May 2010 to elect members of Swindon Unitary Council in Wiltshire, England. One third of the council was up for election and the Conservative Party stayed in overall control of the council.

<span class="mw-page-title-main">2011 Wokingham Borough Council election</span> 2011 UK local government election

The 2011 Wokingham Borough Council election took place on 5 May 2011 to elect members of Wokingham Unitary Council in Berkshire, England. One third of the council was up for election and the Conservative Party stayed in overall control of the council.

<span class="mw-page-title-main">2013 Shropshire Council election</span>

The 2013 elections to Shropshire Council were held on 2 May 2013 as part of the 2013 United Kingdom local elections. These were the second elections to the unitary authority created as part of local government restructuring in Shropshire, following on from the previous elections in 2009. All 74 seats in the 63 electoral divisions were up for election across Shropshire. At the same time, all town and parish council contested elections took place, most notably including Shrewsbury Town Council.

<span class="mw-page-title-main">2004 West Oxfordshire District Council election</span>

The 2004 West Oxfordshire District Council election took place on 10 June 2004 to elect members of West Oxfordshire District Council in Oxfordshire, England. One third of the council was up for election and the Conservative Party stayed in overall control of the council.

<span class="mw-page-title-main">2017 Essex County Council election</span> 2017 UK local government election

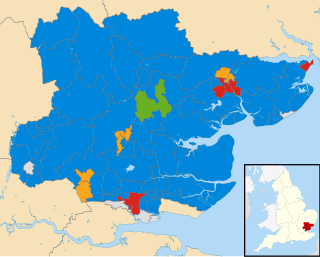
Elections to Essex County Council took place on 4 May 2017 as part of the 2017 local elections. All 75 councillors were elected from 70 electoral divisions, which each returned either one or two councillors by first-past-the-post voting for a four-year term of office.

<span class="mw-page-title-main">2021 United Kingdom local elections</span> Elections to local councils and mayoralties

The 2021 United Kingdom local elections were held on Thursday 6 May 2021. More than 145 English local councils, around 5,000 councillor seats, thirteen directly elected mayors in England, and 39 police and crime commissioners in England and Wales were contested. On the same day, the 2021 Hartlepool by-election took place, and there were also elections to the Scottish Parliament, Senedd and London Assembly, the last in conjunction with the London mayoral election.

<span class="mw-page-title-main">Heath (Cardiff ward)</span> Electoral ward in Wales

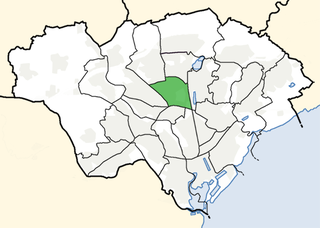
Heath is the name of an electoral ward in the north of the city of Cardiff, Wales, which covers its namesake community, Heath. The ward elects three county councillors to the County Council of the City and County of Cardiff.

The 2019 Bracknell Forest Borough Council election took place on 2 May 2019 to elect all 42 councillors in 18 wards for Bracknell Forest Borough Council in England.

<span class="mw-page-title-main">2019 Wokingham Borough Council election</span> 2019 UK local government election

The 2019 Wokingham Borough Council election took place on Thursday 2 May 2019. That was the same day as other United Kingdom local elections in order to elect members of Wokingham Unitary Council in Berkshire, England. One third of the council was up for election.

<span class="mw-page-title-main">2019 Dorset Council election</span> 2019 UK local government election

The 2019 Dorset Council election was held on Thursday 2 May 2019 to elect councillors to the new Dorset Council in England. It took place on the same day as other district council elections in the United Kingdom.

<span class="mw-page-title-main">2022 United Kingdom local elections</span> Elections to local councils and mayoralties

The 2022 United Kingdom local elections took place on Thursday 5 May 2022. These included elections for all London borough councils, for all local authorities in Wales and Scotland. Most seats in England were last up for election in 2018 and in Scotland and Wales in 2017. The elections coincided with the 2022 Northern Ireland Assembly election. In 91 cases, most of them in Wales, council seats were uncontested, each having only one candidate. Three seats in Scotland remained unfilled as no one nominated to fill them.

<span class="mw-page-title-main">2022 Plymouth City Council election</span> 2022 local election in Plymouth

The 2022 Plymouth City Council election took place on 5 May 2022 to elect members of Plymouth City Council in England. It coincided with local elections across the United Kingdom. The Conservative Party made gains in the previous election in 2021, resulting in the council entering no overall control with no party holding a majority of seats. Immediately following the results of the 2022 election, the council remained in no overall control. Labour and the Conservatives gained seats from independent councillors who had left their parties and exchanged seats with each other. The election saw the elections of the city's first Green Party councillor, Ian Poyser, and first trans councillor, Dylan Tippetts of the Labour Party.

Elections to North Ayrshire Council took place on 5 May 2022 on the same day as the 31 other Scottish local government elections. As with other Scottish council elections, it was held using single transferable vote (STV) – a form of proportional representation – in which multiple candidates are elected in each ward and voters rank candidates in order of preference.

<span class="mw-page-title-main">2022 Argyll and Bute Council election</span> Argyll and Bute Council election

Elections to Argyll and Bute Council took place on 5 May 2022, the same day as the 31 other Scottish local government elections. As with other Scottish council elections, it was held using single transferable vote (STV)—a form of proportional representation—in which multiple candidates are elected in each ward and voters rank candidates in order of preference. New ward boundaries were proposed by Boundaries Scotland in 2021, which would have reduced the total number of councillors to 34. However, these were rejected by the Scottish Parliament and the boundaries used at the previous election remained in place.

References

  1. "Conservatives keep control of Shropshire Council but lose leader after mixed election results".
  2. "Shropshire Council elects Lezley Picton new Leader". 20 May 2021.
  3. "Unitary results - 4 May 2017 - Shropshire Council". Shropshire Council .
  4. "Unitary results - 6 May 2021 - Shropshire Council". Shropshire Council .