2021 Devon County Council election

Last updated

2021 Devon County Council election
Flag of Devon.svg
  2017 6 May 20212025 

60 seats to Devon County Council
31 seats needed for a majority
 First partySecond partyThird party
 
Party Conservative Liberal Democrats Labour
Last election42 seats, 44.4%7 seats, 21.7%7 seats, 15.2%
Seats won3997
Seat changeDecrease2.svg3Increase2.svg2Steady2.svg
Popular vote108,70245,39540,640
Percentage42.4%17.7%15.9%
SwingDecrease2.svg2%Decrease2.svg4%Increase2.svg0.7%

 Fourth partyFifth party
 
Party Independent Green
Last election3 seats, 9.6% 1 seats, 5.4%
Seats won32
Seat changeSteady2.svgIncrease2.svg1
Popular vote27,70728,285
Percentage10.8%11.0
SwingIncrease2.svg1.4%Increase2.svg5.6%

Devon UK local election 2021 gradient map.svg
2021 Devon County Council Election Results Map.

Council control before election

Conservative

Council control after election

Conservative

The 2021 Devon County Council election took place alongside the other local elections. All 60 councillors to Devon County Council were elected. [1] A total of 256,974 votes were cast including spoiled ballots. [2]

Contents

Summary

Election result

2021 Devon County Council election [3]
PartyCandidatesSeatsGainsLossesNet gain/lossSeats %Votes %Votes+/−
  Conservative 603924Decrease2.svg 265.042.8108,702–1.6
  Liberal Democrats 55942Increase2.svg 215.017.945,395–3.8
  Labour 60700Steady2.svg11.716.040,640+0.8
  Independent 27310Steady2.svg9.68.621,962–1.0
  Green 45210Increase2.svg 15.411.128,285+4.6
  East Devon Alliance 3001Decrease2.svg 10.02.46,046
 Freedom Alliance (UK)20000Steady2.svg0.00.61,472N/A
  TUSC 6000Steady2.svg0.00.3671N/A
  Reform UK 5000Steady2.svg0.00.2424N/A
  For Britain 2000Steady2.svg0.00.1242N/A
  Women's Equality 1000Steady2.svg0.00.1139N/A
 The Democratic Network1000Steady2.svg0.0<0.195N/A
  UKIP 1000Steady2.svg0.0<0.168–4.4

Division Results

East Devon

[4]

Axminster
PartyCandidateVotes%±%
Conservative Ian Hall 1,672 43.6 -3.5
East Devon Alliance Paul Hayward1,43937.6+1.8
Labour Co-op Oliver Tucker49813.0+4.7
Liberal Democrats Jules Hoyles2095.5-3.2
Majority2336.1-5.2
Turnout 3,83238.7-0.8
Conservative hold
Broadclyst
PartyCandidateVotes%±%
Green Henry Gent 1,992 45.4 +25.7
Conservative Sara Randall Johnson 1,671 38.1 -6.0
Conservative Tom Hobson1,48833.9-14.1
Liberal Democrats Jamie Kemp89620.4-4.0
Labour Mathieu Holladay59913.7+1.7
Labour Ellis Davies57113.0+1.2
Independent Peter Faithfull53512.2N/A
Majority
Turnout 4,41332.0-13.7
Green gain from Conservative
Conservative hold
Exmouth
PartyCandidateVotes%±%
Conservative Jeff Trail 3,727 44.1 +10.1
Conservative Richard Scott 3,685 43.6 +8.0
Independent Joe Whibley2,37328.1N/A
Liberal Democrats Tim Dumper1,84421.8+0.3
Labour Co-op Josie Parkhouse1,50917.9+9.2
Labour Co-op Daniel Wilson1,22414.5+6.5
Green Michael Rosser1,21414.4+5.0
Majority
Turnout 8,56632.9+1.5
Conservative hold
Conservative hold
Exmouth and Budleigh Salterton Coastal
PartyCandidateVotes%±%
Conservative Christine Channon 2,307 49.2 -5.5
Liberal Democrats Penny Lewis74715.9-5.5
Green David Ireson50310.7+5.2
Labour Keith Edwards47810.2+0.2
Independent Brian Bailey4609.8N/A
Reform UK David Hayward781.7N/A
UKIP Brigitte Graham681.5-4.7
Majority1,56033.30
Turnout 4,68538.7+0.2
Conservative hold
Feniton and Honiton
PartyCandidateVotes%±%
Conservative Phil Twiss 2,094 53.3 -7.8
Labour Jake Bonetta1,49137.9+20.2
Liberal Democrats Cathy Connor3218.2-3.9
Majority60315.3-28.2
Turnout 3,93034.1+7
Conservative hold
Otter Valley
PartyCandidateVotes%±%
Independent Jess Bailey 3,224 65.2 N/A
Conservative Charlie Hobson1,28125.9-3.3
Green Luke Gray2044.1N/A
Labour Steve Bloomfield1342.7+0.2
Liberal Democrats Jake Slee801.6N/A
Majority1,94339.3-12.7
Turnout 4,94843.5-2.6
Independent gain from Independent
Seaton and Colyton
PartyCandidateVotes%±%
Conservative Marcus Hartnell 2,321 44.7 +7.6
East Devon Alliance Martin Shaw2,17641.9+3.9
Labour George Tomkins3065.9+1.3
Liberal Democrats Martyn Wilson1603.1-7.8
The Democratic NetworkAngela Marynicz951.8N/A
Freedom AlliancePaul Blackmore841.6N/A
Majority1452.8+1.9
Turnout 5,19042.5+1.5
Conservative gain from East Devon Alliance
Sidmouth
PartyCandidateVotes%±%
Conservative Stuart Hughes 2,601 49.4 +2.1
East Devon Alliance Louise MacAllister2,43146.2+8.5
Labour Co-op Colin Mills2094.0-0.6
Majority1703.2-6.4
Turnout 5,26542.8+1.8
Conservative hold
Whimple and Blackdown
PartyCandidateVotes%±%
Conservative Iain Chubb 2,535 57.4 -8.1
Liberal Democrats Karen Hoyles69015.6-7.8
Labour Co-op Liz Pole62414.1+3.8
Green Wes Healey52311.8N/A
Majority1,84541.8-0.2
Turnout 4,41939.9+1.5
Conservative hold

Exeter

[5]

Alphington and Cowick
PartyCandidateVotes%±%
Labour Co-op Yvonne Atkinson 1,955 41.8 -1.5
Conservative Katherine New1,70036.3+2.3
Green Julyan Levy50710.8+4.7
Liberal Democrats Rod Ruffle48310.3-2.2
Majority2555.5-3.7
Turnout 4,67742.22+0.82
Labour hold
Duryard and Pennsylvania
PartyCandidateVotes%±%
Conservative Percy Prowse 1,370 37.2 -9.6
Labour Martyn Snow1,20132.6+0.9
Liberal Democrats Michael Mitchell54914.9+1.2
Green Rich Parker42511.5+5.8
Women's Equality Bea Gare1363.7N/A
Majority1694.6-10.5
Turnout 3,69944.46-3.04
Conservative hold
Exwick and St Thomas
PartyCandidateVotes%±%
Labour Rob Hannaford 1,828 51.3 -6.0
Conservative Lee Gillett91625.7+4.4
Green Jamie Lynde46413.0+4.5
For Britain Frankie Rufolo1975.5N/A
Liberal Democrats Maya Skelton1604.5-2.1
Majority91225.6-10.4
Turnout 3,56535.35-0.75
Labour hold
Heavitree and Whipton Barton
PartyCandidateVotes%±%
Labour Danny Barnes 1,937 44.2 +12.3
Conservative Alfie Carlisle1,27329.1-1.6
Green Lizzie Woodman95421.8+4.4
Liberal Democrats Lily James1573.6-14.2
For Britain Debbie Frayne451.0-1.2
Majority66415.2-4.7
Turnout 4,37840.48-0.52
Labour hold
Pinhoe and Mincinglake
PartyCandidateVotes%±%
Labour Tracy Adams 1,935 48.3 +2.1
Conservative John Harvey1,33333.2-5.2
Green Paula Fernley2837.1+2.8
Independent Kate Jago2736.8N/A
Liberal Democrats Henry Mayall1513.8-1.8
Majority60215.0+7.2
Turnout 4,01038.72-0.48
Labour hold
St David's and Haven Banks
PartyCandidateVotes%±%
Labour Carol Whitton 1,671 41.2 -2.9
Green Andrew Bell1,49536.8+19.2
Conservative Arden Foster-Spink72017.7-8.0
Liberal Democrats Joel Hambly1724.2-5.5
Majority1764.3
Turnout 4,0584.3-14.1
Labour hold
St Sidwell's and St James
PartyCandidateVotes%±%
Labour Su Aves 1,967 52.1 -8.6
Green Johanna Korndorfer84422.3+12.3
Conservative David Moore51613.7-7.2
Liberal Democrats Kevin Mitchell44711.8+3.7
Majority1,12329.8-10.0
Turnout 3,77432.05-4.55
Labour hold
Wearside and Topsham
PartyCandidateVotes%±%
Conservative Andrew Leadbetter 2,332 48.3 -6.5
Labour Helen Dallimore1,49430.9+1.9
Green Jon Mills67514.0+8.4
Liberal Democrats Christine Campion3306.8+0.1
Majority83817.3-4.6
Turnout 4,831
Conservative hold
Wonford and St Loye's
PartyCandidateVotes%±%
Labour Marina Asvachin 1,477 43.6 -3.5
Conservative Peter Holland1,45743.0+5.6
Green Jack Eade3179.4+5.1
Liberal Democrats Kris Mears1364.0-2.8
Majority200.6-9.1
Turnout 3,38735.11+1.41
Labour hold

Mid Devon

[6]

Crediton
PartyCandidateVotes%±%
Liberal Democrats Frank Letch 1,811 44.0 -4.8
Conservative Martin Binks1,64539.9+0.8
Labour Elin Bold54313.2+6.9
Freedom AllianceChristopher Hurley952.3N/A
Majority1664.0
Turnout 4,11839.4
Liberal Democrats hold
Creedy Taw and Mid Exe
PartyCandidateVotes%±%
Conservative Margaret Squires 2,798 54.4 +1.0
Green Paul Edwards94618.4+12.1
Liberal Democrats David Wilson78415.2-9.1
Labour Thomas Stephenson4779.3+1.1
Freedom AllianceAnn Conway1032.0N/A
Majority1,85236.0
Turnout 5,14746.5
Conservative hold
Cullompton and Bradninch
PartyCandidateVotes%±%
Conservative John Berry 1,861 53.0 +8.7
Liberal Democrats Andrea Glover76521.8-2.2
Green Hannah Watson44912.8+10.7
Labour Edward Southerden41111.7+1.9
Majority1,09631.2
Turnout 3,50933.8
Conservative hold
Tiverton East
PartyCandidateVotes%±%
Conservative Colin Slade 1,598 47.0 +5.5
Liberal Democrats Matt Farrell79223.3-6.9
Labour Jason Chamberlain66319.5+1.3
Independent Andrew Perris3359.8N/A
Majority80623.7
Turnout 3,40333.9
Tiverton West
PartyCandidateVotes%±%
Conservative Richard Chesterton 1,990 45.6 +2.0
Green Trevor Cope1,14026.1N/A
Labour Peter Hill87820.1+3.5
Ana Hendy3016.9N/A
Majority85019.5
Turnout 4,36038.1
Conservative hold
Willand and Uffculme
PartyCandidateVotes%±%
Conservative Ray Radford 2,093 51.7 -0.8
Liberal Democrats Simon Clist87521.6-0.3
Green Adam Rich55213.6+7.5
Labour Fiona Hutton42310.5+2.4
Freedom AllianceCharles Kay591.5N/A
Majority1,21830.1
Turnout 4,04537.9
Conservative hold

North Devon

[7]

Barnstaple North
PartyCandidateVotes%±%
Liberal Democrats Ian Roome 1,499 44.1 -8.6
Green Robbie Mack83724.6+17.5
Conservative Natasha Vukic74221.8-1.6
Labour Nicholas Agnew2276.7-2.4
Freedom AllianceRob Pet621.8N/A
Majority66219.5
Turnout 3,39632.4
Liberal Democrats hold
Barnstaple South
PartyCandidateVotes%±%
Liberal Democrats Caroline Leaver 1,436 41.1 +6.9
Conservative David Hoare1,21734.8-9.8
Independent David Luggar3289.4N/A
Green Lou Goodger2507.2+2.2
Labour Philip Hawkins2025.8-3.9
Freedom AllianceJosie Knight411.2N/A
Majority2196.3
Turnout 3,49634.0
Liberal Democrats gain from Conservative
Braunton Rural
PartyCandidateVotes%±%
Conservative Pru Maskell 1,514 42.4 +1.7
Liberal Democrats Liz Spear1,02428.7-4.8
Labour Mark Cann49513.9-4.5
Green David Relph45412.7N/A
Freedom AllianceStewart Johnstone441.2N/A
Majority49013.7
Turnout 3,56837.5
Conservative hold
Chulmleigh and Landkey
PartyCandidateVotes%±%
Conservative Paul Henderson 1,523 45.0 -14.0
Independent Glyn Lane62018.3N/A
Green Nick Withers44713.2+6.8
Liberal Democrats Victoria Nel43112.7-15.5
Labour Valerie Cann2086.1-0.1
Independent Philip Mason832.4N/A
Freedom AllianceTurtle Knight551.6N/A
Majority90326.7
Turnout 3,38841.5
Conservative hold
Combe Martin Rural
PartyCandidateVotes%±%
Conservative Andrea Davis 2,476 62.8 -0.3
Liberal Democrats Julie Hunt55614.1-1.5
Green Steven White45611.6+3.6
Labour Oliver Bell3338.4-0.1
Freedom AllianceKatherine Armitage792.0N/A
Majority1,92048.7
Turnout 3,94540.2
Conservative hold
Fremington Rural
PartyCandidateVotes%±%
Independent Frank Biederman 2,627 64.6 +8.8
Conservative Scott Paddon78919.4-8.7
Liberal Democrats Helen Walker3107.6-0.7
Labour Finola O'Neill1513.7+0.6
Green Stephen Jarvis1463.6+1.7
Freedom AlliancePaddy Sullivan300.7N/A
Majority1,83845.2
Turnout 4,06840.3
Independent hold
Ilfracombe
PartyCandidateVotes%±%
Conservative Paul Crabb 1,493 51.1 +13.0
Green Netti Pearson85729.3+2.6
Liberal Democrats Syed Jusef2869.8N/A
Labour Cecily Blyther2157.4-0.9
Freedom AllianceLesley Mason451.5N/A
Majority63621.8
Turnout 2,92433.2
Conservative hold
South Molton
PartyCandidateVotes%±%
Conservative Jeremy Yabsley 2,139 54.1 -3.8
Liberal Democrats Alex White91823.2-6.9
Labour Steven Hinchliffe3037.7+0.5
Green Gill Saunders2726.9+2.4
Independent Steve Cotten2335.9N/A
Freedom AllianceVal Schenn771.9N/A
Majority1,22130.9
Turnout 3,95537.5
Conservative hold

South Hams

[8]

Bickleigh and Wembury
PartyCandidateVotes%±%
Conservative John Hart 2,470 63.9 -7.5
Labour Edward Parsons53413.8+2.5
Green Win Scutt41610.8+3.4
Liberal Democrats Christopher Oram3539.1-0.4
Freedom AllianceEmma Relph591.5N/A
Majority
Turnout 38.6
Conservative hold
Dartmouth and Marldon
PartyCandidateVotes%±%
Conservative Jonathan Hawkins 2,380 60.9 -5.4
Liberal Democrats Simon Rake70718.1+4.9
Labour Kevin John54914.1+4.2
Reform UK Carlo Bragagnolo922.4N/A
TUSC Lynn Gunnigle822.1N/A
Freedom AllianceChristian Parkes591.5N/A
Majority
Turnout 40.3
Conservative hold
Ivybridge
PartyCandidateVotes%±%
Conservative Roger Croad 1,982 55.8 +0.1
Liberal Democrats Victor Abbott85524.1+18.1
Labour David Trigger62117.5-9.6
Freedom AllianceSimon Gedye651.8N/A
Majority
Turnout 37.8
Conservative hold
Kingsbridge
PartyCandidateVotes%±%
Liberal Democrats Julian Brazil 2,683 52.5 +1.3
Conservative Samantha Dennis1,79335.1-6.6
Green Bettina Rixon2765.4N/A
Labour Paul Furlong2374.6-2.3
Freedom AlliancePeter Burgess891.7N/A
Majority
Turnout 48.0
Liberal Democrats hold
Salcombe
PartyCandidateVotes%±%
Conservative Rufus Gilbert 2,500 59.9 -1.6
Liberal Democrats Mark Lawrence62214.9-9.7
Labour Jonno Barrett47911.5+4.0
Green Lily Rixon46211.1+4.7
Freedom AllianceJim Blake681.6N/A
Majority
Turnout 44.5
Conservative hold
South Brent and Yealmpton
PartyCandidateVotes%±%
Liberal Democrats Daniel Thomas 2,112 41.2 +10.6
Conservative Richard Hosking2,07440.5-11.4
Labour Paul Bishop78415.3+7.4
Freedom AllianceJames Sandy1192.3N/A
Majority
Turnout 48.7
Liberal Democrats gain from Conservative
Totnes and Dartington
PartyCandidateVotes%±%
Green Jacqi Hodgson 3,026 59.6 +24.7
Conservative Jamie Rogers1,08821.4+1.0
Labour Jill Hannam73814.5+2.0
Freedom AllianceStephen Hopwood1893.7N/A
Majority
Turnout 48.0
Green hold

Teignbridge

[9]

Ashburton and Buckfastleigh
PartyCandidateVotes%±%
Conservative Sarah Parker-Khan 1,741 40.8 +4.4
Liberal Democrats John Nutley1,44433.9-2.0
Green Andy Williamson54912.9N/A
Labour Su Maddock50111.7+3.3
Majority
Turnout 42.8
Conservative hold
Bovey Rural
PartyCandidateVotes%±%
Conservative George Gribble 2,004 46.8 -3.1
Liberal Democrats Sally Morgan88120.6-11.1
Labour Lisa Robillard Webb52212.2+5.1
Independent Eoghan Kelly46010.7+6.2
Green Anna Presland3788.8+4.9
Majority
Turnout 41.6
Conservative hold
Chudleigh and Teign Valley
PartyCandidateVotes%±%
Conservative Jerry Brook 1,704 38.9 -10.7
Liberal Democrats Richard Keeling1,47933.8-3.9
Green Emily Simcock67415.4+9.9
Labour Rick Webb48511.1+4.1
Majority
Turnout 42.6
Conservative hold
Dawlish
PartyCandidateVotes%±%
Liberal Democrats Martin Wrigley 1,920 39.6 +7.7
Conservative Noel Nickless1,81837.5-14.3
Independent Linda Petherick57111.8N/A
Labour Jeff Pocock3757.7-2.1
Reform UK Richard Ward751.5N/A
TUSC Bruce Mattock691.4N/A
Majority
Turnout 38.5
Liberal Democrats gain from Conservative
Exminster and Haldon
PartyCandidateVotes%±%
Liberal Democrats Alan Connett 2,521 65.0 +13.5
Conservative Terry Tume80620.8-15.7
Green Lucy Rockliffe3128.0+2.9
Labour Bhav Studley2225.7+0.9
Majority
Turnout 42.5
Liberal Democrats hold
Ipplepen and The Kerswells
PartyCandidateVotes%±%
Liberal Democrats Alistair Dewhirst 1,822 38.6 -7.4
Conservative Chris Clarance1,59033.7-10.5
Independent Jane Taylor92819.7N/A
Green Graham Read1833.9+0.4
Labour John Hodgson1713.6+0.4
Majority
Turnout 44.9
Liberal Democrats hold
Kingsteignton and Teign Estuary
PartyCandidateVotes%±%
Conservative Ron Peart 2,182 58.9 +6.6
Liberal Democrats Andrew MacGregor81221.9-2.7
Labour Christopher Robillard53314.4+5.7
TUSC James Osben1534.1-4.6
Majority
Turnout 30.8
Conservative hold
Newton Abbot North
PartyCandidateVotes%±%
Conservative Phil Bullivant 1,280 38.4 +4.5
Independent Liam Mullone83525.1N/A
Liberal Democrats Eloise Rokirilov79523.9-14.5
Labour Lesley Robson2988.9+0.5
TUSC Ryan Hall982.9N/A
Majority
Turnout 30.0
Conservative gain from Liberal Democrats
Newton Abbot South
PartyCandidateVotes%±%
Independent Janet Bradford 1,157 33.1 N/A
Liberal Democrats Colin Parker96727.7-33.8
Conservative Alex Hall92826.5-1.1
Labour John Fitzsimmons1905.4-2.6
Green Doug Pratt1514.3+1.6
TUSC Jane Haden641.8N/A
Majority
Turnout 35.5
Independent gain from Liberal Democrats
Teignmouth
PartyCandidateVotes%±%
Liberal Democrats David Cox 2,240 47.9 +8.4
Conservative Sylvia Russell1,59434.1-5.9
Labour Jackie Jackson60012.8+2.7
TUSC Sean Brogan2054.4N/A
Majority
Turnout 39.6
Liberal Democrats gain from Conservative

Torridge

[10]

Bideford East
PartyCandidateVotes%±%
Conservative Linda Hellyer 1,450 44.4 +14.5
Labour Annie Brenton58517.9-2.0
Green Will Douglas-Mann36811.3+5.3
Independent James Craigie3049.3N/A
Independent Jude Gubb2989.1N/A
Liberal Democrats Stephen Potts2266.9-3.0
Majority86526.5
Turnout 3,26732.2
Conservative hold
Bideford West and Hartland
PartyCandidateVotes%±%
Conservative Jeffrey Wilton-Love 1,003 34.3 -8.1
Independent Tony Inch46515.9-26.5
Labour Dylan Billson40513.9-3.7
Green Keith Funnell2809.6N/A
Independent Joel Herron2659.1N/A
Independent Robin Julian2247.7-12.7
Liberal Democrats Bert Bruins2167.4-11.9
Freedom AlliancePaul Jelf501.7N/A
Majority53818.5
Turnout 2,92132.5
Conservative hold
Holsworthy Rural
PartyCandidateVotes%±%
Conservative James Morrish 2,927 58.7 -8.5
Independent Pete Watson87317.5N/A
Green Cathrine Simmons4258.5N/A
Labour Jim Lowe3988.0-1.3
Liberal Democrats Claire Davey-Potts3286.6-5.5
Majority2,05441.2
Turnout 4,98839.7
Conservative hold
Northam
PartyCandidateVotes%±%
Conservative Dermot McGeough 1,586 36.5 -17.1
Independent Leonard Ford1,03423.8N/A
Liberal Democrats David Chalmers97122.4+13.7
Labour Jake McLean3909.0-2.5
Green Simon Mathers3307.6-0.8
Majority55212.7
Turnout 4,34342.8
Conservative hold
Torrington Rural
PartyCandidateVotes%±%
Conservative Andrew Saywell 2,518 54.9 +14.5
Liberal Democrats Chris Bright99321.7+3.1
Labour Siobhan Strode59212.9-1.8
Green Ruth Funnell4549.9+4.3
Majority1,52533.2
Turnout 4,58540.1
Conservative hold

West Devon

[11]

Hatherleigh and Chagford
PartyCandidateVotes%±%
Conservative James McInnes 2,355 53.4 -9.2
Green Lynn Daniel1,14225.9+15.3
Liberal Democrats George Dexter45810.4-2.6
Labour Douglas Smith3307.5-1.7
Reform UK Matt Morton892.0N/A
Majority
Turnout 41.9
Conservative hold
Okehampton Rural
PartyCandidateVotes%±%
Conservative Lois Samuel 1,942 45.8 -3.4
Independent Tony Leech94822.4+5.2
Green Brian Wood55213.0+6.9
Labour Terry Edwards42410.0-3.2
Liberal Democrats Patrick Gilbert2355.5-3.9
Reform UK Bob Rush902.1N/A
Majority
Turnout 36.4
Conservative hold
Tavistock
PartyCandidateVotes%±%
Conservative Debo Sellis 1,847 43.6 -5.6
Independent Mandy Ewings1,08525.6N/A
Liberal Democrats Pete Squire46411.4+3.8
Labour Mike Sparling44210.0+3.6
Green Chris Jordan3648.6+2.7
Majority
Turnout 41.8
Conservative hold
Yelverton Rural
PartyCandidateVotes%±%
Conservative Philip Sanders 2,263 45.0 0.0
Independent Mark Renders1,12322.3N/A
Green Judy Maciejowska73714.7+4.0
Labour Tony Marchese59811.9+5.0
Liberal Democrats Ashley-Ross West2725.4-3.8
Majority
Turnout 43.7
Conservative hold

Aftermath

Related Research Articles

<span class="mw-page-title-main">East Devon (UK Parliament constituency)</span> UK Parliament constituency since 1997

East Devon is a constituency represented in the House of Commons of the UK Parliament since 2019 by Simon Jupp of the Conservative Party.

<span class="mw-page-title-main">Exeter (UK Parliament constituency)</span> UK Parliament constituency since 1295

Exeter is a constituency composed of the cathedral city and county town of Devon represented in the House of Commons of the UK Parliament. The constituency has had a history of representatives from 1900 of Conservative, Liberal Party, Independent and Labour representation.
<span class="mw-page-title-main">Tiverton and Honiton (UK Parliament constituency)</span>

Tiverton and Honiton is a constituency in Devon, England. The current MP is Richard Foord of the Liberal Democrats, elected at a by-election on 23 June 2022.
<span class="mw-page-title-main">South West England (European Parliament constituency)</span> Constituency of the European Parliament

South West was a combined constituency region of the European Parliament, comprising the South West of England and Gibraltar. Seven, later six, Members of the European Parliament using closed party-list proportional representation allocated using the D'Hondt method of distribution were elected. The constituency was abolished when Britain left the European Union on 31 January 2020.

The East Riding of Yorkshire is a unitary authority in the ceremonial county of the East Riding of Yorkshire, England. It was created on 1 April 1996 replacing East Yorkshire, East Yorkshire Borough of Beverley, Holderness, part of Boothferry and Humberside County Council.

<span class="mw-page-title-main">Central Devon (UK Parliament constituency)</span> UK Parliament constituency since 2010

Central Devon is a constituency represented in the House of Commons of the UK Parliament since 2010 by Mel Stride, a Conservative.

<span class="mw-page-title-main">Newton Abbot (UK Parliament constituency)</span> UK Parliament constituency

Newton Abbot is a constituency in Devon represented in the House of Commons of the UK Parliament since its 2010 creation by Anne Marie Morris, a Conservative.

<span class="mw-page-title-main">2010 Newham London Borough Council election</span> 2010 local election in England, UK

Elections to Newham London Borough Council in London, England was held on 6 May 2010. This was on the same day as other local elections and the general election to the UK Parliament.

<span class="mw-page-title-main">2013 Cambridgeshire County Council election</span>

An election to Cambridgeshire County Council took place on 2 May 2013 as part of the 2013 United Kingdom local elections. 69 councillors were elected from 60 electoral divisions, which returned either one or two county councillors each by first-past-the-post voting for a four-year term of office. The electoral divisions were the same as those used at the previous election in 2009. No elections were held in Peterborough, which is a unitary authority outside the area covered by the County Council. The election saw the Conservative Party lose overall control of the council.

<span class="mw-page-title-main">2014 Newham London Borough Council election</span> 2014 local election in England, UK

The 2014 Newham London Borough Council election took place on 22 May 2014 to elect members of Newham London Borough Council in England. This was on the same day as other local elections.

<span class="mw-page-title-main">2017 Cambridgeshire County Council election</span> 2017 UK local government election

The 2017 Cambridgeshire County Council election was held on 4 May 2017 as part of the 2017 local elections in the United Kingdom. All 61 councillors were elected from 59 electoral divisions, which returned either one or two county councillors each by first-past-the-post voting for a four-year term of office.

The United Kingdom's component of the 2019 European Parliament election was held on Thursday 23 May 2019 and the local results were to be announced after 22:00 BST on Sunday 26 May 2019 when all the other EU countries had voted although the counting of votes started at 18:00 BST on that evening. The nine English regions and Wales announced their regional results overnight. Local results were also announced overnight in all Scottish council areas with the single exception of Na h-Eileanan Siar, which did not count their votes until the following morning due to local opposition to counting on the Sabbath. Thus the Scottish national declaration did not take place until around lunchtime on Monday 27 May. Northern Ireland also did not start to count their votes until the Monday morning as votes are by tradition not counted here on Sunday either, as a religious observance. Furthermore, due to the use of the single transferable vote (STV), it was expected that counting could take up to two days, but in the event it was completed on 27 May.

Claire Wright is a British politician. She was a Devon county councillor from 2013 to 2021 and stood as an independent for East Devon in the 2015, 2017, and 2019 United Kingdom general elections, coming second each time.
<span class="mw-page-title-main">2021 Lancashire County Council election</span> Election in the United Kingdom

An election to Lancashire County Council took place on 6 May 2021, with counting on 8 May, as part of the 2021 United Kingdom local elections. All 84 councillors are elected from electoral divisions for a four-year term of office. The system of voting used is first-past-the-post. Elections are held in all electoral divisions across the present ceremonial county, excepting Blackpool and Blackburn with Darwen which are unitary authorities.
<span class="mw-page-title-main">2021 Liverpool City Council election</span>

The 2021 Liverpool City Council election took place on 6 May 2021 to elect members of Liverpool City Council, alongside other elections across the United Kingdom. One third of the council were up for election, as well as the Mayor of Liverpool, the Metro Mayor of Liverpool City Region and Police and Crime Commissioner Merseyside Police, all covering Liverpool.
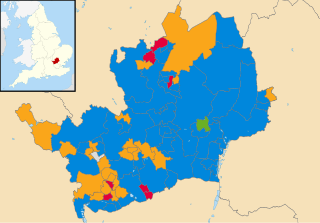
<span class="mw-page-title-main">2021 Hertfordshire County Council election</span> 2021 UK local government election

Elections to Hertfordshire County Council took place on 6 May 2021 alongside other local elections in the United Kingdom. All 78 seats to the council were elected.

The 2022 North Yorkshire Council election took place on 5 May 2022, alongside the other local elections. These were the last elections to North Yorkshire County Council, and the elected councillors would also serve as the first councillors on the North Yorkshire Council, which replaced the existing county council in April 2023.

<span class="mw-page-title-main">2021 Basingstoke and Deane Borough Council election</span> 2021 UK local government election

Elections to Basingstoke and Deane Borough Council took place on 6 May 2021 as part of the 2021 United Kingdom local elections. They took place at the same time as the elections for Hampshire County Council and the Hampshire Police and Crime Commissioner.

<span class="mw-page-title-main">Heritage Party (UK)</span> Political party in United Kingdom

The Heritage Party is a Eurosceptic, right-wing populist, and socially conservative fringe political party in the United Kingdom, founded in October 2020 when then-London Assembly Member David Kurten left the UK Independence Party (UKIP) to form the party. Kurten was also a member of the Brexit Alliance, a Eurosceptic technical group he formed in 2018 with fellow former UKIP member Peter Whittle.

<span class="mw-page-title-main">2022 Coventry City Council election</span> 2022 local election in Coventry

The 2022 Coventry City Council election took place on 5 May 2022. One third of councillors — 18 out of 54 — on Coventry City Council were elected. The election took place alongside other local elections across the United Kingdom.

References

  1. "Devon County Council | Services and information for Devon residents". Devon County Council. Retrieved 2 January 2021.
  2. "Election 2021 - the results". Devon County Council. Archived from the original on 5 May 2021.
  3. "Election Results".
  4. "East Devon District Council | Information Devon County Council Election". East Devon District Council. Archived from the original on 11 April 2021. Retrieved 11 April 2021.
  5. "Results - Exeter City Council". Archived from the original on 7 May 2021. Retrieved 7 May 2021.
  6. "Statement of Persons Nominated" (PDF). Mid Devon District Council.
  7. "Devon County Council full election 6 May 2021". North Devon District Council.
  8. "Statements of Persons Nominated". South Hams District Council. Archived from the original on 23 April 2021. Retrieved 23 April 2021.
  9. "STATEMENT OF PERSONS NOMINATED" (PDF). Teignbridge District Council.
  10. "May Elections 2021". Torridge District Council. Archived from the original on 23 April 2021. Retrieved 23 April 2021.
  11. "Statements of Persons Nominated". West Devon Borough Council. Archived from the original on 23 April 2021. Retrieved 23 April 2021.