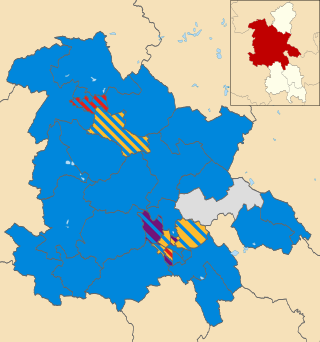
District result maps
 1979 results map
 1983 results map
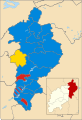 1987 results map
 1991 results map
 1995 results map
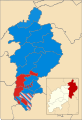 1999 results map
 2003 results map
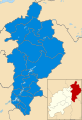 2007 results map
 2011 results map
East Northamptonshire District Council in Northamptonshire, England was elected every four years. After the last boundary changes in 2007, 40 councillors were elected from 22 wards. [1] The district was abolished in 2021, with the area becoming part of North Northamptonshire.
From the first election to the council in 1973 until its abolition in 2021, political control of the council was held by the following parties: [2]
| Party in control | Years | |
|---|---|---|
| Conservative | 1973–1995 | |
| Labour | 1995–1999 | |
| Conservative | 1999–2021 | |
The leaders of the council from 2009 until the council's abolition in 2021 were:
| Councillor | Party | From | To | |
|---|---|---|---|---|
| Andy Mercer | Conservative | Oct 2010 | ||
| Steven North [3] | Conservative | 4 Oct 2010 | 31 Mar 2021 | |
| Overall control | Conservative | Labour | Lib Dem [lower-alpha 1] | Independent | |||||
| 2015 | Conservative | 37 | 1 | - | 2 | ||||
| 2011 | Conservative | 35 | 2 | - | 3 | ||||
| 2007 | Conservative | 39 | - | - | 1 | ||||
| 2003 | Conservative | 33 | 3 | - | - | ||||
| 1999 | Conservative | 20 | 15 | - | 1 | ||||
| 1995 | Labour | 9 | 25 | 2 | - | ||||
| 1991 | Conservative | 23 | 9 | 3 | 1 | ||||
| 1987 | Conservative | 30 | 5 | 1 | - | ||||
| 1983 | Conservative | 30 | 6 | - | - | ||||
| 1979 | Conservative | 30 | 5 | - | 1 | ||||


| Party | Candidate | Votes | % | ±% | |
|---|---|---|---|---|---|
| Labour | 656 | 75.4 | |||
| Conservative | 214 | 24.6 | |||
| Majority | 442 | 50.8 | |||
| Turnout | 870 | 22.4 | |||
| Labour hold | Swing | ||||
| Party | Candidate | Votes | % | ±% | |
|---|---|---|---|---|---|
| Labour | 325 | 65.1 | |||
| Conservative | 174 | 34.9 | |||
| Majority | 151 | 30.2 | |||
| Turnout | 499 | ||||
| Labour hold | Swing | ||||
| Party | Candidate | Votes | % | ±% | |
|---|---|---|---|---|---|
| Labour | 365 | 43.3 | |||
| Conservative | 352 | 41.7 | |||
| Independent | 127 | 15.1 | |||
| Majority | 13 | 1.6 | |||
| Turnout | 844 | 18.5 | |||
| Labour hold | Swing | ||||
| Party | Candidate | Votes | % | ±% | |
|---|---|---|---|---|---|
| Labour | 712 | 67.0 | |||
| Conservative | 351 | 33.0 | |||
| Majority | 361 | 34.0 | |||
| Turnout | 1,063 | ||||
| Labour hold | Swing | ||||
| Party | Candidate | Votes | % | ±% | |
|---|---|---|---|---|---|
| Conservative | 525 | 55.7 | +15.2 | ||
| Labour | 418 | 44.3 | -15.2 | ||
| Majority | 107 | 11.4 | |||
| Turnout | 943 | 16.1 | |||
| Conservative gain from Labour | Swing | ||||
| Party | Candidate | Votes | % | ±% | |
|---|---|---|---|---|---|
| Conservative | 316 | 64.5 | -6.6 | ||
| Labour | 174 | 35.5 | +6.6 | ||
| Majority | 142 | 29.0 | |||
| Turnout | 490 | 37.9 | |||
| Conservative hold | Swing | ||||
| Party | Candidate | Votes | % | ±% | |
|---|---|---|---|---|---|
| Conservative | 366 | 83.9 | |||
| Labour | 70 | 16.1 | |||
| Majority | 296 | 67.8 | |||
| Turnout | 436 | ||||
| Conservative hold | Swing | ||||
| Party | Candidate | Votes | % | ±% | |
|---|---|---|---|---|---|
| Conservative | 379 | 67.7 | -3.4 | ||
| Labour | 181 | 32.3 | +3.4 | ||
| Majority | 198 | 35.4 | |||
| Turnout | 560 | ||||
| Conservative hold | Swing | ||||
| Party | Candidate | Votes | % | ±% | |
|---|---|---|---|---|---|
| Conservative | unopposed | ||||
| Conservative hold | Swing | ||||
| Party | Candidate | Votes | % | ±% | |
|---|---|---|---|---|---|
| Conservative | Sean Lever | 506 | 66.4 | +21.5 | |
| Labour | Stephen Allen | 256 | 33.6 | -2.9 | |
| Majority | 250 | 32.8 | |||
| Turnout | 762 | 15.8 | |||
| Conservative hold | Swing | ||||
| Party | Candidate | Votes | % | ±% | |
|---|---|---|---|---|---|
| Conservative | Pam Whiting | unopposed | |||
| Conservative hold | Swing | ||||
| Party | Candidate | Votes | % | ±% | |
|---|---|---|---|---|---|
| Conservative | Derek Capp | 412 | 64.1 | N/A | |
| Liberal Democrats | Karen Draycott | 130 | 20.2 | N/A | |
| Labour | Phil Garnham | 101 | 15.7 | N/A | |
| Majority | 282 | 43.9 | |||
| Turnout | 643 | ||||
| Conservative hold | Swing | ||||
| Party | Candidate | Votes | % | ±% | |
|---|---|---|---|---|---|
| Conservative | Jake Vowles | 1,003 | 52.4 | -13.7 | |
| Labour | Paul King | 681 | 35.6 | +1.7 | |
| Liberal Democrats | George Smid | 230 | 12.0 | +12.0 | |
| Majority | 322 | 16.8 | |||
| Turnout | 1,914 | ||||
| Conservative hold | Swing | ||||
| Party | Candidate | Votes | % | ±% | |
|---|---|---|---|---|---|
| Conservative | Alex Smith | 396 | 43.1 | -12.4 | |
| Independent | Valerie Carter | 210 | 22.9 | +22.9 | |
| Labour | Alex Izycky | 166 | 18.1 | +18.1 | |
| UKIP | Joseph Garner | 146 | 15.9 | +15.9 | |
| Majority | 186 | 20.3 | |||
| Turnout | 918 | ||||
| Conservative hold | Swing | ||||
| Party | Candidate | Votes | % | ±% | |
|---|---|---|---|---|---|
| Conservative | Annabel de Capell Brooke | 729 | 82.8 | +6.7 | |
| Labour | Alan Brookfield | 151 | 17.2 | +2.8 | |
| Majority | 578 | 65.6 | |||
| Turnout | 880 | ||||
| Conservative hold | Swing | ||||
| Party | Candidate | Votes | % | ±% | |
|---|---|---|---|---|---|
| Conservative | Harriet Pentland | 611 | 55.6 | N/A | |
| Liberal Democrats | Suzanna Austin | 244 | 22.2 | N/A | |
| Labour | Mark Smith | 189 | 17.2 | N/A | |
| Green | Simon Turner | 33 | 3.0 | N/A | |
| UKIP | Bill Cross | 22 | 2.0 | N/A | |
| Majority | 367 | 33.4 | |||
| Turnout | 1,099 | ||||
| Conservative hold | Swing | ||||
| Party | Candidate | Votes | % | ±% | |
|---|---|---|---|---|---|
| Conservative | Lee Wilkes | 542 | 53.1 | -2.3 | |
| Labour | Caroline Cross | 478 | 46.9 | +11.7 | |
| Majority | 64 | 6.3 | |||
| Turnout | 1,020 | ||||
| Conservative hold | Swing | ||||
| Party | Candidate | Votes | % | ±% | |
|---|---|---|---|---|---|
| Conservative | Bert Jackson | 1,379 | 63.3 | +16.1 | |
| Liberal Democrats | Suzanna Austin | 800 | 36.7 | +36.7 | |
| Majority | 579 | 26.6 | |||
| Turnout | 2,179 | ||||
| Conservative hold | Swing | ||||
| Party | Candidate | Votes | % | ±% | |
|---|---|---|---|---|---|
| Conservative | Peter Tomas | 1,531 | 62.6 | N/A | |
| Liberal Democrats | Simon Baylis | 913 | 37.4 | N/A | |
| Majority | 618 | 25.2 | |||
| Turnout | 2,444 | ||||
| Conservative hold | Swing | ||||
Kettering Borough Council was the local authority for the Borough of Kettering in Northamptonshire, England was elected every four years. The district was abolished in 2021, with the area becoming part of North Northamptonshire.
Rugby Borough Council elections are held three years out of every four, with a third of the council elected each time. Rugby Borough Council is the local authority for the non-metropolitan district of Rugby in Warwickshire, England. Since the last boundary changes in 2012, 42 councillors have been elected from 16 wards.
Dacorum Borough Council in Hertfordshire, England is elected every four years. Since the last boundary changes in 2007, 51 councillors have been elected from 25 wards.
One third of North Hertfordshire District Council in England is elected each year, followed by one year without election. A boundary review is underway to allow the council to instead be elected all at once every four years from 2024 onwards.
Cotswold District Council in Gloucestershire, England, is elected every four years.
Aylesbury Vale District Council was the council for the non-metropolitan district of Aylesbury Vale in Buckinghamshire, England, which existed as a local government area from 1974 to 2020. The council was elected every four years from 1973 until 2020. At the time of its abolition, the council had 59 councillors, elected from 33 wards.
Chichester District Council in West Sussex, England is elected every four years. Since the last boundary changes in 2019, 36 councillors have been elected from 21 wards.
Corby Borough Council was elected every four years. The council was abolished in 2021, with the area becoming part of North Northamptonshire.

West Lancashire Borough Council elections are generally held three years out of every four, with a third of the council elected each time. West Lancashire Borough Council is the local authority for the non-metropolitan district of West Lancashire in Lancashire, England. Since the last boundary changes in 2023 the council has comprised 45 councillors representing 15 wards, with each ward electing three councillors.
St Edmundsbury Borough Council in Suffolk, England, was elected every four years. After the last boundary changes in 2003, 45 councillors were elected from 31 wards. The council was abolished in 2019, with the area becoming part of West Suffolk.
South Oxfordshire District Council, a non-metropolitan district council in Oxfordshire, England is elected every four years.
The Borough Council of Wellingborough in Northamptonshire, UK was elected every four years. After the last boundary changes in 1999, thirty-six councillors were elected from 16 wards. The council was abolished in 2021, with the area becoming part of North Northamptonshire.
East Hampshire District Council elections are held every four years to elect councillors to East Hampshire District Council in Hampshire, England. Since the last boundary changes in 2019 the council has comprised 43 councillors representing 31 wards, with each ward electing one, two or three councillors.
Forest of Dean District Council is the local authority for the Forest of Dean in Gloucestershire, England. The council is elected every four years. Since the last boundary changes in 2019, 38 councillors are elected from 21 wards.
East Hertfordshire District Council is elected every four years.
Stroud District Council in Gloucestershire, England is elected every four years. The all-out elections every four years began in 2016; up to and including the 2015 election one third of the council was elected each year, followed by one year without election.
Three Rivers District Council elections are held three years out of four to elect members of Three Rivers District Council in Hertfordshire, England. Since the last boundary changes in 2014 the council has comprised 39 councillors representing 13 wards, each of which elects three councillors, one at each election such that a third of the council is elected each time. Elections to Hertfordshire County Council are held in the fourth year of the cycle when there are no district council elections.
South Northamptonshire District Council in Northamptonshire, England was elected every four years. After the last boundary changes in 2007, 42 councillors were elected from 27 wards. The council was abolished in 2021, with the area becoming part of West Northamptonshire.
Milton Keynes City Council is the local authority for the City of Milton Keynes, a unitary authority in Buckinghamshire, England. Until 1 April 1997 it was a non-metropolitan district.
Stoke-on-Trent City Council elections are held every four years. Stoke-on-Trent City Council is the local authority for the unitary authority of Stoke-on-Trent in the ceremonial county of Staffordshire, England. Since the last boundary changes in 2023, 44 councillors have been elected from 34 wards.