2017 Northamptonshire County Council election

Last updated

2017 Northamptonshire County Council election [1]
Flag of Northamptonshire.svg
  2013 4 May 20172021 

All 57 seats to Northamptonshire County Council
29 seats needed for a majority
 First partySecond party
 
Party Conservative Labour
Seats before3611
Seats won4312
Seat changeIncrease2.svg7Increase2.svg1
Popular vote90,81349,512
Percentage51.1%27.8%

 Third partyFourth party
 
Party Liberal Democrats UKIP
Seats before63
Seats won20
Seat changeDecrease2.svg4Decrease2.svg3
Popular vote21,77710,241
Percentage12.2%5.8%

Northamptonshire UK local election 2017 map.svg
Map showing the results of the 2017 Northamptonshire County Council elections.

Council control before election

Conservative

Council control after election

Conservative

The 2017 Northamptonshire County Council election took place on 4 May 2017 as part of the 2017 local elections in the United Kingdom. [2] All 57 councillors were elected from electoral divisions which return one county councillor each by first-past-the-post voting for a four-year term of office.

Contents

Results summary

Northamptonshire County Council election, 2017
PartySeatsGainsLossesNet gain/lossSeats %Votes %Votes+/−
  Conservative 4370+775.4451.390,727+14.5
  Labour 1232+121.0527.849,131+1.6
  Liberal Democrats 215-43.5112.221,667+3.5
  UKIP 003-305.59,789-17.2
  Green 0-2.03,457+0.5
  Independent 0-1.22,163-2.9

Results by Division

Corby

Corby Rural
PartyCandidateVotes%
Conservative Sandra Naden-Horley 1,611 52.12
Labour Bob Riley1,17137.88
Liberal Democrats Terri Meechan30910.0
Turnout 309138.32
Conservative hold
Corby West
PartyCandidateVotes%
Labour Julie Brookfield 1,854 56.96
Conservative Harriet Pentland1,10233.86
Green Steven Scrutton2106.45
Liberal Democrats Sidney Beecroft892.73
Turnout 325533.3
Labour hold
Kingswood
PartyCandidateVotes%
Labour John McGhee 1,755 67.47
Conservative Ollie Lewis60923.41
Green Michael Mahon1776.81
Liberal Democrats Garth Ratcliffe602.31
Turnout 260125.1
Labour hold
Lloyds
PartyCandidateVotes%
Labour Bob Scott 2,157 67.79
Conservative Miranda Harrison91428.72
Liberal Democrats Judith Brown1113.49
Turnout 318230.19
Labour hold
Oakley
PartyCandidateVotes%
Liberal Democrats Chris Stanbra 948 32.51
Labour Mary Butcher91131.24
Conservative James Collier89930.83
UKIP Keith Hudson1585.42
Turnout 291629.41
Liberal Democrats gain from Labour

Daventry

Braunston & Crick
PartyCandidateVotes%±%
Conservative Malcolm Longley 1,876 50.15 16.12
Liberal Democrats Andrew Simpson111229.7225.07
Labour Ken Ritchie 75320.13-9.72
Turnout 374138.72
Brixworth
PartyCandidateVotes%±%
Conservative Cecile Irving-Swift 2,345 65.19 14.16
Labour Stuart Coe51514.321.1
Liberal Democrats Kathryn Purchase36410.126.09
UKIP Pamela Booker2166.01-1.90
Green James McKay-Mount1574.36-2.31
Turnout 359739.33
Daventry East
PartyCandidateVotes%±%
Conservative Amy Howard 1,411 61.78 18.2
Labour Andrew Dabbs71431.265.48
Liberal Democrats John Butlin1596.966.96
Turnout 228430.3
Daventry West
PartyCandidateVotes%±%
Conservative Richard Auger 1,042 39.89 7.80
Labour Wendy Randall101238.747.86
UKIP Gary Denby35313.51-20.38
Liberal Democrats Alan Knape2057.854.74
Turnout 261228.75
Conservative gain from UKIP Swing
Long Buckby
PartyCandidateVotes%±%
Conservative Steve Osborne 2,128 57.64 11.62
Labour Chris Myers77921.103.32
Liberal Democrats Mike Cobbe53414.465.95
Green Tom Harper2516.806.80
Turnout 369243.91
Moulton
PartyCandidateVotes%±%
Conservative Judy Shephard 2,272 68.64 22.51
Labour Caleb Mendonca33910.24-4.68
Liberal Democrats Rupert Knowles2908.764.62
Green Kevin White2286.896.89
UKIP Ian Dexter1815.47-26.95
Turnout 331036.43
Woodford & Weedon
PartyCandidateVotes%±%
Conservative Robin Brown 2,080 67.44 18.13
Labour Callum Batchelor58619.004.34
Liberal Democrats Simon Lytton41813.555.86
Turnout 308434.55

East Northamptonshire

Higham Ferrers
PartyCandidateVotes%
Conservative Glenn Harwood 1,762 60.12
Labour Julie Sturgess55218.83
Liberal Democrats Suzanna Austin32711.16
UKIP David Hamblin2909.89
Turnout 293131.16
Irthlingborough
PartyCandidateVotes%
Conservative Sylvia Hughes 1,748 50.24
Labour Caroline Cross79622.88
Independent Marika Hillson76021.85
Liberal Democrats Robin Denton1755.03
Turnout 347935.15
Oundle
PartyCandidateVotes%
Conservative Heather Smith 2,608 65.46
Labour Leonie McCarthy95624.00
Liberal Democrats George Smid42010.54
Turnout 398441.08
Raunds
PartyCandidateVotes%
Conservative Dudley Hughes 1,747 60.12
Labour Neil Harvey56219.34
Liberal Democrats Will Cheung35312.15
Turnout 290634.48
Rushden Pemberton West
PartyCandidateVotes%
Conservative Michael Tye 1,888 63.72
Labour Dave Shuttle61920.89
UKIP David Shephard2709.11
Liberal Democrats David Hooton1866.28
Turnout 296331.35
Rushden South
PartyCandidateVotes%
Conservative Andy Mercer 1,907 62.22
Labour Stephen Allen62620.42
UKIP James Beil2959.62
Liberal Democrats Daniel Jones2377.73
Turnout 306527.52
Thrapston
PartyCandidateVotes%
Conservative Wendy Brackenbury 2,651 66.79
Labour Caroline Smith65316.45
Liberal Democrats Tristan Denton3438.64
UKIP Joseph Garner2075.22
Independent John Smoker1152.90
Turnout 396937.97

Kettering

Burton & Broughton
PartyCandidateVotes%
Conservative Chris Smith-Haynes 994 35.37
Independent Christopher Groome71725.52
Labour Samuel Nicholls42315.05
UKIP Sam Watts36713.06
Liberal Democrats Jenny Davies2418.58
Green April Wright682.42
Turnout 281030.83
Clover Hill
PartyCandidateVotes%
Conservative Bill Parker 1,622 56.07
Labour Jonathan West70524.37
Green Kirsty Berry2568.85
UKIP Louisa Murphy1826.29
Liberal Democrats Mel Gosliga1284.42
Turnout 289333.38
Croyland & Swanspool
PartyCandidateVotes%
Conservative Graham Lawman 1,311 52.00
Labour Cari Spokes76530.35
UKIP Terry Spencer2248.89
Liberal Democrats Chris Nelson1254.96
Green Simon Turner963.81
Turnout 252126.09
Desborough
PartyCandidateVotes%
Conservative Allan Matthews 1,584 42.04
Labour Helen Wood1,37536.49
Liberal Democrats Philip Rice46212.26
UKIP Ian Clements3479.21
Turnout 376836.57
Ise
PartyCandidateVotes%
Conservative Victoria Perry 1,469 46.49
Labour David Padwick79425.13
UKIP Jonathan Bullock 62919.91
Liberal Democrats Thomasin James2688.48
Turnout 316039.06
Northall
PartyCandidateVotes%
Labour Mick Scrimshaw 1,261 42.88
Conservative Larry Henson1,23241.89
UKIP Stuart Farrant2327.89
Liberal Democrats Chris McGlynn2167.34
Turnout 294130.17
Rothwell & Mawsley
PartyCandidateVotes%
Conservative James Hakewell 1,845 61.34
Labour Stephen King63521.11
Liberal Democrats Christopher Sheldrick2227.38
UKIP Melvyn Norman1805.98
Green Stevie Jones1264.19
Turnout 300832.49
Wicksteed
PartyCandidateVotes%
Conservative Scott Edwards 1,423 47.09
Labour Maggie Don86928.76
Liberal Democrats David Phelan42814.16
UKIP Jehad Soliman1866.15
Green Jamie Wildman1163.84
Turnout 302232.15
Windmill
PartyCandidateVotes%
Labour Eileen Hales 869 37.59
Conservative Ollie Wyeth84836.68
UKIP John Raffill36015.57
Green James Dell1295.58
Liberal Democrats Sabir Jones1064.58
Turnout 231227.1

Northampton

Abington & Phippsville
PartyCandidateVotes%±%
Labour Danielle Stone 1,499 48.95
Conservative Anna King85627.96
Liberal Democrats Sharon Sawyer2839.24
UKIP Thomas Rich2718.85
Green Marcus Rock1535.00
Turnout 306233.52
Boothville & Parklands
PartyCandidateVotes%±%
Conservative Mike Hallam 2,045 64.31
Labour Chris Fitchett61819.43
Liberal Democrats David Garlick2919.15
UKIP Martin Derosario2267.11
Turnout 318036.15
Castle
PartyCandidateVotes%±%
Labour Winston Strachan 1,507 65.15 +25.66
Conservative James Hill54423.52+8.67
Liberal Democrats Tony Woods26211.33+2.95
Turnout 204121.1
Dallington Spencer
PartyCandidateVotes%±%
Labour Gareth Eales 1,529 65.54 +19.43
Conservative Paul Clark54923.53+5.27
Liberal Democrats Celia Burge1355.79-18.52
Green Paul Powerville1205.14
Turnout 233328.38
Delapre & Rushmere
PartyCandidateVotes%±%
Labour Julie Davenport 1,004 36.23 +8.14
Conservative Graham Walker81329.34+4.28
Liberal Democrats Brendan Glynane69024.90-9.5
UKIP Philip Copson1615.81+5.81
Independent Norman Adams1033.72+3.72
Turnout 277132.46
Labour gain from Liberal Democrats Swing
Duston East
PartyCandidateVotes%±%
Conservative Suresh Patel 1,381 47.57 +8.67
Labour Dale Willis92631.90+13.03
Independent Dave Green46816.12-14.17
Liberal Democrats Rona Meredith1284.41+0.7
Turnout 290331.21
Duston West & St Crispin
PartyCandidateVotes%±%
Conservative Matthew Golby 1,539 60.83 -0.96
Labour Alan Kingston53521.15-4.16
UKIP Mark Unwin1766.96+6.96
Liberal Democrats Julia Maddison1686.64-6.25
Green Scott Mabbutt1124.43+4.43
Turnout 190827.48
East Hunsbury & Shelfleys
PartyCandidateVotes%±%
Conservative Andre Savage 1,801 59.62 +18.47
Labour Bob Burnell55718.44+1.12
Liberal Democrats Irene Markham2658.77+2.48
UKIP Mark Davis2588.54-19.71
Green Damon Boughen1404.63
Turnout 302133.13
Headlands
PartyCandidateVotes%±%
Labour Arthur McCutcheon 1,237 35.07 +5.56
Conservative Samuel Shaw105029.77+5.14
Liberal Democrats Martin Sawyer84123.84+11.62
UKIP Colin Bircher39911.31-15.63
Turnout 352736.09
Kingsthorpe North
PartyCandidateVotes%±%
Conservative Sam Rumens 1,488 43.26 +12.5
UKIP Thomas Appleyard67519.62-14.19
Labour Muna Cali60217.50-4.92
Liberal Democrats Wayne Casey41111.95+2.09
Green Steve Miller2647.67+7.67
Turnout 344035.95
Conservative gain from UKIP Swing
Kingsthorpe South
PartyCandidateVotes%±%
Labour Jane Birch 917 34.58 +8.08
Conservative Arthur Newbury75028.28+15.85
Liberal Democrats Brian Hoare70626.62-10.00
UKIP John Howsam27910.52-10.06
Turnout 2652
Labour gain from Liberal Democrats Swing
Nene Valley
PartyCandidateVotes%±%
Conservative Lizzy Bowen 1,740 58.88 +21.37
Labour Jani Nikesh58519.80+3.61
Liberal Democrats Paul Schofield31610.69+6.5
UKIP Rose Gibbins31410.63-13.67
Turnout 295534.32
Riverside Park
PartyCandidateVotes%±%
Conservative Stephen Legg 1,925 55.13 +14.18
Labour Mohammed Miah73621.08-4.76
Liberal Democrats Alastair Thomson51414.72+8.32
UKIP Ian Gibbins3179.08
Turnout 3492
Sixfields
PartyCandidateVotes%±%
Conservative Pinder Chauhan 1,162 35.89 +0.77
Liberal Democrats Jill Hope89927.76-9.61
Labour Terri Eales80824.95-2.57
UKIP Simon Lamb2357.26+7.26
Green Denise Donaldson1344.14
Turnout 323830.66
Conservative gain from Liberal Democrats Swing
St George
PartyCandidateVotes%±%
Labour Rachel Cooley 999 40.30 +12.97
Liberal Democrats Sarah Uldall74129.89-1.52
Conservative Pauline Woodhouse55422.35+8.75
UKIP Beverley Mennell1857.46-15.04
Turnout 247929.51
Labour gain from Liberal Democrats Swing
Talavera
PartyCandidateVotes%±%
Liberal Democrats Dennis Meredith 1,112 41.08 +2.2
Labour Janice Duffy85731.66+1.04
Conservative Paul Dyball49018.10+8.38
UKIP John Allen2489.16
Turnout 270728.57

South Northamptonshire

Brackley
PartyCandidateVotes%±%
Conservative Fiona Baker 2,103 65.53 +29.15
Labour Sophie Johnson53216.58+0.45
Liberal Democrats Mark Hedges42113.12+4.29
UKIP Nigel Wickens1534.77-33.93
Turnout 320931.95
Conservative gain from UKIP Swing
Bugbrooke
PartyCandidateVotes%±%
Conservative Adam Brown 2,760 69.36 +20.45
Labour Shirley Waterhouse56514.20+0.68
Green Andy Clarke3468.70+8.70
Liberal Democrats Susan Morton3087.74+2.18
Turnout 397940.53
Deanshanger
PartyCandidateVotes%±%
Conservative Allen Walker 2,178 67.94 +4.89
Labour Dave Tedford61719.25-5.52
Liberal Democrats Ruth Campbell41112.82+0.62
Turnout 320635.95
Hackleton & Grange Park
PartyCandidateVotes%±%
Conservative Michael Clarke 2,397 74.00 +31.70
Labour Maggie McCutcheon45414.02+1.79
Liberal Democrats Katherine Chapanionek38811.98+7.49
Turnout 323934.83
Middleton Cheney
PartyCandidateVotes%±%
Conservative Rebecca Breese 2,258 66.06 +23.29
Labour Richard Solesbury-Timms64718.93+5.82
Liberal Democrats Mark Allen51315.01+6.24
Turnout 341839.16
Silverstone
PartyCandidateVotes%±%
Conservative Ian Morris 2,766 71.34 +23.05
Liberal Democrats Anna Mills65216.82+8.58
Labour Adrian Scandrett45911.84-3.34
Turnout 387741.59
Towcester & Roade
PartyCandidateVotes%±%
Conservative Adil Sadygov 1,676 46.07 +17.74
Liberal Democrats Joe Jackson140138.51+2.92
Labour Dan Lane56115.42+3.58
Turnout 363838.41
Conservative gain from Liberal Democrats Swing

Wellingborough

Brickhill & Queensway
PartyCandidateVotes%±%
Conservative Jonathan Ekins 1,356 48.53 +17.18
Labour Elizabeth Coombe97234.79+2.54
UKIP Allan Shipham2779.91-20.04
Green Ben Hornett1244.44+0.49
Liberal Democrats Alan Window652.33+2.33
Turnout 279429.71
Conservative gain from Labour Swing
Croyland & Swanspool
PartyCandidateVotes%±%
Conservative Grayham Lawman 1,311 52.00 +14.15
Labour Cari Spokes76530.35-1.61
UKIP Terry Spencer2248.89-15.33
Liberal Democrats Chris Nelson1254.95+4.96
Green Simon Turner963.81+3.81
Turnout 252126.09
Earls Barton
PartyCandidateVotes%±%
Conservative Rob Gough 2,749 70.02 +24.03
Labour Nick Chapman100725.65+4.76
Liberal Democrats Grant Bowles1704.33-0.43
Turnout 392638.73
Finedon
PartyCandidateVotes%±%
Conservative Gill Mercer 1,476 48.81 +14.81
Labour Steve Ayland105834.99+2.47
UKIP Bill Cross2598.56-21.34
Liberal Democrats John Weaver2317.64+4.04
Turnout 302429.68
Irchester
PartyCandidateVotes%±%
Conservative Martin Griffiths 2,020 63.24 +21.92
Labour Kevin Watts80025.05-10.78
UKIP Mark Gee2106.57-16.28
Liberal Democrats Norman Jones1645.13+5.13
Turnout 319436.74
Hatton Park
PartyCandidateVotes%±%
Conservative Malcolm Waters 2,062 59.72
Labour Tony Aslam77222.36
UKIP David Matuk2457.10
Liberal Democrats Stuart Simons2206.37
Green Jonathan Hornett1544.46
Turnout 345333.1

Related Research Articles

The wards and electoral divisions in the United Kingdom are electoral districts at sub-national level, represented by one or more councillors. The ward is the primary unit of English electoral geography for civil parishes and borough and district councils, the electoral ward is the unit used by Welsh principal councils, while the electoral division is the unit used by English county councils and some unitary authorities. Each ward/division has an average electorate of about 5,500 people, but ward population counts can vary substantially. As of 2021 there are 8,694 electoral wards/divisions in the UK. An average area of wards in the United Kingdom is 27 km2.

<span class="mw-page-title-main">2017 Lancashire County Council election</span> Election in the United Kingdom

An election to Lancashire County Council took place on 4 May 2017 as part of the 2017 local elections across the UK. All 84 councillors were elected for single-member and dual-member divisions for a four-year term of office. The system of voting used is first-past-the-post. Elections are held in all electoral divisions across the present ceremonial county, excepting Blackpool and Blackburn with Darwen which are unitary authorities.

<span class="mw-page-title-main">2017 United Kingdom local elections</span>

The 2017 United Kingdom local elections were held on Thursday 4 May 2017. Local elections were held across Great Britain, with elections to 35 English local authorities and all councils in Scotland and Wales.

<span class="mw-page-title-main">2017 Essex County Council election</span> 2017 UK local government election

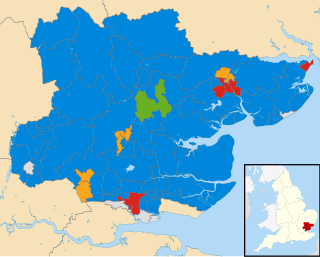
Elections to Essex County Council took place on 4 May 2017 as part of the 2017 local elections. All 75 councillors were elected from 70 electoral divisions, which each returned either one or two councillors by first-past-the-post voting for a four-year term of office.

<span class="mw-page-title-main">2017 Nottinghamshire County Council election</span> 2017 election of all 66 councillors to Nottinghamshire County Council

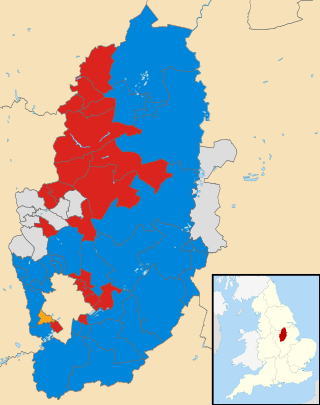
The 2017 Nottinghamshire County Council election took place on 4 May 2017 as part of the 2017 local elections in the United Kingdom. The whole council of 66 councillors was elected for a four-year term spanning 56 electoral divisions, a minority of which return two councillors. The voting system used is first-past-the-post.

<span class="mw-page-title-main">2017 Cumbria County Council election</span> 2017 UK local government election

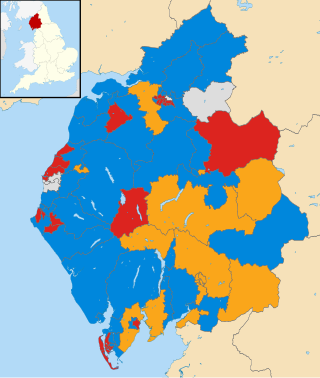
The 2017 Cumbria County Council election took place on 4 May 2017 as part of the 2017 local elections in the United Kingdom. All 84 councillors were elected from electoral divisions which return one county councillor each by first-past-the-post voting for a four-year term of office.

<span class="mw-page-title-main">2017 Derbyshire County Council election</span> 2017 UK local government election

An election to Derbyshire County Council took place on 4 May 2017 as part of the 2017 United Kingdom local elections. 64 councillors were elected from 61 electoral divisions which returned either one or two county councillors each by first-past-the-post voting for a four-year term of office. No elections were held in the City of Derby, which is a unitary authority outside the area covered by the County Council. The Conservative Party won back control of the council, taking thirty-seven of the authority's sixty-four seats.

<span class="mw-page-title-main">2017 Dorset County Council election</span> 2017 UK local government election

The 2017 Dorset County Council election took place on 4 May 2017 as part of the 2017 local elections in the United Kingdom. All 46 councillors were elected from 40 electoral divisions, which returned either one or two county councillors each by first-past-the-post voting for a four-year term of office.

<span class="mw-page-title-main">2017 Gloucestershire County Council election</span> 2017 UK local government election

The 2017 Gloucestershire County Council election took place on 4 May 2017 as part of the 2017 local elections in the United Kingdom. All 53 councillors were elected from electoral divisions which returned one county councillor each by first-past-the-post voting for a four-year term of office. Control of the council went from a Conservative Party minority to a majority administration.

<span class="mw-page-title-main">2017 Cambridgeshire County Council election</span> 2017 UK local government election

The 2017 Cambridgeshire County Council election was held on 4 May 2017 as part of the 2017 local elections in the United Kingdom. All 61 councillors were elected from 59 electoral divisions, which returned either one or two county councillors each by first-past-the-post voting for a four-year term of office.

<span class="mw-page-title-main">2017 Hertfordshire County Council election</span> 2017 UK local government election

The 2017 Hertfordshire County Council election took place on 4 May 2017 as part of the 2017 local elections in the United Kingdom. All 78 councillors were elected from electoral divisions which returned one county councillor each by first-past-the-post voting for a four-year term of office.

<span class="mw-page-title-main">2017 Lincolnshire County Council election</span> 2017 UK local government election

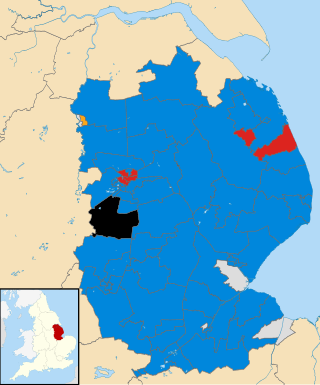
The 2017 Lincolnshire County Council election took place in non-metropolitan Lincolnshire on 4 May 2017 as part of the 2017 local elections in the United Kingdom. A total of 70 councillors were elected across the seven non-metropolitan districts that make up the administrative county of Lincolnshire from 70 single member electoral divisions by first-past-the-post voting for a four-year term of office. The election did not include North Lincolnshire and North East Lincolnshire as they are separate unitary authorities.

<span class="mw-page-title-main">2017 Staffordshire County Council election</span> 2017 UK local government election

The 2017 Staffordshire County Council election took place on 4 May 2017 as part of 2017 local elections in the UK. All 62 councillors were elected from electoral divisions for a four-year term of office. The system used is first-past-the-post voting.

<span class="mw-page-title-main">2017 Warwickshire County Council election</span> 2017 UK local government election

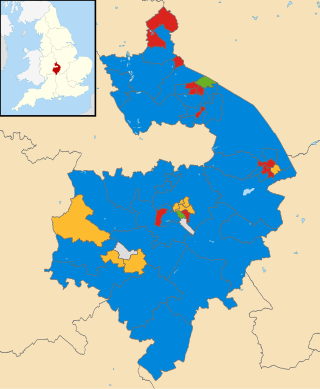
The 2017 Warwickshire County Council election took place as part of the 2017 local elections in the UK. All 57 councillors were elected for single-member electoral divisions for a four-year term. The voting system used was first-past-the-post.

<span class="mw-page-title-main">2017 West Sussex County Council election</span> 2017 UK local government election

The 2017 West Sussex County Council election took place as part of the 2017 local elections in the UK. All councillors were elected for single-member electoral divisions for a four-year term. The voting system used was first-past-the-post.

<span class="mw-page-title-main">2017 Cornwall Council election</span>

The 2017 Cornwall Council election was held on 4 May 2017 as part of the 2017 local elections in the United Kingdom. 122 councillors were elected from the 121 electoral divisions of Cornwall Council, which returned either one or two councillors each by first-past-the-post voting for a four-year term of office. Although originally scheduled to take place on the same day, the election in the Bodmin St Petroc ward was countermanded following the death of Liberal Democrat candidate Steve Rogerson and was held on 8 June.

<span class="mw-page-title-main">2019 United Kingdom local elections</span> Elections to local councils and mayoralties

The 2019 United Kingdom local elections took place on Thursday 2 May 2019, with 248 English local councils, six directly elected mayors in England, and all 11 local councils in Northern Ireland being contested.

<span class="mw-page-title-main">2021 Nottinghamshire County Council election</span> 2021 election of all 66 councillors to Nottinghamshire County Council

The 2021 Nottinghamshire County Council election took place on 6 May 2021 as part of the 2021 local elections in the United Kingdom. All 66 councillors were elected from 56 electoral divisions, which returned either one or two county councillors each by first-past-the-post voting for a four-year term of office.

<span class="mw-page-title-main">2022 Welsh local elections</span>

The 2022 Welsh local elections took place on 5 May 2022 to elect members of all twenty-two local authorities in Wales. They were held alongside other local elections in the United Kingdom. The previous elections were held in 2017.

<span class="mw-page-title-main">2022 Denbighshire County Council election</span> Welsh local election

The 2022 election to Denbighshire County Council took place on 5 May 2022 as part of the 2022 Welsh local elections. The previous elections took place in May 2017 and the next are scheduled to happen in 2027

References

  1. "Local Election Summaries 2017". The Elections Centre. Retrieved 24 June 2019.
  2. "Upcoming elections & referendums". Electoral Commission. Archived from the original on 5 May 2018. Retrieved 15 September 2016.