2017 Somerset County Council election

Last updated

2017 Somerset County Council election
Somerset Flag.svg
  2013 4 May 2017 2022  

All 55 seats to Somerset County Council
28 seats needed for a majority
 First partySecond partyThird party
 
Con
LD
Lab
Party Conservative Liberal Democrats Labour
Last election29 seats, 35.0%18 seats, 26.1%3 seats, 11.8%
Seats won35123
Seat changeIncrease2.svg 6Decrease2.svg 6Steady2.svg
Popular vote78,10752,14515,453
Percentage47.0%31.4%9.3%
SwingIncrease2.svg 12.0%Increase2.svg 5.3%Decrease2.svg 2.5%

 Fourth partyFifth party
 
Ind
Grn
Party Independent Green
Last election2 seats, 2.9%0 seats, 4.3%
Seats won32
Seat changeIncrease2.svg 1Increase2.svg 2
Popular vote7,8147,822
Percentage4.7%4.7%
SwingIncrease2.svg 1.8%Increase2.svg 0.4%

2017 Somerset County Council Election Results Map.svg
2017 Somerset County Council Election Results Map

Council control before election

Conservative

Council control after election

Conservative

The 2017 Somerset County Council election took place on 4 May 2017 as part of the 2017 local elections in the United Kingdom. [1] All 55 councilors were elected from 54 electoral divisions, which each returned either one or two county councilors by first-past-the-post voting for a four-year term of office.

Contents

Results summary

Somerset County Council election, 2017
PartySeatsGainsLossesNet gain/lossSeats %Votes %Votes+/−
  Conservative 3593+663.647.078,107+12.0
  Liberal Democrats 12511–621.831.452,145+5.3
  Labour 30010.99.315,453–2.5
  Independent 310+110.94.77,814+1.8
  Green 220+23.64.77,822+0.4
  UKIP 003–30.02.94,747–17.0
  Liberal 0000.00.076+0.0

Results by division

Bishops Hull & Taunton West

Bishops Hull & Taunton West [2]
PartyCandidateVotes%±%
Independent John Hunt 1,147 35.4 N/A
Liberal Democrats Simon Nicholls97630.1–5.0
Conservative Jason Wayne Woollacott84126.0–7.0
Labour Charlie Grabham1956.0–1.6
Green Julian McLeod Mellor802.5-2.8
Majority1715.3N/A
Turnout 3,23943.3+6.3
Registered electors 7,473
Independent gain from Liberal Democrats Swing

Blackdown & Neroche

Blackdown & Neroche [3]
PartyCandidateVotes%±%
Conservative John Bryan Thorne 1,556 47.3 +13.2
Liberal Democrats Ross Henley *1,41443.0+7.2
Labour Madeleine Spears1895.7–0.6
Green Roy Snelling1324.0–0.2
Majority1424.3N/A
Turnout 3,29140.0+3.0
Registered electors 8,220
Conservative gain from Liberal Democrats Swing

Blackmoor Vale

Blackmoor Vale [4]
PartyCandidateVotes%±%
Conservative William Wallace * 1,905 63.1 +11.1
Liberal Democrats Sarah Joanne Dyke 75224.9+9.7
Green Oliver Hugh Arnold Dowding1886.2N/A
Labour Michael Andrew Yianni1735.7–2.6
Majority1,15338.2+10.7
Turnout 3,01843.0+6.0
Registered electors 7,025
Conservative hold Swing

Brent

Brent [5]
PartyCandidateVotes%±%
Conservative Bob Filmer 1,917 67.8 +2.5
Liberal Democrats Tony Gore53719.0–1.0
Labour Janty Marsden2167.6–7.1
UKIP David Robert Willis1595.6N/A
Majority1,38048.8+3.5
Turnout 2,82936.4+5.4
Registered electors 7,767
Conservative hold Swing

Bridgwater East & Bawdrip

Bridgwater East & Bawdrip [6]
PartyCandidateVotes%±%
Conservative David Hall * 1,337 55.2 +18.1
Labour Diogo Rodrigues66227.3+1.8
Liberal Democrats Mike Senior42517.5+11.7
Majority67527.8+22.3
Turnout 2,42428.3+4.3
Registered electors 8,557
Conservative hold Swing

Bridgwater North & Central

Bridgwater North & Central [7]
PartyCandidateVotes%±%
Labour Dave Loveridge * 593 45.7 –18.2
Conservative Pele Barnes51039.3+16.7
Liberal Democrats Antony Nickolls19615.1+1.6
Majority836.4–35.0
Turnout 1,29920.8+4.8
Registered electors 6,905
Labour hold Swing

Bridgwater South

Bridgwater South [8]
PartyCandidateVotes%±%
Labour Leigh Redman * 954 51.0 –11.7
Conservative Lance Duddridge72738.8+1.5
Liberal Democrats Daniel Alexander Kelly19110.2N/A
Majority22712.1–13.3
Turnout 1,87224.0+4.0
Registered electors 7,795
Labour hold Swing

Bridgwater West

Bridgwater West [9]
PartyCandidateVotes%±%
Conservative Ann Bown * 1,289 59.0 +20.4
Labour Tony Heywood60627.8+2.8
Liberal Democrats Michelle Denise Phillips28813.2+6.0
Majority68331.3–21.9
Turnout 2,18327.9+3.9
Registered electors 7,837
Conservative hold Swing

Brympton

Brympton [10]
PartyCandidateVotes%±%
Conservative Josh Williams 1,021 47.3 +19.2
Liberal Democrats Sam Crabb *81937.9–1.4
Labour Dan Marks1285.9–1.9
UKIP Anthony Power1265.8–16.2
Green Kek Long663.1N/A
Majority2029.3N/A
Turnout 2,16033.2+3.2
Registered electors 6,501
Conservative gain from Liberal Democrats Swing

Burnham on Sea North

Burnham on Sea North [11]
PartyCandidateVotes%±%
Conservative Peter Burridge-Clayton * 1,485 47.5 –2.8
Liberal Democrats Mike Murphy1,18337.9+10.5
UKIP Brian Royston Hobbs2788.9N/A
Labour Colin Michael Price1785.7–7.0
Majority3029.7–13.2
Turnout 3,12438.7+5.7
Registered electors 8,079
Conservative hold Swing

Cannington

Cannington [12]
PartyCandidateVotes%±%
Conservative Mike Caswell 1,737 63.6 +2.8
Liberal Democrats Jill Dillamore62022.7+2.6
Labour Philip St Lawrence King37413.7–5.4
Majority1,11740.9+0.2
Turnout 2,73137.1+4.1
Registered electors 7,353
Conservative hold Swing

Castle Cary

Castle Cary [13]
PartyCandidateVotes%±%
Conservative Mike Lewis * 2,062 60.5 +16.8
Liberal Democrats Henry Hobhouse1,19235.0+0.8
Labour Sean Adam Dromgoole1534.5+0.4
Majority87025.5+16.0
Turnout 3,40744.9–1.1
Registered electors 7,587
Conservative hold Swing

Chard North

Chard North [14]
PartyCandidateVotes%±%
Liberal Democrats Amanda Jane Broom 1,445 46.4 +21.1
Conservative Martin John Wale1,28641.3+11.5
UKIP Nigel Charles Pearson *2528.1–25.3
Labour John Wardman Schofield1324.2–3.3
Majority1595.1N/A
Turnout 3,11539.7+2.7
Registered electors 7,846
Liberal Democrats gain from UKIP Swing

Chard South

Chard South [15]
PartyCandidateVotes%±%
Conservative Gemma Trudy Verdon 756 31.6 +8.8
Independent Dave Bulmer65927.5N/A
Liberal Democrats Jason Paul Baker60325.2–13.0
UKIP Peter Martin Heather2179.1–19.9
Labour Melissa Louise Whittaker-Mather1616.7+1.0
Majority974.0N/A
Turnout 2,39636.6+4.6
Registered electors 6,541
Conservative gain from Liberal Democrats Swing

Cheddar

Cheddar [16]
PartyCandidateVotes%±%
Conservative Nigel Philip Taylor 1,395 50.4 +11.2
Liberal Democrats Tim Shaban94534.1+15.1
Labour Norma Scanion2509.0–6.6
UKIP Helen Dorothy Hims1786.4–19.8
Majority45016.3+3.2
Turnout 2,76838.3+6.3
Registered electors 7,225
Conservative hold Swing

Coker

Coker [17]
PartyCandidateVotes%±%
Conservative Mark Alexander Keating 1,885 52.2 +14.4
Liberal Democrats Mick Clark1,40638.9+7.6
Green Peter Bysouth1845.1+0.3
Labour Jane Elizabeth Carter-Uren1353.7–2.0
Majority47913.3+6.8
Turnout 3,61048.9+3.9
Registered electors 7,473
Conservative hold Swing

Comeytrowe & Trull

Comeytrowe & Trull [18]
PartyCandidateVotes%±%
Liberal Democrats Alan Wedderkopp * 1,790 47.5 +7.6
Conservative Andy Sully1,49639.7+8.7
Labour Liam David Canham2195.8–0.7
Green Cathy Parmenter1323.5–0.2
UKIP Bill Lukins1283.4–16.3
Majority2947.8–1.1
Turnout 3,76547.8+1.8
Registered electors 7,873
Liberal Democrats hold Swing

Crewkerne

Crewkerne [19]
PartyCandidateVotes%±%
Liberal Democrats Mike Best 1,364 43.9 –2.1
Conservative Marcus Morton Barratt1,29441.7+16.9
Labour Gary David Swain2768.9+4.2
UKIP Arthur Sidney Hamlin1725.5–14.2
Majority702.3–18.9
Turnout 3,10644.1+3.1
Registered electors 7,045
Liberal Democrats hold Swing

Curry Rivel & Langport

Curry Rivel & Langport [20]
PartyCandidateVotes%±%
Conservative Clare Aparicio Paul 1,801 47.2 +5.0
Independent Andrew Lee93024.4N/A
Liberal Democrats Julia Mary Frances Gadd62316.3–12.2
Labour Stephen Peter Tilley1734.5+1.1
Green Stephen Peter Tate1574.1–5.0
UKIP Barbara Mary Jell1303.413.4
Majority87122.8+9.1
Turnout 3,81445.3+1.3
Registered electors 8,416
Conservative hold Swing

Dulverton & Exmoor

Dulverton & Exmoor [21]
PartyCandidateVotes%±%
Conservative Frances Mary Nicholson * 2,234 75.4 +11.6
Liberal Democrats Peter Charles Pilkington39413.2N/A
Labour Graham Robert Kennedy1916.4–4.9
UKIP Ivor Dennis Jones1465.0–19.9
Majority1,84062.1+23.2
Turnout 2,96345.9+6.9
Registered electors 6,450
Conservative hold Swing

Dunster

Dunster [22]
PartyCandidateVotes%±%
Conservative Christine Mary Lawrence * 1,470 53.1 +12.7
Liberal Democrats James Damian Tudor Wall73226.4+17.5
Labour Lesley Culverhouse30010.8–3.4
UKIP Adrian Behan1475.3–23.1
Green Paul Donald Dennett1204.3–3.8
Majority73826.7+14.7
Turnout 2,76940.9+4.9
Registered electors 6,763
Conservative hold Swing

Frome East

Frome East [23]
PartyCandidateVotes%±%
Green Martin John Dimery 983 33.8 N/A
Conservative Eve Berry97933.6+8.8
Liberal Democrats Alvin John Horsfall *67823.3–12.3
Labour David Alan Oakensen2719.3–7.1
Majority40.1N/A
Turnout 2,91134.0+7.0
Registered electors 8,554
Green gain from Liberal Democrats Swing

Frome North

Frome North [24]
PartyCandidateVotes%±%
Conservative Linda Oliver * 1,551 51.5 +15.8
Liberal Democrats Adam Owen Matthew Boyden1,08536.0–1.3
Green Pepita Collins37512.5N/A
Majority46615.5N/A
Turnout 3,01142.0+3.0
Registered electors 7,175
Conservative gain from Liberal Democrats Swing

Frome West

Frome West [25]
PartyCandidateVotes%±%
Green John Clarke 987 35.4 N/A
Conservative Jo Beale80128.7+9.3
Liberal Democrats Damon John Hooton68024.4–17.8
Labour Theresa Mary Philomena Clark2438.7–10.0
Liberal Derek *762.7N/A
Majority1866.7N/A
Turnout 2,78734.6+5.6
Registered electors 8,064
Green gain from Liberal Democrats Swing

Derek (full name Derek Tanswell) was elected as a Liberal Democrat in 2013 [26]

Glastonbury & Street (2)

Glastonbury & Street (2 seats) [27]
PartyCandidateVotes%±%
Conservative Terry Napper * 2,573 43.8
Liberal Democrats Liz Leyshon 2,272 38.7
Liberal Democrats Nick Cottle2,03734.7
Conservative David Albert George Swain1,65028.1
Green Jon Cousins1,19620.4
Labour Emma Jane King69711.9
Labour Jane Ratcliffe5309.0
Independent Simon Michael Carswell4337.4N/A
UKIP Keith Anthony Hooper3586.1
Turnout 5,87337.1
Registered electors 15,813
Conservative hold Swing
Liberal Democrats hold Swing

Highbridge & Burnham South

Highbridge & Burnham South [28]
PartyCandidateVotes%±%
Conservative John Charles Woodman * 1,065 47.5 +10.4
Liberal Democrats John David Parkes76734.2+4.7
Labour Lucy Scanlon2139.5–7.3
UKIP Lorna Irene Bromley Corke1978.8N/A
Majority29813.3+5.8
Turnout 2,24229.7+2.7
Registered electors 7,557
Conservative hold Swing

Huntspill

Huntspill [29]
PartyCandidateVotes%±%
Conservative Mark Healey * 1,810 68.0 +24.5
Liberal Democrats Phil Harvey51319.3+8.6
Labour Chelsea Joan Chadwick33712.7–0.2
Majority1,29748.8+38.1
Turnout 2,66035.6+0.6
Registered electors 7,465
Conservative hold Swing

Ilminster

Ilminster [30]
PartyCandidateVotes%±%
Conservative Linda Patricia Vijeh * 1,736 53.4 +24.3
Liberal Democrats Carol Ann Goodall98030.2+4.5
Green Peter Lansdown2036.3–2.2
UKIP Don Kinder1695.2–23.6
Labour Ian Rupert Mackillop1604.9–1.6
Majority75623.3+23.0
Turnout 3,24839.6–0.4
Registered electors 8,192
Conservative hold Swing

King Alfred

King Alfred [31]
PartyCandidateVotes%±%
Conservative David John Huxtable * 1,744 52.3 +6.2
Liberal Democrats Emma Munt1,14634.4+20.1
UKIP Anthony John Edward Betty2327.0–11.9
Labour Lynne Morgan2106.3–0.8
Majority59817.9–9.3
Turnout 3,33242.0+6.0
Registered electors 7,924
Conservative hold Swing

Lydeard

Lydeard [32]
PartyCandidateVotes%±%
Independent Mike Rigby * 1,356 48.1 –5.8
Conservative Roger Keith Habgood1,05537.4+5.5
Liberal Democrats James Russell2047.2–2.7
Labour Jonathan Frederic Gray1154.1–0.1
Green Clive Patrick Martin883.1N/A
Majority30110.7–11.3
Turnout 2,81838.1–1.9
Registered electors 7,389
Independent hold Swing

Martock

Martock [33]
PartyCandidateVotes%±%
Conservative Neil Brian Bloomfield 2,075 63.5 +29.7
Liberal Democrats Jonathan Paul Davies92328.3–6.1
Labour Peter Charles Ludbrook2688.2+0.1
Majority1,15235.3N/A
Turnout 3,26639.0+3.0
Registered electors 8,383
Conservative gain from Liberal Democrats Swing

Mendip Central & East

Mendip Central & East [34]
PartyCandidateVotes%±%
Conservative Philip John Ham * 1,730 60.0 +19.8
Liberal Democrats Claire Louise Hudson57920.1–12.4
Green Jono Ekin32211.2+6.1
Labour Marc James Peel2518.7+1.9
Majority1,15139.9+32.1
Turnout 2,88239.2–0.8
Registered electors 7,356
Conservative hold Swing

Mendip Hills

Mendip Hills [35]
PartyCandidateVotes%±%
Conservative Mike Pullin 1,626 57.8 +14.8
Liberal Democrats Melissa Coate68324.3+12.4
Green David Hine1977.0–1.6
Labour G. Paul Turner1916.8–4.2
UKIP Simon Smedley1154.1–21.4
Majority94333.5+15.9
Turnout 2,81237.4+4.4
Registered electors 7,511
Conservative hold Swing

Mendip South

Mendip South [36]
PartyCandidateVotes%±%
Conservative Nigel Anthony Hewitt-Coope 1,801 56.5 +17.3
Liberal Democrats Robert John Reed1,04432.8+0.8
Green Theo Simon34010.7+4.5
Majority75723.8+16.6
Turnout 3,18543.1+2.1
Registered electors 7,392
Conservative hold Swing

Mendip West

Mendip West [37]
PartyCandidateVotes%±%
Conservative Graham Noel * 1,666 47.8 +10.0
Liberal Democrats Ros Wyke1,66047.6+13.3
Labour Daniel Croose1594.6–0.4
Majority60.2–3.3
Turnout 3,48547.2+5.2
Registered electors 7,389
Conservative hold Swing

Minehead

Minehead [38]
PartyCandidateVotes%±%
Conservative Mandy Jayne Chilcott 1,290 43.3 +21.0
Liberal Democrats Marcus Kravis83928.1+4.5
UKIP Terry Venner *60920.4–7.6
Labour Maureen Anne Smith2438.2+3.2
Majority45115.1N/A
Turnout 2,98144.3+5.3
Registered electors 6,735
Conservative gain from UKIP Swing

Monkton & North Curry

Monkton & North Curry [39]
PartyCandidateVotes%±%
Conservative David John Andrew Fothergill * 2,254 66.5 +19.8
Liberal Democrats Ray Tully83624.7–1.8
Green Andy Pritchard2978.8+5.7
Majority1,41841.9+21.7
Turnout 3,38741.2–0.8
Registered electors 8,213
Conservative hold Swing

North Petherton

North Petherton [40]
PartyCandidateVotes%±%
Liberal Democrats Bill Revans 1,435 51.3 +18.3
Conservative Richard James Brown *1,18742.4+8.4
Labour Jane Grenfell1786.4–4.1
Majority2488.9N/A
Turnout 2,80040.5+8.5
Liberal Democrats gain from Conservative Swing

Rowbarton & Staplegrove

Rowbarton & Staplegrove [41]
PartyCandidateVotes%±%
Conservative Rod Williams 1,125 40.1 +12.4
Liberal Democrats Jefferson Andrew Horsley1,01836.3+4.3
Independent Bob Bainbridge29010.3N/A
Labour Brenda Dawn Weston2508.9–5.4
Green Alan William Debenham1194.2–1.5
Majority1073.8N/A
Turnout 2,80238.8+6.8
Registered electors 7,227
Conservative gain from Liberal Democrats Swing

Shepton Mallet

Shepton Mallet [42]
PartyCandidateVotes%±%
Conservative John Parham * 1,253 43.5 +13.2
Liberal Democrats Garfield Kennedy85129.6+3.4
Independent Bente Height40314.0N/A
Labour Ant Butler30210.5–10.5
Green Peter Nicholas Harlow692.4–1.1
Majority40214.0+10.0
Turnout 2,87835.0+4.0
Registered electors 8,214
Conservative hold Swing

Somerton

Somerton [43]
PartyCandidateVotes%±%
Conservative Dean Ruddle * 2,340 66.7 +22.7
Liberal Democrats Stephen Richard John Page86924.8+0.9
Green Dan Britton1775.0–7.5
Labour Mary Graham Butler1243.5–0.5
Majority1,47141.9+21.8
Turnout 3,51047.1+3.1
Registered electors 7,451
Conservative hold Swing

South Petherton & Islemoor

South Petherton & Islemoor [44]
PartyCandidateVotes%±%
Liberal Democrats Adam James Dance 2,303 56.1 +24.0
Conservative Christopher Antony Le Hardy *1,45535.4+1.6
UKIP Antony Bryan Clarke1874.6–16.8
Labour Paul John Sellers1623.9–1.5
Majority84820.6N/A
Turnout 4,10750.7+10.7
Registered electors 8,098
Liberal Democrats gain from Conservative Swing

Taunton East

Taunton East [45]
PartyCandidateVotes%±%
Liberal Democrats Simon Coles * 869 43.2 +5.2
Conservative Stephen Henry Martin-Scott66132.8+16.7
Labour Robert Noakes24212.0–2.6
UKIP Hugh Courage1427.1–18.3
Green Jon Machen994.9–0.5
Majority20810.3–2.3
Turnout 2,01327.9+1.9
Registered electors 7,223
Liberal Democrats hold Swing

Taunton North

Taunton North [46]
PartyCandidateVotes%±%
Conservative Giuseppe Leslie Fraschini 693 32.5 +15.1
Liberal Democrats Chris Booth64830.4+0.3
Labour Libby Lisgo54325.4+3.3
UKIP Tom Aldridge1657.7–16.2
Green Daniel James Whelan864.0–1.9
Majority452.1N/A
Turnout 2,13530.4+4.4
Registered electors 7,023
Conservative gain from Liberal Democrats Swing

Taunton South

Taunton South [47]
PartyCandidateVotes%±%
Liberal Democrats Hazel Prior-Sankey * 1,564 54.9 +11.0
Conservative Luke Rush Parchment92232.4+15.1
Labour Jack Robert Johnston2177.6–3.6
Green Chris Salter1445.1+0.5
Majority64222.6+1.8
Turnout 2,84736.9+2.9
Registered electors 7,707
Liberal Democrats hold Swing

Upper Tone

Upper Tone [48]
PartyCandidateVotes%±%
Conservative James Hunt * 1,574 49.1 +16.0
Independent Steve Ross89027.8+1.7
Liberal Democrats Janet Carol Lloyd48515.1+8.1
Green Caroline Anne Freedman2568.0N/A
Majority68421.3+17.8
Turnout 3,20543.8+0.8
Registered electors 7,318
Conservative hold Swing

Watchet & Stogursey

Watchet & Stogursey [49]
PartyCandidateVotes%±%
Independent Hugh Davies * 1,423 48.7 +9.6
Conservative Richard Patrick Lillis90030.8+1.3
Labour Robin Keith Nuttall29810.2–1.3
Liberal Democrats Anthony Charles Bowden1916.5N/A
UKIP Peter Barbuti1083.7–16.3
Majority52317.9+8.3
Turnout 2,92039.4+3.4
Independent hold Swing

Wellington

Wellington [50]
PartyCandidateVotes%±%
Labour Andrew Govier * 1,704 52.5 +1.6
Conservative Robin Dickinson1,15135.5+15.4
Liberal Democrats Mark Raymond Lithgow2728.4–2.1
Green Zoe Ainsworth-Grigg1193.7+0.8
Majority55317.0–13.7
Turnout 3,24637.4+1.4
Registered electors 8,673
Labour hold Swing

Wells

Wells [51]
PartyCandidateVotes%±%
Liberal Democrats Tessa Jane Munt 2,107 46.9 +21.0
Conservative John Derek Osman *2,01244.7+4.0
Labour Den Carter1663.7–8.8
Green Paul Francis Crummay1262.8–3.4
UKIP Les Bate861.9–12.9
Majority952.1N/A
Turnout 4,49752.6+11.6
Registered electors 8,556
Liberal Democrats gain from Conservative Swing

Wincanton & Bruton

Wincanton & Bruton [52]
PartyCandidateVotes%±%
Conservative Anna Groskop * 2,096 64.2 +11.0
Liberal Democrats Abigail Rebekah Baker70821.7+2.9
Labour Patricia Ann Turner2447.5+0.9
Green Ewan William George Jones2166.6+2.1
Majority1,38842.5+8.1
Turnout 3,26439.1+4.1
Registered electors 8,352
Conservative hold Swing

Yeovil Central

Yeovil Central [53]
PartyCandidateVotes%±%
Liberal Democrats Andy Kendall 1,033 44.7 +10.3
Conservative Nick Rousell74532.2+10.4
UKIP Alan Ivor Dimmick *2269.8–24.3
Labour Terry Lavin2159.3–1.4
Green Alan Flint934.0N/A
Majority28812.5N/A
Turnout 2,31232.0+3.0
Registered electors 7,231
Liberal Democrats gain from UKIP Swing

Yeovil East

Yeovil East [54]
PartyCandidateVotes%±%
Liberal Democrats Tony Lock * 1,063 49.0 +7.9
Conservative Teresa Sienkiewicz51223.6+14.2
Labour Terry Ledlie25511.8+1.6
UKIP Godfrey Davey22010.1–25.7
Independent Neil James Mitchell1185.4N/A
Majority55125.4+20.0
Turnout 2,16828.4+1.4
Registered electors 7,633
Liberal Democrats hold Swing

Yeovil South

Yeovil South [55]
PartyCandidateVotes%±%
Conservative Faye Purbrick 1,288 46.2 +21.6
Liberal Democrats Andy Soughton1,03137.0–1.6
Labour Christos Zaranis1736.2–2.8
Independent Dave Greene1655.9N/A
Green Diane Catherine Wood1314.7+0.3
Majority2579.2N/A
Turnout 2,78836.4+3.4
Registered electors 7,655
Conservative gain from Liberal Democrats Swing

Yeovil West

Yeovil West [56]
PartyCandidateVotes%±%
Liberal Democrats Jane Lock * 877 43.1 +2.9
Conservative John Richard Lukey78338.5+18.6
Labour Gail Freeman-Bell23411.5+1.7
Green Robert Charles Wood1406.9+2.0
Majority944.6–10.5
Turnout 2,03432.2+3.2
Registered electors 6,316
Liberal Democrats hold Swing

By-elections

Comeytrowe & Trull

Comeytrowe & Trull: 7 October 2021
PartyCandidateVotes%±%
Liberal Democrats Dawn Johnson 1,677 63.2 +15.6
Conservative Ruth Harmon88633.4-6.4
Labour Michael McGuffie923.5-2.4
Majority79129.8
Turnout 2,655
Liberal Democrats hold Swing Increase2.svg11.0

Related Research Articles

<span class="mw-page-title-main">Somerset</span> County in South West England

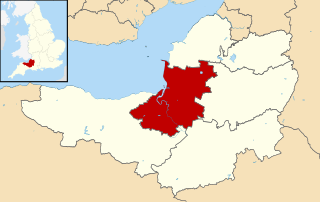
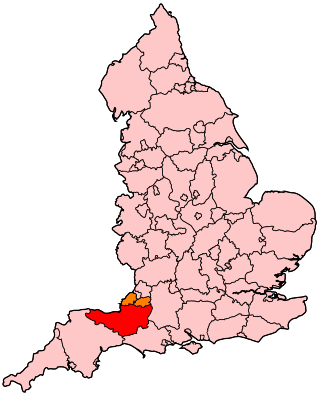
Somerset is a ceremonial county in South West England. It is bordered by the Bristol Channel, Gloucestershire, and Bristol to the north, Wiltshire to the east and the north-east, Dorset to the south-east, and Devon to the south-west. The largest settlement is the city of Bath, and the county town is Taunton.

<span class="mw-page-title-main">Sedgemoor</span> Former non-metropolitan district in England

Sedgemoor is a low-lying area of land in Somerset, England. It lies close to sea level south of the Polden Hills, historically largely marsh. The eastern part is known as King's Sedgemoor, and the western part West Sedgemoor. Sedgemoor is part of the area now known as the Somerset Levels and Moors. Historically the area was known as the site of the Battle of Sedgemoor.

<span class="mw-page-title-main">North Petherton</span> Human settlement in England

North Petherton is a town and civil parish in Somerset, England, situated on the edge of the eastern foothills of the Quantocks, and close to the edge of the Somerset Levels. The town has a population of 6,730 as of 2014. The parish includes Hamp, Melcombe, Shearston, Woolmersdon and Huntworth.

<span class="mw-page-title-main">South Somerset</span> Former non-metropolitan district in England

South Somerset was a local government district in Somerset, England, from 1974 to 2023. The district covered an area of 370 square miles (958 km2) ranging from the borders with Devon, Wiltshire and Dorset to the edge of the Somerset Levels. It had a population of approximately 158,000. The administrative centre of the district was Yeovil.

<span class="mw-page-title-main">History of Somerset</span> Aspect of history

Somerset is a historic county in the south west of England. There is evidence of human occupation since prehistoric times with hand axes and flint points from the Palaeolithic and Mesolithic eras, and a range of burial mounds, hill forts and other artefacts dating from the Neolithic, Bronze and Iron Ages. The oldest dated human road work in Great Britain is the Sweet Track, constructed across the Somerset Levels with wooden planks in the 39th century BCE.

<span class="mw-page-title-main">Somerton and Frome (UK Parliament constituency)</span> UK Parliamentary constituency

Somerton and Frome is a constituency in Somerset represented in the House of Commons of the UK Parliament since 2023 by Sarah Dyke of the Liberal Democrats.

<span class="mw-page-title-main">Yeovil (UK Parliament constituency)</span> Constituency in South West England

Yeovil is a constituency in Somerset created in 1918 and represented in the House of Commons of the Parliament of the United Kingdom. It has been represented since 2015 by Marcus Fysh, a Conservative.

<span class="mw-page-title-main">Geology of Somerset</span>

Somerset is a rural county in the southwest of England, covering 4,171 square kilometres (1,610 sq mi). It is bounded on the north-west by the Bristol Channel, on the north by Bristol and Gloucestershire, on the north-east by Wiltshire, on the south-east by Dorset, and on the south west and west by Devon. It has broad central plains with several ranges of low hills. The landscape divides into four main geological sections from the Silurian through the Devonian and Carboniferous to the Permian which influence the landscape, together with water-related features.

<span class="mw-page-title-main">Bridgwater and West Somerset (UK Parliament constituency)</span> Parliamentary constituency in the United Kingdom, 2010 onwards

Bridgwater and West Somerset is a constituency represented in the House of Commons of the UK Parliament since 2010 by Ian Liddell-Grainger, a Conservative.

<span class="mw-page-title-main">West Somerset (UK Parliament constituency)</span> Parliamentary constituency in the United Kingdom, 1832–1885

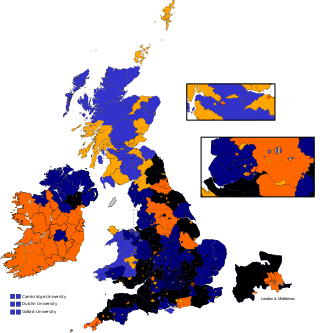
West Somerset or Somerset Western was the name of a parliamentary constituency in the county of Somerset between 1832 and 1885. It returned two Members of Parliament to the House of Commons of the Parliament of the United Kingdom, elected by the bloc vote system.

<span class="mw-page-title-main">Transport in Somerset</span> Overview of transport in Somerset

The earliest known infrastructure for transport in Somerset is a series of wooden trackways laid across the Somerset Levels, an area of low-lying marshy ground. To the west of this district lies the Bristol Channel, while the other boundaries of the county of Somerset are along chains of hills that were once exploited for their mineral deposits. These natural features have all influenced the evolution of the transport network. Roads and railways either followed the hills, or needed causeways to cross the Levels. Harbours were developed, rivers improved, and linked to sources of traffic by canals. Railways were constructed throughout the area, influenced by the needs of the city of Bristol, which lies just to the north of Somerset, and to link the ports of the far south-west with the rest of England.

<span class="mw-page-title-main">Geography of Somerset</span>

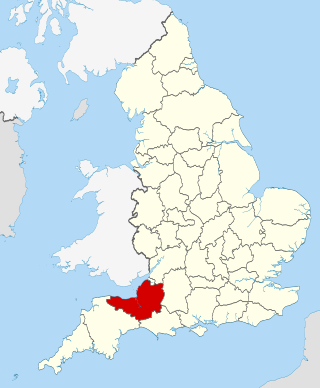
The county of Somerset is in South West England, bordered by the Bristol Channel and the counties of Bristol and Gloucestershire to the north, and Wiltshire to the east, Dorset to the south, and Devon to the west. The climate, influenced by its proximity to the Atlantic Ocean and the prevailing westerly winds, tends to be mild, damp and windy.

<span class="mw-page-title-main">Somerset Rugby Football Union</span> Rugby union governing body in England

The Somerset County Rugby Football Union (SCRFU) is the governing body for the sport of rugby union in the county of Somerset in England. The union is the constituent body of the Rugby Football Union (RFU) for Somerset. The SCRFU administers and organises rugby union clubs and competitions in the Somerset including the county rugby representative teams.

Somerset NHS Foundation Trust is a NHS foundation trust providing services for NHS England in Somerset, England. It manages a number of hospitals providing mental, community and acute hospital care across the whole county.

<span class="mw-page-title-main">2022 Somerset Council election</span> 2022 local election in Somerset

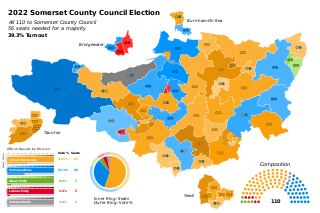
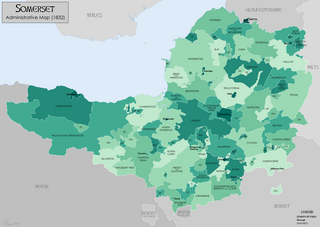
The 2022 Somerset Council election took place on 5 May 2022. It was the inaugural election of the new unitary authority, Somerset Council, which replaced Somerset County Council on 1 April 2023. All 110 councillors were elected, representing the same divisions as the old county council, but with twice as many councillors representing each. The councillors elected first sat as members of the existing county council until its replacement by the new authority. The same councillors are now members of Somerset Council.

References

  1. "Upcoming elections & referendums". Electoral Commission. Archived from the original on 5 May 2018. Retrieved 15 September 2016.
  2. "Election results for Bishop's Hull & Taunton West". Somerset County Council . Retrieved 5 May 2017.
  3. "Election results for Blackdown & Neroche". Somerset County Council . Retrieved 5 May 2017.
  4. "Election results for Blackmoor Vale". Somerset County Council . Retrieved 5 May 2017.
  5. "Somerset County Council - Sedgemoor divisions". Sedgemoor District Council . Retrieved 5 May 2017.
  6. "Election results for Bridgwater East & Bawdrip". Somerset County Council . Retrieved 5 May 2017.
  7. "Election results for Bridgwater North & Central". Somerset County Council . Retrieved 5 May 2017.
  8. "Election results for Bridgwater South". Somerset County Council . Retrieved 5 May 2017.
  9. "Election results for Bridgwater West". Somerset County Council . Retrieved 5 May 2017.
  10. "Election results for Brympton". Somerset County Council . Retrieved 5 May 2017.
  11. "Election results for Burnham on Sea North". Somerset County Council . Retrieved 4 May 2013.
  12. "Election results for Cannington". Somerset County Council . Retrieved 5 May 2017.
  13. "Election results for Castle Cary". Somerset County Council . Retrieved 5 May 2017.
  14. "Election results for Chard North". Somerset County Council . Retrieved 5 May 2017.
  15. "Election results for Chard South". Somerset County Council . Retrieved 4 May 2013.
  16. "Election results for Cheddar". Somerset County Council . Retrieved 5 May 2017.
  17. "Election results for Coker". Somerset County Council . Retrieved 17 May 2013.
  18. "Election results for Comeytrowe & Trull". Somerset County Council . Retrieved 5 May 2017.
  19. "Election results for Crewkerne". Somerset County Council . Retrieved 5 May 2013.
  20. "Election results for Curry Rivel & Langport". Somerset County Council . Retrieved 5 May 2017.
  21. "Election results for Dulverton & Exmoor". Somerset County Council . Retrieved 5 May 2017.
  22. "Election results for Dunster". Somerset County Council . Retrieved 5 May 2017.
  23. "Election results for Frome East". Somerset County Council . Retrieved 5 May 2017.
  24. "Election results for Frome North". Somerset County Council . Retrieved 5 May 2017.
  25. "Election results for Frome West". Somerset County Council . Retrieved 5 May 2017.
  26. Wood, James (26 April 2017). "Somerset County Council electoral candidate appears only as Derek on Frome ballot paper". SomersetLive. Reach plc. Retrieved 11 May 2020.
  27. "Election results for Glastonbury & Street". Somerset County Council . Retrieved 5 May 2017.
  28. "Election results for Highbridge & Burnham South". Somerset County Council . Retrieved 5 May 2017.
  29. "Election results for Huntspill". Somerset County Council . Retrieved 5 May 2017.
  30. "Election results for Ilminster". Somerset County Council . Retrieved 5 May 2017.
  31. "Election results for King Alfred". Somerset County Council . Retrieved 5 May 2017.
  32. "Election results for Lydeard". Somerset County Council . Retrieved 5 May 2017.
  33. "Election results for Martock". Somerset County Council . Retrieved 5 May 2017.
  34. "Election results for Mendip Central and East". Somerset County Council . Retrieved 5 May 2017.
  35. "Election results for Mendip Hills". Somerset County Council . Retrieved 5 May 2017.
  36. "Election results for Mendip South". Somerset County Council . Retrieved 5 May 2017.
  37. "Election results for Mendip West". Somerset County Council . Retrieved 5 May 2017.
  38. "Election results for Minehead". Somerset County Council . Retrieved 5 May 2017.
  39. "Election results for Monkton & North Curry". Somerset County Council . Retrieved 5 May 2017.
  40. "Election results for North Petherton". Somerset County Council . Retrieved 5 May 2017.
  41. "Election results for Rowbarton & Staplegrove". Somerset County Council . Retrieved 5 May 2017.
  42. "Election results for Shepton Mallet". Somerset County Council . Retrieved 5 May 2017.
  43. "Election results for Somerton". Somerset County Council . Retrieved 5 May 2017.
  44. "Election results for South Petherton & Islemoor". Somerset County Council . Retrieved 5 May 2017.
  45. "Election results for Taunton East". Somerset County Council . Retrieved 5 May 2017.
  46. "Election results for Taunton North". Somerset County Council . Retrieved 5 May 2017.
  47. "Election results for Taunton South". Somerset County Council . Retrieved 5 May 2017.
  48. "Election results for Upper Tone". Somerset County Council . Retrieved 5 May 2017.
  49. "Election results for Watchet & Storgursey". Somerset County Council . Retrieved 5 May 2017.
  50. "Election results for Wellington". Somerset County Council . Retrieved 5 May 2017.
  51. "Election results for Wells". Somerset County Council . Retrieved 5 May 2017.
  52. "Election results for Wincanton & Bruton". Somerset County Council . Retrieved 5 May 2017.
  53. "Election results for Yeovil Central". Somerset County Council . Retrieved 5 May 2017.
  54. "Election results for Yeovil East". Somerset County Council . Retrieved 5 May 2017.
  55. "Election results for Yeovil South". Somerset County Council . Retrieved 5 May 2017.
  56. "Election results for Yeovil West". Somerset County Council . Retrieved 5 May 2017.