2011 Bath and North East Somerset Council election

Last updated

2011 Bath and North East Somerset Council election
  2007 5 May 2011 (2011-05-05) 2015  

All 65 seats to Bath and North East Somerset Council
33 seats needed for a majority
 First partySecond party
 
Con
LD
Party Conservative Liberal Democrats
Last election31 seats, 43.2%26 seats, 32.5%
Seats won2929
Seat changeDecrease2.svg 2Increase2.svg 3
Popular vote41,55839,181
Percentage36.9%34.8%
SwingDecrease2.svg 6.3%Increase2.svg 2.3%

 Third partyFourth party
 
Lab
Ind
Party Labour Independent
Last election5 seats, 11.1%3 seats, 7.0%
Seats won52
Seat changeSteady2.svgDecrease2.svg 1
Popular vote20,1514,033
Percentage17.9%3.6%
SwingIncrease2.svg 6.8%Decrease2.svg 3.4%

BANES wards 2011.svg
Map showing the composition of Bath and North East Somerset Council following the election. Blue showing Conservative, Red showing Labour, Yellow showing Liberal Democrats, and Grey showing Independents. Striped wards have mixed representation.

Council control before election

No overall control (Con minority)

Council control after election

No overall control (Lib Dem minority)

The Bath and North East Somerset Council election was held on 5 May 2011 to elect 65 local councillors for Bath and North East Somerset Council. Following the election, a minority Liberal Democrat administration was formed. Cllr Paul Crossley became leader of the council.

Contents

Election results

Bath and North East Somerset Council election, 2011 [1]
PartyCandidatesVotes
StoodElectedGainedUnseatedNet % of total %No.Net %
  Conservative 652913Decrease2.svg244.6%36.9%41,558Decrease2.svg6.3%
  Liberal Democrats 652941Increase2.svg344.6%34.8%39,181Increase2.svg2.3%
  Labour 48511Steady2.svg7.7%17.9%20,151Increase2.svg6.8%
  Independent 11212Decrease2.svg13.1%3.6%4,033Decrease2.svg3.4%
  Green 21000Steady2.svg0%6.7%7,557Increase2.svg0.8%
  UKIP 1000Steady2.svg0%0.1%94N/A

Ward results

The ward results listed below are based on the changes from the 2007 elections, not taking into account any party defections or by-elections. Sitting councillors are marked with an asterisk (*).

Abbey

Abbey (2 seats) [2]
PartyCandidateVotes%±%
Liberal Democrats Manda Rigby 773 34.4 +1.6
Conservative Brian John Webber * 716 31.9 –5.8
Liberal Democrats Jay Oliver Risbridger662
Conservative Gladys Pek Yue MacRae646
Green Ian James Martin43619.4+1.5
Labour Adrian Bateman32314.4N/A
Turnout 1,95744.2
Registered electors 4,427
Liberal Democrats gain from Conservative Swing
Conservative hold Swing

Bathavon North

Bathavon North (3 seats) [3]
PartyCandidateVotes%±%
Conservative Gabriel Michael Batt * 1,423 37.2 –14.1
Conservative Martin Beresford John Veal * 1,408
Conservative Geoff Ward 1,289
Liberal Democrats Alison Millar1,23732.4+13.6
Liberal Democrats Eve Strasburger855
Liberal Democrats Charlotte Moore826
Labour Anne Brown59115.5+3.8
Green Justin Christopher Temblett-Wood57215.0–2.5
Labour Derek William Brown567
Turnout 3,34357.2
Registered electors 5,845
Conservative hold Swing

Bathavon South

Bathavon South [4]
PartyCandidateVotes%±%
Liberal Democrats Neil Butters * 680 49.3 +3.5
Conservative Harvey Haeberling47834.7+1.0
Labour David Walter Lavington1168.4N/A
Green Hugh Golden Prentice1057.6–9.6
Majority20214.6
Turnout 1,38862.1
Registered electors 2,236
Liberal Democrats hold Swing

Bathavon West

Bathavon West [5]
PartyCandidateVotes%±%
Conservative David John Veale 493 53.0 –1.3
Liberal Democrats Louise Bray43747.0+1.3
Majority566.0
Turnout 95147.8
Registered electors 1,991
Conservative hold Swing

Bathwick

Bathwick (2 seats) [6]
PartyCandidateVotes%±%
Liberal Democrats Nicholas John Coombes * 740 47.0 +10.3
Liberal Democrats David John Martin 657
Conservative Tony Hickman52833.5–3.1
Conservative Johnny Kidney528
Green Katharine Anne Miles1559.8–0.8
Labour Peter Marsh1539.7+5.6
Green Jenny Rust124
Turnout 1,52035.2
Registered electors 4,319
Liberal Democrats hold Swing

Chew Valley North

Chew Valley North [7]
PartyCandidateVotes%±%
Conservative Malcolm Charles Hanney * 672 73.8 –10.0
Liberal Democrats Nicholas John Evan Roberts12213.4–2.8
Labour Hattie Ajderian11712.8N/A
Majority55060.4
Turnout 92147.9
Registered electors 1,922
Conservative hold Swing

Chew Valley South

Chew Valley South [8]
PartyCandidateVotes%±%
Conservative Victor Lewis Pritchard * 451 52.2 –20.7
Liberal Democrats Charles Fenn15417.8–9.3
Independent John Kenyon Knibbs13215.3N/A
Labour Susan Irene Thorne12714.7N/A
Majority29734.4
Turnout 86845.2
Registered electors 1,919
Conservative hold Swing

Clutton

Clutton [9]
PartyCandidateVotes%±%
Liberal Democrats Jeremy Sparks 568 52.6 +35.2
Conservative Steve Willcox *51147.4–15.0
Majority575.1
Turnout 1,11356.9
Registered electors 1,955
Liberal Democrats gain from Conservative Swing

Combe Down

Combe Down (2 seats) [10]
PartyCandidateVotes%±%
Liberal Democrats Roger Alan Symonds * 1,052 46.2 –4.5
Liberal Democrats Cherry Elizabeth Beath * 1,042
Conservative Robin Henderson Kirkland56724.9–9.9
Conservative Glenys Chalker564
Green Giles Oliver Malcolm Green31713.9–0.8
Labour Jane Bigham28312.4N/A
Independent Kevin Russell592.6N/A
Turnout 2,18053.2
Registered electors 4,099
Liberal Democrats hold Swing

Farmborough

Farmborough [11]
PartyCandidateVotes%±%
Conservative Sally Davis * 861 71.8 –2.4
Liberal Democrats Adrian Dobinson22819.0+10.3
Labour Sarah Louise Pryer1109.2–7.9
Majority63352.8
Turnout 1,20957.2
Registered electors 2,113
Conservative hold Swing

High Littleton

High Littleton [12]
PartyCandidateVotes%±%
Conservative Les Kew * 742 61.7 –9.1
Labour Roger Baber30826.0+8.7
Liberal Democrats Frank Blades15312.7+0.8
Majority43436.1
Turnout 1,21150.0
Registered electors 2,420
Conservative hold Swing

Keynsham East

Keynsham East (2 seats) [13]
PartyCandidateVotes%±%
Conservative Bryan Organ * 1,310 52.5 +3.9
Conservative Marie Longstaff * 1,138
Liberal Democrats Andy Wait62224.9+3.9
Labour Steve Rossiter56522.6+12.8
Liberal Democrats Roger Martin Clark528
Turnout 2,39354.3
Registered electors 4,408
Conservative hold Swing

Marie Longstaff was previously elected under her maiden name Marie Brewer

Keynsham North

Keynsham North (2 seats) [14]
PartyCandidateVotes%±%
Conservative Charles Daniel Gerrish * 1,174 56.9 +3.4
Conservative Brian Simmons * 913
Labour Luke Hobbs54526.4+4.7
Liberal Democrats Keith Richard Kirwan34416.7+3.9
Labour Michael Evans330
Liberal Democrats Angela Godfrey203
Turnout 1,98448.7
Registered electors 4,076
Conservative hold Swing

Keynsham South

Keynsham South (2 seats) [15]
PartyCandidateVotes%±%
Conservative Alan Dudley Hale * 824 44.8 +14.3
Conservative Kate Simmons 640
Labour Paul Rabbeth60032.6–3.9
Labour Keith Burchell595
Liberal Democrats Tony Crouch41622.6+0.1
Liberal Democrats Sam Lawes228
Turnout 1,79646.2
Registered electors 3,891
Conservative gain from Labour Swing
Conservative hold Swing

Kingsmead

Kingsmead (2 seats) [16]
PartyCandidateVotes%±%
Liberal Democrats Andrew Furse * 924 40.0 –4.9
Liberal Democrats Douglas Nicol 620
Conservative Carol Anne Paradise *46920.3–8.6
Green Eric Lucas45719.8–0.5
Conservative Anthony Bernard Masters417
Labour Pam Richards36715.9N/A
UKIP Michael Stanley944.1N/A
Turnout 1,85344.9
Registered electors 4,125
Liberal Democrats hold Swing

Lambridge

Lambridge (2 seats) [17]
PartyCandidateVotes%±%
Conservative Bryan Alan Chalker * 871 32.4 –6.8
Conservative Dave Laming 719
Liberal Democrats Quil Cantrell61723.0–8.1
Labour Bernard Morgan60522.5+14.1
Green Thelma Vivian Grimes59322.1+0.8
Liberal Democrats Raine Cantrell587
Turnout 2,33955.5
Registered electors 4,215
Conservative hold Swing

Lansdown

Lansdown (2 seats) [18]
PartyCandidateVotes%±%
Conservative Patrick Anketell-Jones 1,018 48.0 –19.5
Conservative Tony Clarke * 888
Green David Kevin Naismith37817.8N/A
Liberal Democrats Cherry Joan Shelton-Mills37817.8–14.7
Liberal Democrats Jeremy Thomas Francis Hime354
Labour Philip McCabe28913.6N/A
Independent Allison Margaret Derrick592.8N/A
Turnout 1,87252.6
Registered electors 3,561
Conservative hold Swing

Lyncombe

Lyncombe (2 seats) [19]
PartyCandidateVotes%±%
Liberal Democrats David Bellotti * 1,353 43.8 +6.6
Liberal Democrats Katie Hall 1,095
Conservative Liz Dodgson84127.2–6.4
Conservative Ben Robinson748
Green Donald Patrick Grimes51216.6+1.1
Labour Julian Vincent38312.4N/A
Turnout 2,73760.6
Registered electors 4,518
Liberal Democrats hold Swing

Mendip

Mendip [20]
PartyCandidateVotes%±%
Conservative Tim Warren * 646 57.7 –8.3
Labour Tim Thorne22620.2–6.9
Green Michael Edwin Jay14312.8+0.5
Liberal Democrats Benjamin Goldstrom1049.3+1.0
Majority42037.5
Turnout 1,12853.6
Registered electors 2,106
Conservative hold Swing

Midsomer Norton North

Midsomer Norton North (2 seats) [21]
PartyCandidateVotes%±%
Conservative Michael Evans 849 47.6 +4.5
Conservative Barry Macrae * 787
Labour Co-op Gael Doswell64936.4+1.0
Labour Co-op Fflyff McLaren631
Liberal Democrats Michael Jakins28516.0–7.5
Liberal Democrats Tim Bray231
Turnout 1,86040.8
Registered electors 4,563
Conservative hold Swing

Midsomer Norton Redfield

Midsomer Norton Redfield (2 seats) [22]
PartyCandidateVotes%±%
Conservative Paul Myers 996 55.0 +11.9
Conservative Chris Watt * 903
Labour Co-op Wayne Teall64135.4+2.0
Labour Co-op Peter Sas545
Liberal Democrats Dennis Tickell1739.6–13.9
Liberal Democrats Allan Richard Crossley159
Turnout 1,87044.8
Registered electors 4,171
Conservative hold Swing

Newbridge

Newbridge (2 seats) [23]
PartyCandidateVotes%±%
Liberal Democrats Loraine Brinkhurst * 1,246 43.7 –9.5
Liberal Democrats Caroline Roberts * 1,146
Conservative Mike Clarkson72725.5–21.2
Conservative Dan Hogston688
Labour Jo McCarron51318.0N/A
Green Gavin Alexander Withers36412.8N/A
Turnout 2,54157.3
Registered electors 4,437
Liberal Democrats hold Swing

Odd Down

Odd Down (2 seats) [24]
PartyCandidateVotes%±%
Liberal Democrats Steve Hedges * 1,016 48.0 +3.5
Liberal Democrats Nigel Roberts * 858
Labour Liz Vincent38118.0+6.9
Conservative Nicolas de Larrinaga37817.8–9.9
Green Dominic Barrington Tristram34316.2N/A
Conservative Meredith Alun Lloyd328
Turnout 1,92044.9
Registered electors 4,280
Liberal Democrats hold Swing

Oldfield

Oldfield (2 seats) [25]
PartyCandidateVotes%±%
Liberal Democrats Will Sandry * 782 43.4 –6.1
Liberal Democrats David Christopher Dixon * 690
Labour Hilary Fraser38021.1+9.8
Labour Roger Chapman378
Green David Beasley33318.5N/A
Conservative Jonathan Peter Grinham30817.1–1.9
Conservative Jack Whalley300
Turnout 1,77238.0
Registered electors 4,661
Liberal Democrats hold Swing

Paulton

Paulton (2 seats) [26]
PartyCandidateVotes%±%
Labour John Anthony Bull * 787 45.3 +4.4
Labour Liz Hardman 785
Conservative Mike Colliver61635.5–0.8
Conservative Stephen John Goodwin432
Liberal Democrats Debby Tarrant33319.2+3.6
Liberal Democrats Adam Taylor293
Turnout 1,76442.4
Registered electors 4,165
Labour hold Swing
Labour hold Swing

Peasedown

Peasedown (2 seats) [27]
PartyCandidateVotes%±%
Liberal Democrats Nathan Hartley * 1,172 54.2 +12.2
Liberal Democrats Sarah Frances Bevan * 1,149
Labour Guy Matthews36116.7+2.2
Independent Robert William George Butt360
Independent Kathy Thomas288
Independent Jonathan Paul Rich287
Conservative Margaret Rose Brewer26812.4–1.4
Labour Anne Marie Jovic-Sas252
Conservative Deirdre Mary Horstmann238
Turnout 2,32147.5
Registered electors 4,884
Liberal Democrats hold Swing

Publow with Whitchurch

Publow with Whitchurch [28]
PartyCandidateVotes%±%
Conservative Peter Michael John Edwards * 664 72.1 –2.5
Labour Roy Staddon18420.6+11.5
Liberal Democrats Anna Beria657.3–9.0
Majority46051.5
Turnout 90446.5
Registered electors 1,944
Conservative hold Swing

Radstock

Radstock (2 seats) [29]
PartyCandidateVotes%±%
Liberal Democrats Simon George Allen * 799 44.2 N/A
Labour Co-op Eleanor Margaret Jackson * 711 39.3 +7.4
Labour Co-op Lesley Mansell639
Liberal Democrats Gabby Durham551
Conservative Michael Cobb29916.5+0.2
Conservative Carole Diane Fitzpatrick250
Turnout 1,82244.2
Registered electors 4,122
Liberal Democrats gain from Independent Swing
Labour Co-op hold Swing

Saltford

Saltford (2 seats) [30]
PartyCandidateVotes%±%
Conservative Francine Haeberling * 932 44.5 –6.5
Conservative Mathew Blankley 894
Independent Reg Williams59628.5+6.7
Labour Michael John Tucker29314.0+4.4
Liberal Democrats Raymond Buchanan27313.0–4.6
Labour Elizabeth Anne Derl-Davis258
Liberal Democrats Daniel Robert Walker83
Turnout 1,87455.9
Registered electors 3,353
Conservative hold Swing

Southdown

Southdown (2 seats) [31]
PartyCandidateVotes%±%
Liberal Democrats Paul Crossley * 863 45.3 +1.1
Liberal Democrats Dine Romero * 803
Labour Keith Franklin40221.1N/A
Conservative Dan Warren32317.0–12.5
Green Natalie Valentina Davis31516.6–9.6
Conservative Peter Gordon Till272
Turnout 1,80960.7
Registered electors 4,308
Liberal Democrats hold Swing

Timsbury

Timsbury [32]
PartyCandidateVotes%±%
Independent Douglas Deacon * 852 68.9 +33.1
Labour Co-op Will Parbury18915.3–17.1
Conservative Michael Green14812.0–15.9
Liberal Democrats Robert James Attword483.9–0.1
Majority66353.6
Turnout 1,23958.3
Registered electors 2,127
Independent hold Swing

Twerton

Twerton (2 seats) [33]
PartyCandidateVotes%±%
Liberal Democrats Tim Ball * 757 54.3 –13.1
Liberal Democrats Gerry Curran * 525
Labour Steve Cope25418.2N/A
Conservative John Palmer23416.8+15.8
Labour Sanjeev Chaddha220
Conservative Gay Tulyholowycz153
Green Justin Lee-Gammage15010.8N/A
Turnout 1,33335.0
Registered electors 3,804
Liberal Democrats hold Swing

Walcot

Walcot (2 seats) [34]
PartyCandidateVotes%±%
Liberal Democrats Lisa Jane Brett 1,144 38.7 +2.4
Liberal Democrats Paul Jonathan Fox 914
Green Nicholas Hales75525.5+1.7
Labour Steve Bendle59920.3+10.8
Conservative Joy Goldsmith45915.5+14.9
Conservative Mandana Sharifi383
Turnout 2,41154.6
Registered electors 4,414
Liberal Democrats hold Swing

Westfield

Westfield (2 seats) [35]
PartyCandidateVotes%±%
Labour Rob Appleyard * 971 51.5 +11.1
Labour Robin Moss 651
Independent Sue Hamilton51427.1N/A
Independent Eddie Newman321
Conservative Monica Evans29115.3+0.8
Conservative Clive Fricker212
Liberal Democrats Catherine Whybrow1236.5+1.1
Liberal Democrats Lesley Clarke98
Turnout 1,75639.8
Registered electors 4,409
Labour hold Swing
Labour gain from Independent Swing

Westmoreland

Westmoreland (2 seats) [36]
PartyCandidateVotes%±%
Independent June Player 565 28.9 N/A
Liberal Democrats Sharon Grace Ball * 549 28.1 –3.0
Liberal Democrats Matt Hemsley512
Green Jon Lucas34917.8–8.7
Green Nigel David Williams312
Labour David Halpin28614.6–0.7
Labour Hadleigh Roberts231
Conservative Mike Ringham20810.6–16.5
Conservative Lance Payton200
Turnout 1,89837.8
Registered electors 5,024
Independent gain from Liberal Democrats Swing
Liberal Democrats hold Swing

Weston

Weston (2 seats) [37]
PartyCandidateVotes%±%
Conservative Colin Vincent Barrett * 1,187 47.2 –15.2
Conservative Malcolm John Henry Lees * 963
Liberal Democrats Michelle Drew52420.8–16.8
Liberal Democrats Michelle Anne O'Doherty495
Labour Vicky Drew41916.7N/A
Green Lisa Loveridge38415.3N/A
Turnout 2,27656.0
Registered electors 4,062
Conservative hold Swing

Widcombe

Widcombe (2 seats) [38]
PartyCandidateVotes%±%
Liberal Democrats Ian Andrew Gilchrist * 1,106 44.1 +12.7
Liberal Democrats Ben Stevens 857
Conservative Peter John Martin61324.4–6.6
Conservative Don Wallace562
Green Susan Patricia Bradley46018.3+3.5
Labour Saiful Islam33113.2+6.8
Turnout 2,14647.7
Registered electors 4,502
Liberal Democrats hold Swing
Liberal Democrats gain from Conservative Swing

By-elections between 2011 and 2015

Chew Valley North

Chew Valley North By-Election 15 November 2012 [39]
PartyCandidateVotes%±%
Conservative Liz Richardson 417 50.9 –22.9
Liberal Democrats Charles Fenn27133.0+19.7
Independent Andrew Christopher Tanner10612.9N/A
Green Michael Edwin Jay263.2N/A
Majority14617.8
Turnout 82242.2
Registered electors 1,950
Conservative hold Swing

Bathavon North

Bathavon North By-Election 22 May 2014 [40]
PartyCandidateVotes%±%
Conservative Terry Gazzard 1,047 37.6 +0.4
Liberal Democrats Dorian Ross Williams Baker71225.6–6.8
Labour George Aylett35312.7–2.8
Green Justin Christopher Temblett-Wood35312.7–2.3
UKIP Hugo Jenks31611.4N/A
Majority33512.1
Turnout 2,78146.9
Conservative hold Swing

Related Research Articles

<span class="mw-page-title-main">Bath and North East Somerset</span> District in England

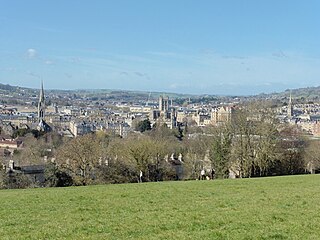
Bath and North East Somerset (B&NES) is a unitary authority district in Somerset, South West England. Bath and North East Somerset Council was created on 1 April 1996 following the abolition of the county of Avon. It is part of the ceremonial county of Somerset.

<span class="mw-page-title-main">Keynsham</span> Town and civil parish in Somerset, England

Keynsham is a town and civil parish located on the outskirts of the city of Bristol on the A4 that links the cities of Bristol and Bath in Somerset, England. It had a population of 19,603 at the 2021 Census. It was listed in the Domesday Book as Cainesham, which is believed to mean the home of Saint Keyne.

Norton Radstock is the name of a former parish council that covered the conurbation of Midsomer Norton, Radstock and Westfield, in the English ceremonial county of Somerset. Created in 1974 as a large civil parish, it was abolished in 2011 and replaced by three smaller parishes.

<span class="mw-page-title-main">Wansdyke (UK Parliament constituency)</span>

Wansdyke was a county constituency represented in the House of Commons of the Parliament of the United Kingdom. It elected one Member of Parliament (MP) by the first past the post system of election.

<span class="mw-page-title-main">North East Somerset (UK Parliament constituency)</span> Parliamentary constituency in the United Kingdom

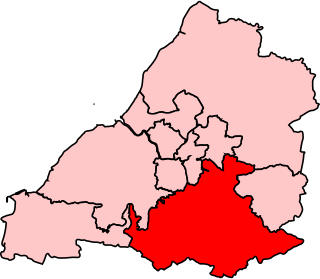
North East Somerset is a constituency represented in the House of Commons of the UK Parliament, since it was created for the 2010 general election, by Jacob Rees-Mogg of the Conservative Party.

<span class="mw-page-title-main">North Somerset (UK Parliament constituency)</span>

North Somerset is a constituency represented in the House of Commons of the UK Parliament since 2010 by Liam Fox, a Conservative who served as Secretary of State for International Trade, a new position in the Cabinet, from 2016 to 2019.

<span class="mw-page-title-main">Bath and North East Somerset Council</span> English local government council

Bath and North East Somerset Council is the local council for the district of Bath and North East Somerset in Somerset, England.

<span class="mw-page-title-main">Compton Dando</span> Village in Somerset, England

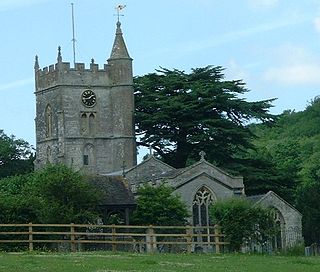
Compton Dando is a small village and civil parish on the River Chew in the affluent Chew Valley in England. It is in the Bath and North East Somerset council area and ceremonial county of Somerset, and lies 7 miles (11.3 km) from Bristol, 8 miles (12.9 km) from Bath, and 3 miles (4.8 km) from Keynsham.

<span class="mw-page-title-main">Marksbury</span> Human settlement in England

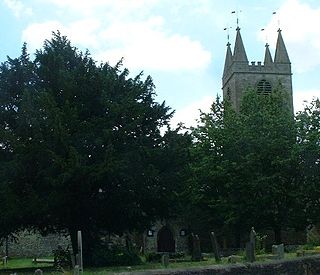
Marksbury is a small village and civil parish on the eastern edge of the affluent Chew Valley in Somerset, about 4 miles (6.4 km) from Keynsham and 7 miles (11.3 km) from Bath on the A39 where it meets the A368. The parish, which includes the villages of Hunstrete and Stanton Prior, has a population of 397.

<span class="mw-page-title-main">Westfield, Somerset</span> Human settlement in England

Westfield is a village and civil parish in Bath and North East Somerset in the ceremonial county of Somerset, England. The village lies on the Fosse Way between the towns of Radstock and Midsomer Norton.

<span class="mw-page-title-main">1999 Bath and North East Somerset Council election</span>

Elections were held on 6 May 1999 to elect 65 local councillors for Bath and North East Somerset Council, the second election for the council. The results are show below. After the election, a minority Liberal Democrat administration was formed.

<span class="mw-page-title-main">2003 Bath and North East Somerset Council election</span>

Elections were held on 1 May 2003 to elect 65 local councillors for Bath and North East Somerset Council. The results are shown below. Following the election, a coalition was formed between the Liberal Democrats and Conservative councillors. Cllr Paul Crossley became leader of the council.

<span class="mw-page-title-main">2007 Bath and North East Somerset Council election</span>

Elections were held on 3 May 2007 to elect 65 local councillors for Bath and North East Somerset Council. The results are show below. Following the elections, a Conservative minority administration was formed. Cllr Francine Haeberling became leader of the council. This replaced the previous Liberal Democrat and Conservative coalition.

<span class="mw-page-title-main">2015 Bath and North East Somerset Council election</span> 2015 UK local government election

The 2015 Bath and North East Somerset Council election took place on 7 May 2015 to elect members of Bath and North East Somerset Council in England. This coincided with other local elections and the 2015 general election.

<span class="mw-page-title-main">2019 Bath and North East Somerset Council election</span> 2019 local election in Bath and North East Somerset

The 2019 Bath and North East Somerset Council election was held on 2 May 2019 to elect members of Bath and North East Somerset Council in England.

<span class="mw-page-title-main">2023 Bath and North East Somerset Council election</span> English local election

The 2023 Bath and North East Somerset Council election was held on 4 May 2023 to elect members of Bath and North East Somerset Council in England

<span class="mw-page-title-main">Frome and East Somerset (UK Parliament constituency)</span> Proposed UK Parliament constituency

Frome and East Somerset is a proposed constituency of the House of Commons in the UK Parliament. Further to the completion of the 2023 Periodic Review of Westminster constituencies, it will first be contested at the next general election.

References

  1. "Local Election — Thursday, 5th May, 2011". Bath and North East Somerset Council. Retrieved 27 April 2013.
  2. "Abbey Ward". Bath and North East Somerset Council. Retrieved 5 August 2019.
  3. "Bathavon North". Bath and North East Somerset Council. Retrieved 5 August 2019.
  4. "Bathavon South". Bath and North East Somerset Council. Retrieved 5 August 2019.
  5. "Bathavon West". Bath and North East Somerset Council. Retrieved 5 August 2019.
  6. "Bathwick". Bath and North East Somerset Council. Retrieved 5 August 2019.
  7. "Chew Valley North". Bath and North East Somerset Council. Retrieved 5 August 2019.
  8. "Chew Valley South". Bath and North East Somerset Council. Retrieved 5 August 2019.
  9. "Clutton". Bath and North East Somerset Council. Retrieved 5 August 2019.
  10. "Combe Down". Bath and North East Somerset Council. Retrieved 5 August 2019.
  11. "Farmborough". Bath and North East Somerset Council. Retrieved 5 August 2019.
  12. "High Littleton". Bath and North East Somerset Council. Retrieved 5 August 2019.
  13. "Keynsham East". Bath and North East Somerset Council. Retrieved 5 August 2019.
  14. "Keynsham North". Bath and North East Somerset Council. Retrieved 5 August 2019.
  15. "Keynsham South". Bath and North East Somerset Council. Retrieved 5 August 2019.
  16. "Kingsmead". Bath and North East Somerset Council. Retrieved 5 August 2019.
  17. "Lambridge". Bath and North East Somerset Council. Retrieved 5 August 2019.
  18. "Lansdown". Bath and North East Somerset Council. Retrieved 5 August 2019.
  19. "Lyncombe". Bath and North East Somerset Council. Retrieved 5 August 2019.
  20. "Mendip". Bath and North East Somerset Council. Retrieved 5 August 2019.
  21. "Midsomer Norton North". Bath and North East Somerset Council. Retrieved 5 August 2019.
  22. "Midsomer Norton Redfield". Bath and North East Somerset Council. Retrieved 5 August 2019.
  23. "Newbridge". Bath and North East Somerset Council. Retrieved 5 August 2019.
  24. "Odd Down". Bath and North East Somerset Council. Retrieved 5 August 2019.
  25. "Oldfield". Bath and North East Somerset Council. Retrieved 5 August 2019.
  26. "Paulton". Bath and North East Somerset Council. Retrieved 5 August 2019.
  27. "Peasedown". Bath and North East Somerset Council. Retrieved 5 August 2019.
  28. "Publow with Whitchurch". Bath and North East Somerset Council. Retrieved 5 August 2019.
  29. "Radstock". Bath and North East Somerset Council. Retrieved 5 August 2019.
  30. "Saltford". Bath and North East Somerset Council. Retrieved 5 August 2019.
  31. "Southdown". Bath and North East Somerset Council. Retrieved 5 August 2019.
  32. "Timsbury". Bath and North East Somerset Council. Retrieved 5 August 2019.
  33. "Twerton". Bath and North East Somerset Council. Retrieved 5 August 2019.
  34. "Walcot". Bath and North East Somerset Council. Retrieved 5 August 2019.
  35. "Westfield". Bath and North East Somerset Council. Retrieved 5 August 2019.
  36. "Westmoreland". Bath and North East Somerset Council. Retrieved 5 August 2019.
  37. "Weston". Bath and North East Somerset Council. Retrieved 5 August 2019.
  38. "Widcombe". Bath and North East Somerset Council. Retrieved 5 August 2019.
  39. "Election results for Chew Valley North". Bath and North East Somerset Council. Retrieved 15 March 2020.
  40. "Election results for Bathavon North". Bath and North East Somerset Council. Retrieved 15 March 2020.