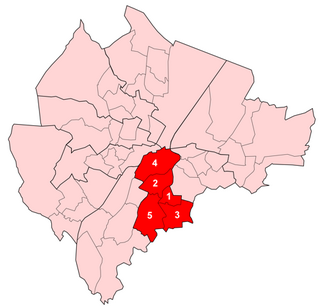
2011 Belfast City Council election

Last updated

2011 Belfast City Council election
Flag of Belfast.svg
  2005 5 May 2011 (2011-05-05) 2014  

All 51 seats to Belfast City Council
26 seats needed for a majority
 First partySecond partyThird party
 
Party Sinn Féin DUP SDLP
Seats won16158
Seat changeIncrease2.svg 2Steady2.svg 0Steady2.svg 0

 Fourth partyFifth partySixth party
 
Party Alliance Ulster Unionist PUP
Seats won632
Seat changeIncrease2.svg 2Decrease2.svg 4Steady2.svg 0

 Seventh party
 
Party Independent
Seats won1
Seat changeSteady2.svg 0

2011 Belfast City Council Election Map.png
2011 Belfast City Council Election Results, shaded by First Preference Votes.

Lord Mayor before election

Pat Convery
SDLP

Lord Mayor

Niall Ó Donnghaile
Sinn Féin

Elections to Belfast City Council were held on 5 May 2011 on the same day as the other Northern Irish local government elections. The election used nine district electoral areas to elect a total of 51 councillors, most representing the more heavily populated north and west.

Contents

Sinn Féin emerged as the largest party, and Niall Ó Donnghaile became Lord Mayor. [1]

Election results

Belfast Local Election Result 2011 [2]
PartySeatsGainsLossesNet gain/lossSeats %Votes %Votes+/−
  Sinn Féin 1631Increase2.svg231.430.928,234Increase2.svg0.1
  DUP 1511Steady2.svg029.423.421,353Decrease2.svg2.3
  SDLP 811Steady2.svg015.713.812,547Decrease2.svg3.3
  Alliance 620Increase2.svg211.812.611,540Increase2.svg5.8
  Ulster Unionist 304Decrease2.svg45.98.67,836Decrease2.svg5.2
  PUP 200Steady2.svg03.92.82,570Increase2.svg0.1
  Independent 100Steady2.svg02.01.41,283Increase2.svg0.4
  Éirígí 000Steady2.svg00.02.32,062New
  Green (NI) 000Steady2.svg00.01.41,320Increase2.svg0.6
  Workers' Party 000Steady2.svg00.00.8760Increase2.svg0.1
  Irish Republican Socialist 000Steady2.svg00.00.6588Increase2.svg0.6
  Socialist Party 000Steady2.svg00.00.5434Increase2.svg0.1
  People Before Profit 000Steady2.svg00.00.4321New
  TUV 000Steady2.svg00.00.4349New
  NI Conservatives 000Steady2.svg00.00.1103Decrease2.svg0.1

Note: "Votes" are the first preference votes.

Districts summary

[2]

Results of the Belfast City Council election, 2011
by district
Ward %
Cllrs
 %
Cllrs
 %
Cllrs
 %
Cllrs
 %
Cllrs
 %
Cllrs
 %
Cllrs
Total
Cllrs
Sinn Féin DUP SDLP Alliance UUP PUP Others
Balmoral14.7119.6129.0217.6115.110.003.906
Castle26.6230.5222.416.9011.810.001.706
Court2.8064.431.501.206.009.7114.415
Laganbank17.3114.1127.4219.0111.500.0010.805
Lower Falls75.440.0010.210.000.000.0014.405
Oldpark53.1325.4211.212.905.100.005.006
Pottinger11.3136.834.8019.918.3010.718.106
Upper Falls67.841.4018.111.300.000.0011.305
Victoria0.0032.631.5036.5317.916.505.107
Total30.91623.41513.8812.668.632.828.0151

District results

Balmoral

2005: 2 x SDLP, 2 x DUP, 1 x Alliance, 1 x UUP
2011: 2 x SDLP, 1 x DUP, 1 x Alliance, 1 x UUP, 1 x Sinn Féin
2005-2011 Change: Sinn Féin gain from DUP

Balmoral - 6 seats [3]
PartyCandidateFPv%Count
123456789
Alliance Tom Ekin *17.70%1,762        
DUP Ruth Patterson*15.60%1,553        
Sinn Féin Máirtín Ó Muilleoir 14.71%1,465        
SDLP Claire Hanna 14.49%1,443        
Ulster Unionist Bob Stoker *9.26%922961.27 961.69 972.57 997.17 1,296.56 1,296.74 1,789.74 
SDLP Bernie Kelly*7.09%706793.78 816.51 817.63 916.95 927.52 945.04 1,005.25 1,099.65
SDLP Niall Kelly7.46%743767.15 782.57 783.13 831.22 836.25 852.18 874.21 903.21
Ulster Unionist Jim Kirkpatrick*5.80%578655.91 660.75 665.71 693.72 817.05 817.14   
DUP Sharon Simpson3.98%396412.38 415.8 516.92 541.93     
Green (NI) Mark Simpson2.83%282349.41 400.34 403.3      
People Before Profit Andrew King1.07%107120.86        
Electorate: 18,752  Valid: 9,957 (53.10%)  Spoilt: 139  Quota: 1,423  Turnout: 10,096 (53.84%)  

    Castle

    2005: 2 x DUP, 2 x SDLP, 1 x Sinn Féin, 1 x UUP
    2011: 2 x DUP, 2 x Sinn Féin, 1 x SDLP, 1 x UUP
    2005-2011 Change: Sinn Féin gain from SDLP

    Castle - 6 seats [4]
    PartyCandidateFPv%Count
    123456
    DUP Lydia Patterson14.85%1,489     
    DUP Guy Spence9.44%946949 1,529   
    Sinn Féin Tierna Cunningham*13.74%1,3771,404 1,404 1,433  
    SDLP Patrick Convery*13.64%1,3671,399 1,404 1,606  
    Sinn Féin Mary Ellen Campbell12.90%1,2931,310 1,310 1,326 1,335 1,335
    Ulster Unionist David Browne *11.78%1,1811,185 1,211 1,332 1,345 1,440.04
    SDLP Cathal Mullaghan*8.81%883903 904 1,120 1,255 1,255.64
    Alliance David McKechnie6.87%689726 732    
    DUP Lee Reynolds6.27%629632     
    Workers' Party John Lavery1.70%170     
    Electorate: 19,494  Valid: 10,024 (51.42%)  Spoilt: 223  Quota: 1,433  Turnout: 10,247 (52.56%)  

      Court

      2005: 3 x DUP, 1 x PUP, 1 x Independent
      2011: 3 x DUP, 1 x PUP, 1 x Independent
      2005-2011 Change: No change

      Court - 5 seats [5]
      PartyCandidateFPv%Count
      12345
      DUP William Humphrey *40.05%2,643    
      DUP Brian Kingston 20.77%1,371    
      DUP Naomi Thompson3.59%2371,153.8   
      Independent Frank McCoubrey *11.42%754937.6 1,006.48 1,015.36 1,131.36
      PUP Hugh Smyth *9.70%640782.2 846.04 862.36 939.38
      Ulster Unionist Bobby McConnell5.98%395585.2 698.32 717.88 805.64
      Independent Raymond McCord3.02%199263.8 281.72 285.98  
      Sinn Féin Karol McKee2.79%184184.6 184.6 184.6  
      Alliance Mark Long1.18%78103.8 108.56 109.76  
      SDLP Conor McNeill1.50%99101.4 102.24 102.54  
      Electorate: 13,455  Valid: 6,600 (49.05%)  Spoilt: 170  Quota: 1,101  Turnout: 6,770 (50.32%)  

        Laganbank

        2005: 2 x SDLP, 1 x Sinn Féin, 1 x DUP, 1 x UUP
        2011: 2 x SDLP, 1 x Sinn Féin, 1 x DUP, 1 x Alliance
        2005-2011 Change: Alliance gain from UUP

        Laganbank - 5 seats [6]
        PartyCandidateFPv%Count
        1234
        Alliance Catherine Curran18.95%1,518   
        Sinn Féin Deirdre Hargey 17.27%1,383   
        SDLP Patrick McCarthy *16.99%1,361   
        DUP Christopher Stalford *14.06%1,1261,138.35 1,148.26 1,168.34
        SDLP Kate Mullan10.40%833893.06 978.44 1,281.83
        Ulster Unionist Michelle Bostock11.50%921952.46 959.11 1,013.43
        Green (NI) Clare Bailey 6.24%500557.59 727.74  
        People Before Profit Mark Hewitt1.80%144152.19   
        Socialist Party Paddy Meehan1.70%136139.25   
        Workers' Party Paddy Lynn1.10%8891.9   
        Electorate: 16,314  Valid: 8,010 (49.10%)  Spoilt: 171  Quota: 1,336  Turnout: 8,181 (50.15%)  

          Lower Falls

          2005: 5 x Sinn Féin
          2011: 4 x Sinn Féin, 1 x SDLP
          2005-2011 Change: SDLP gain from Sinn Féin

          Lower Falls - 5 seats [7]
          PartyCandidateFPv%Count
          12345
          Sinn Féin Janice Austin*19.66%1,920    
          Sinn Féin Steven Corr16.10%1,5721,583.85 1,603.85 1,618 1,677
          Sinn Féin Tom Hartley *15.99%1,5611,566.1 1,581.1 1,602.25 1,666.25
          Sinn Féin Jim McVeigh15.33%1,4971,499.7 1,531 1,544.15 1,600.45
          SDLP Colin Keenan10.24%1,0001,003.15 1,058.15 1,214.15 1,326.15
          Sinn Féin Breige Brownlee8.33%8131,070.7 1,109 1,123 1,188.3
          éirígí John McCusker6.63%647647.6 723.6 748.6  
          Workers' Party John Lowry4.08%398398.45 430.45   
          Irish Republican Socialist Jim Gorman2.14%209209.75    
          Socialist Party Pat Lawlor1.52%148148.5    
          Electorate: 17,238  Valid: 9,765 (56.65%)  Spoilt: 305  Quota: 1,628  Turnout: 10,070 (58.42%)  

            Oldpark

            2005: 3 x Sinn Féin, 1 x DUP, 1 x SDLP, 1 x UUP
            2011: 3 x Sinn Féin, 2 x DUP, 1 x SDLP
            2005-2011 Change: DUP gain from UUP

            Oldpark - 6 seats [8]
            PartyCandidateFPv%Count
            12345
            DUP Ian Crozier*16.31%1,770    
            Sinn Féin Conor Maskey14.49%1,573    
            DUP Gareth McKee8.45%9171,108.04 1,115.52 1,150.84 1,570.84
            Sinn Féin Gerard McCabe13.75%1,4921,492 1,510 1,514 1,568
            Sinn Féin Danny Lavery*12.62%1,3701,370.48 1,382.48 1,391.48 1,459.6
            SDLP Nichola Mallon 10.91%1,1841,185.56 1,217.68 1,334.68 1,430.48
            Sinn Féin Mary Clarke10.87%1,1801,180.12 1,189.12 1,203.12 1,255.12
            Ulster Unionist Fred Rodgers4.98%540551.76 556.76 613.12  
            Irish Republican Socialist Paul Little3.49%379379.24 398.24 406.24  
            Alliance James McClure2.79%303305.16 319.28   
            Independent Martin McAuley1.35%146146.84    
            Electorate: 22,408  Valid: 10,854 (48.44%)  Spoilt: 405  Quota: 1,551  Turnout: 11,259 (50.25%)  

              Pottinger

              2005: 3 x DUP, 1 x UUP, 1 x PUP, 1 x Alliance
              2011: 3 x DUP, 1 x Alliance, 1 x Sinn Féin, 1 x PUP
              2005-2011 Change: Sinn Féin gain from UUP

              Pottinger - 6 seats [9]
              PartyCandidateFPv%Count
              123456789
              Alliance Máire Hendron *19.89%1,895        
              DUP Gavin Robinson 15.99%1,523        
              Sinn Féin Niall Ó Donnghaile 11.31%1,0771,085.96 1,086.91 1,086.91 1,091.15 1,117.43 1,128.07 1,155.55 1,373.55
              PUP John Kyle10.73%1,0221,084.72 1,091.76 1,101.04 1,109.04 1,112.36 1,176.89 1,210.81 1,257.85
              DUP May Campbell*11.03%1,0511,085.24 1,110.76 1,117.19 1,120.05 1,121.05 1,167.41 1,196.81 1,206.01
              DUP Adam Newton9.83%936971.84 1,082.61 1,083.72 1,086.79 1,086.79 1,109.97 1,129.71 1,138.63
              Ulster Unionist Philip Robinson8.25%786871.76 884.74 890.13 894.09 896.41 964.04 1,007.9 1,048.01
              SDLP Séamas De Faoite4.79%456553.92 554.03 555.35 561.59 588.19 615.15 705.91  
              Green (NI) David Newman2.34%223353.88 355.31 360.23 394.11 413.99 480.99   
              TUV John Hiddleston2.01%191199.64 200.52 206.84 209.16 210.48    
              Socialist Party Tommy Black1.57%150163.12 163.67 165.07 177.67 190.27    
              Workers' Party Kevin McNally1.09%104111.68 111.79 115.43 125.31     
              People Before Profit Donna Marie McCusker0.73%7092.4 92.73 95.01      
              Independent Karl Hedley0.35%3342.28 42.83       
              Independent Samuel Smyth0.09%910.6 10.93       
              Electorate: 19,929  Valid: 9,526 (47.80%)  Spoilt: 190  Quota: 1,361  Turnout: 9,716 (48.75%)  

                Upper Falls

                2005: 4 x Sinn Féin, 1 x SDLP
                2011: 4 x Sinn Féin, 1 x SDLP
                2005-2011 Change: No change

                Upper Falls - 5 seats [10]
                PartyCandidateFPv%Count
                123
                Sinn Féin Matt Garrett18.00%2,250  
                Sinn Féin Gerard O'Neill*17.47%2,184  
                Sinn Féin Emma Groves17.07%2,133  
                SDLP Tim Attwood*16.12%2,0152,356 
                Sinn Féin Caoimhín Mac Giolla Mhín15.28%1,9101,952 2,009
                éirígí Pádraic Mac Coitir11.32%1,4151,428 1,474
                SDLP Helen Walsh2.00%250  
                DUP Eileen Kingston1.43%179  
                Alliance Dan McGuinness1.30%162  
                Electorate: 20,530  Valid: 12,498 (60.88%)  Spoilt: 298  Quota: 2,084  Turnout: 12,796 (62.33%)  

                  Victoria

                  2005: 3 x DUP, 2 x UUP, 2 x Alliance
                  2011: 3 x Alliance, 3 x DUP, 1 x UUP
                  2005-2011 Change: Alliance gain from UUP

                  Victoria - 7 seats [11]
                  PartyCandidateFPv%Count
                  12345678910
                  DUP Robin Newton *16.62%2,338         
                  Alliance Mervyn Jones*16.49%2,319         
                  Alliance Laura McNamee11.92%1,6771,686.5 2,049.14       
                  Alliance Andrew Webb8.08%1,1371,143 1,293.48 1,541.24 1,552.24 1,592.1 1,604.1 1,895.1  
                  Ulster Unionist Jim Rodgers *9.63%1,3551,401.5 1,407.98 1,418.81 1,437.81 1,451.62 1,488.87 1,639.24 1,657.24 1,816.24
                  DUP Tom Haire10.22%1,4371,555.5 1,558.62 1,562.04 1,565.04 1,568.53 1,584.97 1,617.21 1,622.21 1,759.21
                  DUP John Hussey5.77%8121,149 1,151.64 1,154.11 1,158.11 1,166.36 1,184.86 1,210.54 1,217.54 1,476.12
                  Ulster Unionist Ian Adamson*6.70%942955.25 962.69 967.25 989.5 1,003.69 1,028.19 1,112.99 1,131.9 1,228.49
                  PUP Robert McCartney6.46%908926.75 930.59 932.68 938.68 946.87 963.37 1,005.54 1,028.54  
                  Green (NI) Ross Campbell2.24%315317.25 322.53 325.95 334.14 353.14 359.14    
                  Ulster Unionist Stephen Warke1.54%216222.5 224.42 226.32 232.51 237.51 246.51    
                  SDLP Magdalena Wolska1.47%207207.5 211.58 215.76 217.76 222 223    
                  TUV Sammy Morrison1.12%158160.25 160.25 161.01 162.01 175.01     
                  Independent Roy Hobson1.01%142143.75 145.43 147.14 158.39      
                  NI Conservatives Garry Crosbie0.73%103103.5 103.5 104.07       
                  Electorate: 25,814  Valid: 14,066 (54.49%)  Spoilt: 280  Quota: 1,759  Turnout: 14,346 (55.57%)  

                    Related Research Articles

                    <span class="mw-page-title-main">Laganbank (District Electoral Area)</span> Human settlement in Northern Ireland

                    Laganbank was one of the nine district electoral areas in Belfast, Northern Ireland which existed from 1985 to 2014. Located in the south of the city, the district elected five members to Belfast City Council and contained the wards of Ballynafeigh, Botanic, Shaftesbury, Stranmillis, and Rosetta. Laganbank, along with neighbouring Balmoral, formed the greater part of the Belfast South constituencies for the Northern Ireland Assembly and UK Parliament.

                    <span class="mw-page-title-main">Oldpark (District Electoral Area)</span>

                    Oldpark is one of the ten district electoral areas (DEA) in Belfast, Northern Ireland. Located in the north of the city, the district elects six members to Belfast City Council and contains the wards of Ardoyne; Ballysillan; Cliftonville; Legoniel; New Lodge and Water Works. Oldpark forms part of the Belfast North constituency for the Northern Ireland Assembly and UK Parliament.
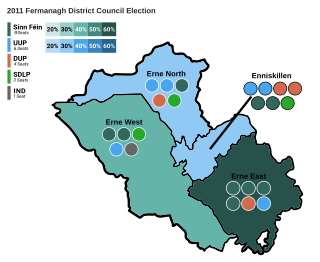
                    <span class="mw-page-title-main">2011 Fermanagh District Council election</span> Local government election in Northern Ireland

                    Elections to Fermanagh District Council were held on 5 May 2011 on the same day as the other Northern Irish local government elections. The election used four district electoral areas to elect a total of 23 councillors.

                    <span class="mw-page-title-main">2005 Belfast City Council election</span>

                    Elections to Belfast City Council were held on 5 May 2005 on the same day as the other Northern Irish local government elections. The election used nine district electoral areas to elect a total of 51 councillors, most representing the more heavily populated north and west.
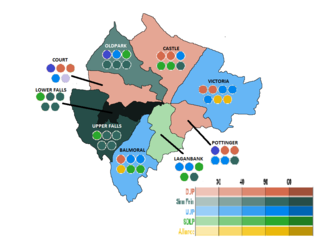
                    <span class="mw-page-title-main">2001 Belfast City Council election</span> Northern Ireland local election

                    Elections to Belfast City Council were held on 7 June 2001 on the same day as the other Northern Irish local government elections. The election used nine district electoral areas to elect a total of 51 councillors, most representing the more heavily populated north and west.

                    Elections to Belfast City Council were held on 21 May 1997 on the same day as the other Northern Irish local government elections. The election used nine district electoral areas to elect a total of 51 councillors, most representing the more heavily populated north and west.

                    Elections to Belfast City Council were held on 19 May 1993 on the same day as the other Northern Irish local government elections. The election used nine district electoral areas to elect a total of 51 councillors, most representing the more heavily populated north and west.

                    Elections to Belfast City Council were held on 17 May 1989 on the same day as the other Northern Irish local government elections. The election used nine district electoral areas to elect a total of 51 councillors, most representing the more heavily populated north and west.

                    Elections to Lisburn City Council were held on 5 May 2011 on the same day as the other Northern Irish local government elections. The election used five district electoral areas to elect a total of 30 councillors.

                    Elections to Newtownabbey Borough Council were held on 5 May 2011 on the same day as the other Northern Irish local government elections. The election used four district electoral areas to elect a total of 25 councillors.
                    <span class="mw-page-title-main">2011 Antrim Borough Council election</span> Local government election in Northern Ireland

                    Elections to Antrim Borough Council were held on 5 May 2011 on the same day as the other Northern Irish local government elections. The election used three district electoral areas to elect a total of 19 councillors.

                    Elections to Larne Borough Council were held on 5 May 2011 on the same day as the other Northern Irish local government elections. The election used three district electoral areas to elect a total of 15 councillors.

                    Elections to Ballymena Borough Council were held on 5 May 2011 on the same day as the other Northern Irish local government elections. The election used four district electoral areas to elect a total of 24 councillors.

                    Elections to Coleraine Borough Council were held on 5 May 2011 on the same day as the other Northern Irish local government elections. The election used four district electoral areas to elect a total of 22 councillors.

                    Elections to Craigavon Borough Council were held on 5 May 2011 on the same day as the other Northern Irish local government elections. The election used four district electoral areas to elect a total of 26 councillors.

                    Elections to Banbridge District Council were held on 5 May 2011 on the same day as the other Northern Irish local government elections. The election used three district electoral areas to elect a total of 17 councillors.

                    Elections to Armagh City and District Council were held on 5 May 2011 on the same day as the other Northern Irish local government elections. The election used four district electoral areas to elect a total of 22 councillors.

                    Elections to Down District Council were held on 5 May 2011 on the same day as the other Northern Irish local government elections. The election used four district electoral areas to elect a total of 23 councillors.

                    Elections to Newry and Mourne District Council were held on 5 May 2011 on the same day as the other Northern Irish local government elections. The election used five district electoral areas to elect a total of 30 councillors.

                    Antrim Line was one of the district electoral areas in Newtownabbey, Northern Ireland which existed from 1985 to 2014, one of five DEAs until 1993 and one of four DEAs until 2014. The district elected five members to Newtownabbey Borough Council until 1993 and seven members until 2014, and formed part of the South Antrim constituencies for the Northern Ireland Assembly and UK Parliament and part of the Belfast North constituencies for the Northern Ireland Assembly and UK Parliament.

                    References

                    1. "Niall Ó Donnghaile's year in mayoral chains". 3 November 2012. Retrieved 23 February 2014.
                    2. 1 2 "Belfast Council results". 11 May 2011. Retrieved 23 February 2014.
                    3. "Balmoral Result Sheet" (PDF). EONI. Retrieved 8 July 2021.
                    4. "Castle Result Sheet" (PDF). EONI. Retrieved 8 July 2021.
                    5. "Court Result Sheet" (PDF). EONI. Retrieved 8 July 2021.
                    6. "Laganbank Result Sheet" (PDF). EONI. Retrieved 8 July 2021.
                    7. "Lower Falls Result Sheet" (PDF). EONI. Retrieved 8 July 2021.
                    8. "Oldpark Result Sheet" (PDF). EONI. Retrieved 8 July 2021.
                    9. "Pottinger Result Sheet" (PDF). EONI. Retrieved 8 July 2021.
                    10. "Upper Falls Result Sheet" (PDF). EONI. Retrieved 8 July 2021.
                    11. "Victoria Result Sheet" (PDF). EONI. Retrieved 8 July 2021.