Pottinger (District Electoral Area)

Last updated

Pottinger
District Electoral Area
Pottinger Wards.png
Map showing Pottinger wards within Belfast
Area6.17 km2 (2.38 sq mi)
Population31,272 (2008 Estimate)
  Density 5,068/km2 (13,130/sq mi)
District
County
Country Northern Ireland
Sovereign state United Kingdom
UK Parliament
NI Assembly
List of places
UK
Northern Ireland
Antrim

Pottinger was one of the nine district electoral areas (DEA) in Belfast, Northern Ireland from 1985 to 2014. Located in the east of the city, the district elected six members to Belfast City Council and contained the wards of Ballymacarrett, Bloomfield, Orangefield, Ravenhill, The Mount, and Woodstock.

Contents

The wards of Ravenhill and Woodstock were part of the Belfast South constituencies for the Northern Ireland Assembly and UK Parliament, while the other four were part of the Belfast East Assembly and Parliamentary constituencies.

The district was bounded to the west by the River Lagan and the Ormeau Road, to the north by the Newtownards Road, to the east by Greenville Park and North Road and the Borough of Castlereagh to the south.

At the 2001 census the district had a Protestant majority, however there was also a large Catholic minority, particularly in areas such as the Short Strand, which is separated from the mainly unionist Cluan Place by one of the many peace lines in the district.

History

The DEA was created for the 1985 local elections, when it largely replaced the former electoral Area A. Five of the six wards came from Area A with the Bloomfield ward added from Area B. It was abolished for the 2014 local elections, when all of its wards except Orangefield formed part of a new Titanic district electoral area. The Orangefield ward became part of a new Lisnasharragh district electoral area.

Amenities

New stand at the Ravenhill Stadium, home of the Ulster Rugby team. Ravenhill new Stand.jpg
New stand at the Ravenhill Stadium, home of the Ulster Rugby team.

Amenities in the Pottinger district electoral area include:

Wards

MapWardPopulation
(2011 Census)
CatholicProtestantOtherNo ReligionAreaDensity NI Assembly UK Parliament Ref
1 Ballymacarrett 4,90851.4%41.2%1.4%6.2%0.78 km26,292 /km2 Belfast East Belfast East [1]
2Bloomfield5,45316.1%69.7%1.7%12.5%0.74 km27,369 /km2 Belfast East Belfast East [2]
3Orangefield5,61911%77%1.4%10.6%1.46 km23,849 /km2 Belfast East Belfast East [3]
4Ravenhill6,04139.7%46.9%2%11.5%1.88 km23,213 /km2 Belfast South Belfast South [4]
5The Mount5,59116.1%68.3%1.3%14.3%0.75 km27,455 /km2 Belfast East Belfast East [5]
6Woodstock5,44519.4%63.3%2.8%14.5%0.56 km29,723 /km2 Belfast South Belfast South [6]
Pottinger33,05725.3%61.2%1.8%11.7%6.17 km25,358 /km2

Councillors

Gate in the peace line to enter the Short Strand. Welcome to Short Strand.jpg
Gate in the peace line to enter the Short Strand.
ElectionCouncillor
(Party)
Councillor
(Party)
Councillor
(Party)
Councillor
(Party)
Councillor
(Party)
Councillor
(Party)
2011 Máire Hendron
(Alliance)
Niall Ó Donnghaile
(Sinn Féin)
Adam Newton
(DUP)
May Campbell
(DUP)
Gavin Robinson
(DUP)
John Kyle
(PUP)
2005 Reg Empey
(UUP)
Margaret McKenzie
(DUP)
Sammy Wilson
(DUP)
David Ervine
(PUP)
2001 Joseph O'Donnell
(Sinn Féin)
Margaret Clarke
(UUP)
Harry Toan
(DUP)
1997 Mervyn Jones
(Alliance)
Robert Cleland
(DUP)
1993 Sandy Blair
(UUP)
Jim Walker
(DUP)
1989 Margaret Clarke
(UUP)
Dorothy Dunlop
(Independent Unionist)
1985 Frank Leslie
(DUP)

2011 Election

2005: 3 x DUP, 1 x UUP, 1 x PUP, 1 x Alliance

2011: 3 x DUP, 1 x Alliance, 1 x Sinn Féin, 1 x PUP

2005-2011 Change: Sinn Féin gain from UUP

Pottinger - 6 seats [7]
PartyCandidateFPv%Count
123456789
Alliance Máire Hendron *19.89%1,895        
DUP Gavin Robinson 15.99%1,523        
Sinn Féin Niall Ó Donnghaile 11.31%1,0771,085.96 1,086.91 1,086.91 1,091.15 1,117.43 1,128.07 1,155.55 1,373.55
PUP John Kyle10.73%1,0221,084.72 1,091.76 1,101.04 1,109.04 1,112.36 1,176.89 1,210.81 1,257.85
DUP May Campbell*11.03%1,0511,085.24 1,110.76 1,117.19 1,120.05 1,121.05 1,167.41 1,196.81 1,206.01
DUP Adam Newton9.83%936971.84 1,082.61 1,083.72 1,086.79 1,086.79 1,109.97 1,129.71 1,138.63
Ulster Unionist Philip Robinson8.25%786871.76 884.74 890.13 894.09 896.41 964.04 1,007.9 1,048.01
SDLP Séamas De Faoite4.79%456553.92 554.03 555.35 561.59 588.19 615.15 705.91  
Green (NI) David Newman2.34%223353.88 355.31 360.23 394.11 413.99 480.99   
TUV John Hiddleston2.01%191199.64 200.52 206.84 209.16 210.48    
Socialist Party Tommy Black1.57%150163.12 163.67 165.07 177.67 190.27    
Workers' Party Kevin McNally1.09%104111.68 111.79 115.43 125.31     
People Before Profit Donna Marie McCusker0.73%7092.4 92.73 95.01      
Independent Karl Hedley0.35%3342.28 42.83       
Independent Samuel Smyth0.09%910.6 10.93       
Electorate: 19,929  Valid: 9,526 (47.80%)  Spoilt: 190  Quota: 1,361  Turnout: 9,716 (48.75%)  

    2005 Election

    2001: 3 x DUP, 1 x UUP, 1 x PUP, 1 x Alliance

    2005: 2 x DUP, 2 x UUP, 1 x PUP, 1 x Sinn Féin

    2001-2005 Change: DUP and Alliance gain from UUP and Sinn Féin

    Pottinger - 6 seats [8]
    PartyCandidateFPv%Count
    123456
    DUP Sammy Wilson *22.60%2,385     
    Ulster Unionist Reg Empey *18.65%1,968     
    DUP May Campbell12.34%1,3021,530.29    
    PUP David Ervine *10.95%1,1561,248.87 1,324.71 1,394.99 1,556.39 
    DUP Margaret McKenzie6.79%7171,216.13 1,239.89 1,281.08 1,451.42 1,461.25
    Alliance Máire Hendron 7.53%795800.92 830.92 895.09 1,008.55 1,428.28
    Sinn Féin Deborah Devenny8.94%944944 947.84 967.84 969.84 1,126.08
    SDLP Mary Muldoon6.35%670672.22 677.26 743.18 766.22  
    Ulster Unionist Sonia Copeland2.62%277303.64 524.92 644.92   
    Socialist Party Tommy Black1.57%163165.96 168.36    
    Workers' Party Joseph Bell0.99%105105.74 106.74    
    Ulster Unionist Henry Wallace0.68%7285.69 180.25    
    Electorate: 19,621  Valid: 10,554 (53.79%)  Spoilt: 381  Quota: 1,508  Turnout: 10,935 (55.73%)  

      2001 Election

      1997: 2 x DUP, 2 x UUP, 1 x PUP, 1 x Sinn Féin

      2001: 2 x DUP, 2 x UUP, 1 x PUP, 1 x Alliance

      1997-2001 Change: Sinn Féin gain from Alliance

      Pottinger - 6 seats [9]
      PartyCandidateFPv%Count
      12345678910
      DUP Sammy Wilson *30.21%3,918         
      Ulster Unionist Reg Empey *23.88%3,097         
      PUP David Ervine *12.20%1,5821,748.42 2,005.46       
      Ulster Unionist Margaret Clarke*4.31%559621.01 1,279.99 1,338.86 1,366.14 1,398.3 1,406.09 1,508.73 1,524.67 1,892.91
      Sinn Féin Joseph O'Donnell9.75%1,2641,264 1,265.68 1,266.26 1,267.26 1,268.26 1,285.26 1,287.26 1,451.29 1,567.85
      DUP Harry Toan1.58%2051,377.89 1,430.39 1,440.54 1,445.54 1,475.47 1,477.47 1,529.03 1,532.03 1,552.64
      DUP Mary Campbell4.45%5771,146.22 1,196.62 1,204.16 1,209.37 1,232.61 1,236.56 1,297.52 1,302.59 1,328.67
      Alliance Mervyn Jones*5.34%693702.01 801.13 825.2 842.04 845.14 881.27 929.43 1,189.34  
      SDLP Leo Van Es3.54%459463.24 514.06 518.41 518.41 518.41 554.41 561.83   
      Independent John Bushell1.68%218236.55 254.19 259.7 262.12 268.5 283.98    
      PUP Robin Stewart0.97%127132.3 141.12 163.16 168.29 175.43 177.43    
      Workers' Party Joseph Bell0.99%129131.65 134.59 136.04 138.33 140.33     
      UK Unionist David Fairfield0.57%7494.14 118.5 127.49 135.57      
      NI Conservatives Jason Docherty0.51%6670.24 89.56 93.91       
      Electorate: 21,854  Valid: 12,968 (59.34%)  Spoilt: 458  Quota: 1,853  Turnout: 13,426 (61.43%)  

        1997 Election

        1993: 3 x DUP, 2 x UUP, 1 x Alliance

        1997: 2 x DUP, 2 x UUP, 1 x PUP, 1 x Alliance

        1993-1997 Change: PUP gain from DUP

        Pottinger - 6 seats [10]
        PartyCandidateFPv%Count
        123456789101112
        Ulster Unionist Reg Empey *20.32%2,309           
        DUP Sammy Wilson *19.94%2,265           
        PUP David Ervine 18.57%2,110           
        Ulster Unionist Margaret Clarke6.76%7681,265.55 1,309.63 1,340.83 1,345 1,347.62 1,358.2 1,385.31 1,387.1 1,625.38  
        DUP Robert Cleland*5.33%605636.62 822.22 847.18 852.58 852.58 856.87 889.14 889.43 928.08 1,324.88 1,536.14
        Alliance Mervyn Jones*7.66%870886.74 892.83 906.51 913.8 937.04 1,004.94 1,013.63 1,218.16 1,237.87 1,241.33 1,306.26
        Sinn Féin Dominic Corr8.61%978978 978 978 978 992 996 996 1,100.29 1,100.29 1,100.29 1,102.25
        PUP Alexander Gordon2.31%262281.84 298.37 615.65 622.49 625.97 641.61 692.25 699.49 723.33 763.61  
        DUP Frank Leslie1.25%142160.91 487.45 504.49 506.78 506.78 510.91 545.02 546.02 567.76   
        Ulster Unionist Alexander Blair*2.21%251320.75 338.73 356.49 360.07 372.31 377.1 395.04 398.35    
        SDLP Marga Foley2.72%309310.55 311.42 312.14 315.14 349.14 384.38 384.38     
        Ulster Democratic Robert Girvan1.49%169188.53 210.57 255.69 263.55 267.03 271.03      
        NI Women's Coalition Pearl Sagar1.31%149151.48 153.22 160.66 173.95 182.43       
        Workers' Party Joseph Bell1.01%115115.62 115.91 118.79 124.34        
        Ulster Independence Josephine Challis0.18%2123.48 24.93 26.13         
        Labour Coalition Sean McGouran0.17%1919 20.45 20.69         
        Natural Law David Collins0.17%1919.31 19.6 19.84         
        Electorate: 21,854  Valid: 12,968 (59.34%)  Spoilt: 458  Quota: 1,853  Turnout: 13,426 (61.43%)  

          1993 Election

          1989: 2 x DUP, 2 x UUP, 1 x Alliance, 1 Independent Unionist

          1993: 3 x DUP, 2 x UUP, 1 x Alliance

          1989-1993 Change: DUP gain from Independent Unionist

          Pottinger - 6 seats [11]
          PartyCandidateFPv%Count
          12345678
          DUP Sammy Wilson *25.52%2,784       
          Alliance Mervyn Jones*12.99%1,4171,427.35 1,461.35 1,476.15 1,700.15   
          DUP Jim Walker*7.27%7931,476.55 1,478.55 1,549.15 1,566.15   
          Ulster Unionist Reg Empey *11.87%1,2951,380.95 1,381.95 1,408.8 1,418.8 1,428.8 1,612.8 
          DUP Robert Cleland9.00%9821,252.45 1,254.45 1,307.9 1,324.8 1,326.8 1,379.45 1,388.45
          Ulster Unionist Alexander Blair8.22%897919.05 921.05 931.95 960.3 979.3 1,070.15 1,080.15
          Ulster Unionist Margaret Clarke*6.91%754778.75 782.2 790.1 802.55 807.55 926.65 939.65
          Sinn Féin Joseph O'Donnell6.50%709709 713 714 754 769 771  
          NI Conservatives Dorothy Dunlop*4.93%538574 580 595.15 624.15 644.15   
          Independent Labour Colin Ballentine2.48%271273.25 297.25 305.25     
          Workers' Party Joseph Bell2.08%227228.35 240.35 243.8     
          Ind. Unionist Samuel Walker1.22%133214.9 216.9      
          Green (NI) Thaddeus Bradley0.98%107108.35       
          Electorate: 24,293  Valid: 10,907 (44.90%)  Spoilt: 482  Quota: 1,559  Turnout: 11,389 (46.89%)  

            1989 Election

            1985: 3 x DUP, 2 x UUP, 1 x Alliance

            1989: 2 x DUP, 2 x UUP, 1 x Alliance, 1 Independent Unionist

            1985-1989 Change: Independent Unionist gain from DUP

            Pottinger - 6 seats [12]
            PartyCandidateFPv%Count
            123456
            DUP Sammy Wilson *25.88%2,780     
            Ulster Unionist Margaret Clarke*13.78%1,4801,524.55 1,537.55   
            Alliance Mervyn Jones*12.07%1,2961,309.05 1,314.3 1,326.75 1,599.75 
            DUP Jim Walker*4.59%4931,268.35 1,479.35 1,531.7 1,546.7 
            Ind. Unionist Dorothy Dunlop 10.98%1,1791,225.8 1,245.75 1,313.9 1,344.35 1,357.35
            Ulster Unionist Reg Empey *8.04%864921.15 942.1 1,210.2 1,220.2 1,226.2
            DUP Frank Leslie*7.15%768900.3 1,015 1,044.05 1,056.5 1,064.4
            Sinn Féin Joseph O'Donnell5.86%629629.45 631.9 631.9 677.9  
            Workers' Party Sean Flanagan5.04%541543.7 546.7 548.7   
            Ulster Unionist David McNutt3.91%420447 457.15    
            DUP John Norris2.45%263381.8     
            National Front Stuart McCullough0.25%2729.7     
            Electorate: 24,265  Valid: 10,740 (44.26%)  Spoilt: 508  Quota: 1,535  Turnout: 11,248 (46.35%)  

              1985 Election

              1985: 3 x DUP, 2 x UUP, 1 x Alliance

              Pottinger - 6 seats [13]
              PartyCandidateFPv%Count
              12345678
              DUP Sammy Wilson *19.99%2,454       
              DUP Frank Leslie18.11%2,224       
              Ulster Unionist Margaret Clarke16.28%1,999       
              DUP Jim Walker9.39%1,1531,763.12      
              Ulster Unionist Reg Empey 9.10%1,1171,143.6 1,442.8 1,630.12 1,659.16 1,660.5 1,756.5 
              Alliance Mervyn Jones8.30%1,0191,026.56 1,039.48 1,044.64 1,127.4 1,272.74 1,309.88 1,547.28
              Ulster Unionist Harry Fletcher3.51%431449.2 546.1 569.38 594.16 595.16 706.38 727.66
              Sinn Féin Joseph O'Donnell4.61%566566 566 566 572.28 634.6 635.6 713.42
              Workers' Party Francis Cullen2.47%303304.12 306.5 312.02 398.48 496.48 514.94  
              PUP David Ervine 3.21%394402.12 442.58 448.1 459.68 460.68   
              SDLP Carmel Maginness2.77%340340.28 342.32 342.32 353.66    
              Labour and Trade Union Stan Dempsey1.78%218219.68 227.16 232.44     
              Communist Party James Stewart 0.25%6164.08 66.8 67.16     
              Electorate: 24,757  Valid: 12,279 (49.60%)  Spoilt: 506  Quota: 1,755  Turnout: 12,785 (51.64%)  

                See also

                Related Research Articles

                <span class="mw-page-title-main">Belfast South (UK Parliament constituency)</span> Parliamentary constituency in the United Kingdom, 1885–1918 and since 1922

                Belfast South is a parliamentary constituency in the United Kingdom House of Commons. The current MP is Claire Hanna of the SDLP.

                <span class="mw-page-title-main">Balmoral (District Electoral Area)</span>

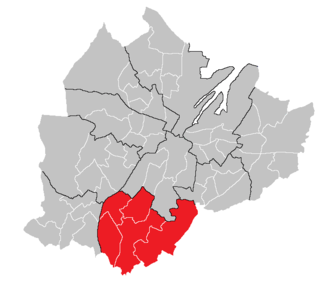
                Balmoral is the most southern of ten district electoral areas (DEA) in Belfast, Northern Ireland. The district elects five members to Belfast City Council and contains the wards of Belvoir; Finaghy; Malone; Musgrave; Windsor; and Upper Malone. Balmoral, along with neighbouring Botanic, forms the greater part of the Belfast South constituencies for the Northern Ireland Assembly and UK Parliament.

                <span class="mw-page-title-main">Castle (District Electoral Area)</span> District Electoral Area in Belfast, Northern Ireland

                Castle is one of the ten district electoral areas in Belfast, Northern Ireland. Located in the north of the city, the district elects six members to Belfast City Council and contains the wards of Bellevue, Cavehill, Chichester Park, Duncairn, Fortwilliam and Innisfayle. Castle, along with Oldpark district and parts of the Court district and Newtownabbey Borough Council, forms the Belfast North constituency for the Northern Ireland Assembly and UK Parliament. The district is bounded to the east by the Victoria Channel, to the north by Newtownabbey Borough Council and Belfast Lough, to the south by North Street and to the west by the Cavehill Road.

                <span class="mw-page-title-main">Court (District Electoral Area)</span>

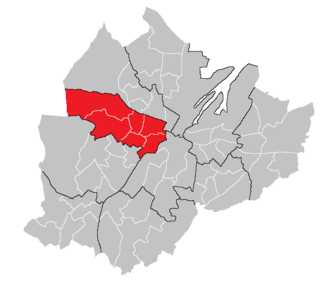
                Court is one of the ten district electoral areas (DEA) in Belfast, Northern Ireland. Located in the north and west of the city, the district elects six members to Belfast City Council and contains the wards of Ballygomartin, Clonard, Falls, Forth River, Shankill, and Woodvale. Court is split between the Belfast North and Belfast West constituencies for the Northern Ireland Assembly and UK Parliament.

                <span class="mw-page-title-main">Laganbank (District Electoral Area)</span> Human settlement in Northern Ireland

                Laganbank was one of the nine district electoral areas in Belfast, Northern Ireland which existed from 1985 to 2014. Located in the south of the city, the district elected five members to Belfast City Council and contained the wards of Ballynafeigh, Botanic, Shaftesbury, Stranmillis, and Rosetta. Laganbank, along with neighbouring Balmoral, formed the greater part of the Belfast South constituencies for the Northern Ireland Assembly and UK Parliament.

                <span class="mw-page-title-main">Oldpark (District Electoral Area)</span>

                Oldpark is one of the ten district electoral areas (DEA) in Belfast, Northern Ireland. Located in the north of the city, the district elects six members to Belfast City Council and contains the wards of Ardoyne; Ballysillan; Cliftonville; Legoniel; New Lodge and Water Works. Oldpark forms part of the Belfast North constituency for the Northern Ireland Assembly and UK Parliament.

                <span class="mw-page-title-main">Victoria (District Electoral Area)</span> Electoral division in east Belfast, Northern Ireland

                Victoria was one of the nine district electoral areas (DEA) in Belfast, Northern Ireland, from 1985 to 2014, when it was mostly replaced by the Ormiston district.

                <span class="mw-page-title-main">2011 Belfast City Council election</span>

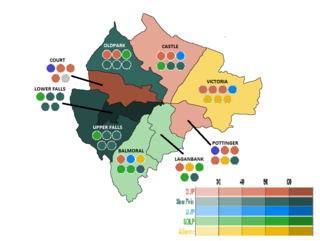
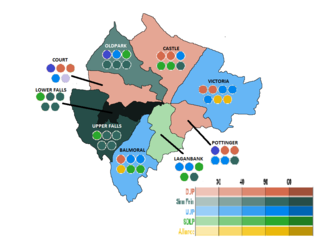
                Elections to Belfast City Council were held on 5 May 2011 on the same day as the other Northern Irish local government elections. The election used nine district electoral areas to elect a total of 51 councillors, most representing the more heavily populated north and west.

                Titanic is one of the ten district electoral areas (DEA) in Belfast, Northern Ireland. Located in the east of the city, the district elects six members to Belfast City Council and contains the wards of Ballymacarrett, Beersbridge, Bloomfield, Connswater, Sydenham and Woodstock. Titanic, along with wards from the neighbouring Ormiston and Lisnasharragh DEAs, together with parts of Lisburn and Castlereagh District Council, form the Belfast East constituency for the Northern Ireland Assembly and UK Parliament.

                Lisnasharragh is one of the ten district electoral areas (DEA) in Belfast, Northern Ireland. The district elects six members to Belfast City Council and contains the wards of Cregagh; Hillfoot; Merok; Orangefield; Ravenhill and Rosetta. Lisnasharragh forms part of the Belfast South and Belfast East constituencies for the Northern Ireland Assembly and UK Parliament.

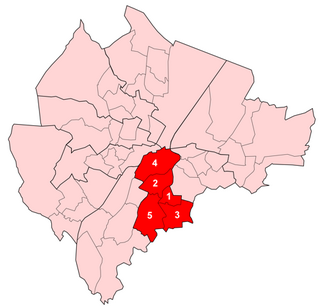
                Area A was one of the eight district electoral areas (DEA) which existed in Belfast, Northern Ireland from 1973 to 1985. Located in the south-east of the city, the district elected seven members to Belfast City Council and contained the wards of Ballymacarrett; Ballynafeigh; Orangefield; Ormeau; Rosetta; The Mount and Willowfield. The DEA formed part of the Belfast South and Belfast East constituencies.

                <span class="mw-page-title-main">2001 Belfast City Council election</span> Northern Ireland local election

                Elections to Belfast City Council were held on 7 June 2001 on the same day as the other Northern Irish local government elections. The election used nine district electoral areas to elect a total of 51 councillors, most representing the more heavily populated north and west.

                Elections to Belfast City Council were held on 21 May 1997 on the same day as the other Northern Irish local government elections. The election used nine district electoral areas to elect a total of 51 councillors, most representing the more heavily populated north and west.

                Elections to Belfast City Council were held on 19 May 1993 on the same day as the other Northern Irish local government elections. The election used nine district electoral areas to elect a total of 51 councillors, most representing the more heavily populated north and west.

                Elections to Belfast City Council were held on 17 May 1989 on the same day as the other Northern Irish local government elections. The election used nine district electoral areas to elect a total of 51 councillors, most representing the more heavily populated north and west.

                Elections to Belfast City Council were held on 15 May 1985 on the same day as the other Northern Irish local government elections. The election used nine district electoral areas to elect a total of 51 councillors, most representing the more heavily populated north and west.

                Dunmurry Cross was one of the district electoral areas in Lisburn, Northern Ireland which existed from 1985 to 2014. It was one of four Lisburn DEAs until 1993, and one of five until 2014. The district elected seven members to Lisburn City Council and formed part of Belfast West constituencies for the Northern Ireland Assembly and UK Parliament and part of the Lagan Valley constituencies for the Northern Ireland Assembly and UK Parliament.

                Antrim Line was one of the district electoral areas in Newtownabbey, Northern Ireland which existed from 1985 to 2014, one of five DEAs until 1993 and one of four DEAs until 2014. The district elected five members to Newtownabbey Borough Council until 1993 and seven members until 2014, and formed part of the South Antrim constituencies for the Northern Ireland Assembly and UK Parliament and part of the Belfast North constituencies for the Northern Ireland Assembly and UK Parliament.

                Antrim South East was one of the three district electoral areas in Antrim, Northern Ireland which existed from 1985 to 2014. The district elected seven members to Antrim Borough Council and formed part of the South Antrim constituencies for the Northern Ireland Assembly and UK Parliament.

                Waterside is one of the seven district electoral areas (DEA) in Derry and Strabane, Northern Ireland. The district elects seven members to Derry and Strabane District Council and contains the wards of Caw, Clondermot, Drumahoe, Ebrington, Kilfennan, Lisnagelvin and Victoria. Waterside forms part of the Foyle constituencies for the Northern Ireland Assembly and UK Parliament.

                References

                1. "Ward Information for Ballymacarrett ward 95GG04". NISRA. Retrieved 22 December 2013.
                2. "Ward Information for Bloomfield (Belfast) ward 95GG11". NISRA. Retrieved 22 December 2013.
                3. "Ward Information for Orangefield ward 95GG36". NISRA. Retrieved 22 December 2013.
                4. "Ward Information for Ravenhill ward 95GG37". NISRA. Retrieved 22 December 2013.
                5. "Ward Information for The Mount ward 95GG44". NISRA. Retrieved 22 December 2013.
                6. "Ward Information for Woodstock ward 95GG50". NISRA. Retrieved 22 December 2013.
                7. "Pottinger Result Sheet" (PDF). EONI. Retrieved 8 July 2021.
                8. "Local Government Results 2005". EONI. Retrieved 8 July 2021.
                9. "Local Government Results 2001". EONI. Retrieved 8 July 2021.
                10. "Local Government Results 1997". EONI. Retrieved 8 July 2021.
                11. "Local Government Results 1993". EONI. Retrieved 8 July 2021.
                12. "Local Government Results 1989". EONI. Retrieved 8 July 2021.
                13. "Local Government Results 1985". EONI. Retrieved 8 July 2021.

                54°35′38″N5°53′53″W / 54.594°N 5.898°W / 54.594; -5.898