1993 Belfast City Council election

Last updated

1993 Belfast City Council election
Flag of Belfast.svg
  1989 19 May 1993 (1993-05-19) 1997  

All 51 seats to Belfast City Council
26 seats needed for a majority
 First partySecond partyThird party
 
Party Ulster Unionist Sinn Féin DUP
Seats won15109
Seat changeIncrease2.svg 1Increase2.svg 2Increase2.svg 1

 Fourth partyFifth partySixth party
 
Party SDLP Alliance Ind. Unionist
Seats won952
Seat changeIncrease2.svg 1Decrease2.svg 1Decrease2.svg 3

 Seventh partyEighth party
 
Party PUP Workers' Party
Seats won10
Seat changeSteady2.svg 0Decrease2.svg 1

Lord Mayor before election

Herbert Ditty
Ulster Unionist

Lord Mayor

Reg Empey
Ulster Unionist

Elections to Belfast City Council were held on 19 May 1993 on the same day as the other Northern Irish local government elections. The election used nine district electoral areas to elect a total of 51 councillors, most representing the more heavily populated north and west.

Contents

The UUP remained the largest party, and Reg Empey became the Lord Mayor.

Election results

Belfast Local Election Result 1993 [1]
PartySeatsGainsLossesNet gain/lossSeats %Votes %Votes+/−
  Ulster Unionist 1520Increase2.svg229.422.023,811Increase2.svg0.3
  Sinn Féin 1020Increase2.svg219.622.724,648Increase2.svg4.0
  DUP 921Increase2.svg117.617.118,567Increase2.svg2.3
  SDLP 921Increase2.svg117.615.917,283Decrease2.svg0.2
  Alliance 501Decrease2.svg19.811.212,102Increase2.svg0.3
  Ind. Unionist 203Decrease2.svg33.92.42,553Decrease2.svg3.7
  PUP 100Steady2.svg02.01.51,609Decrease2.svg1.0
  Workers' Party 001Decrease2.svg101.81,966Decrease2.svg3.5
  NI Conservatives 000Steady2.svg002.32,465New
  Democratic Left 000Steady2.svg001.01,125New
  Green (NI) 000Steady2.svg001.21,257New
  Independent Labour 000Steady2.svg000.6670Increase2.svg0.6
  Independent Nationalist 000Steady2.svg000.3378Increase2.svg0.3

Note: "Votes" are the first preference votes.

Districts summary

[1]

Results of the Belfast City Council election, 1993
by district
Ward %
Cllrs
 %
Cllrs
 %
Cllrs
 %
Cllrs
 %
Cllrs
 %
Cllrs
 %
Cllrs
Total
Cllrs
UUP Sinn Féin DUP SDLP Alliance PUP Others
Balmoral30.620.0023.4219.1118.610.008.306
Castle28.224.8020.7122.429.800.0014.116
Court38.920.0025.010.003.9022.719.515
Laganbank27.729.4010.5026.9216.510.009.005
Lower Falls0.0071.240.0021.010.800.006.905
Oldpark22.8237.838.9015.813.300.0011.416
Pottinger27.126.5041.830.0013.010.0011.606
Upper Falls0.0057.131.3035.421.100.005.105
Victoria30.530.0028.720.0034.520.006.307
Total22.01522.71017.1915.9911.251.519.6251

District results

Balmoral

1989: 2 x UUP, 1 x DUP, 1 x SDLP, 1 x Alliance
1993: 2 x UUP, 2 x DUP, 1 x SDLP, 1 x Alliance
1989-1993 Change: DUP gain due to the addition of one seat

Balmoral - 6 seats [2]
PartyCandidateFPv%Count
123456789101112
SDLP Dorita Field *19.12%2,262           
DUP John Parkes*17.55%2,076           
Alliance Philip McGarry10.76%1,2731,545.43 1,547.41 1,550.68 1,572.94 1,596.07 1,633.33 1,695.77    
Ulster Unionist Mary Crooks*13.66%1,6161,617.89 1,638.59 1,639.22 1,640.22 1,644.4 1,644.58 1,649.85 1,790.85   
Ulster Unionist Jim Kirkpatrick *11.80%1,3961,397.35 1,411.57 1,411.75 1,412.75 1,413.75 1,417.75 1,425.2 1,553.36 1,906.36  
DUP Harry Smith5.89%697697.81 993.37 995.55 995.73 996.73 1,002.18 1,011.54 1,070.86 1,242.48 1,363.48 1,396.48
Alliance Mark Long*7.80%9231,065.02 1,066.46 1,068.46 1,078.69 1,101.01 1,149.61 1,222.54 1,298.24 1,310.14 1,325.14 1,357.14
Ulster Unionist Bob Stoker 5.17%611611 627.74 628.74 630.1 631.1 635.1 637.37 707.88    
NI Conservatives Esmond Birnie 2.36%279279.54 280.26 304.26 304.26 307.98 311.25 318.79     
NI Conservatives William Dickson 2.23%264264.81 276.33 276.51 276.51 279.51 292.78 296.05     
Green (NI) Roderick McAlister1.05%124168.28 168.82 172.82 189.38 213.13 273.59      
Independent Labour Niall Cusack0.96%113153.5 154.04 166.04 178.25 207.45       
Democratic Left Jean Craig0.82%97117.52 118.06 118.06 133.81        
Workers' Party Shaun McKeown0.40%4885.53 86.25 86.25         
NI Conservatives Hubert Mullan0.42%5050.54 51.98          
Electorate: 23,497  Valid: 11,829 (50.34%)  Spoilt: 331  Quota: 1,690  Turnout: 12,160 (51.75%)  

    Castle

    1989: 2 x Independent Unionist, 1 x UUP, 1 SDLP, 1 x DUP, 1 x Alliance
    1993: 2 x UUP, 2 SDLP, 1 x DUP, 1 x Independent Unionist
    1989-1993 Change: UUP and SDLP gain from Independent Unionist and Alliance

    Castle - 6 seats [2]
    PartyCandidateFPv%Count
    123456789
    DUP Nigel Dodds *20.61%2,470        
    Ulster Unionist David Browne 15.27%1,830        
    Ulster Unionist John Carson *12.98%1,5561,862.24       
    Ind. Unionist Nelson McCausland *8.93%1,0701,475.76 1,604.58 1,608.9 1,696.61 1,801.61   
    SDLP Alban Maginness *13.26%1,5891,589.96 1,589.96 1,617.96 1,618.31 1,626.38 2,010.38  
    SDLP Jonathan Stevenson9.09%1,0901,090 1,090 1,100 1,100.21 1,101.21 1,296.2 1,565.9 1,566.9
    Alliance Tom Campbell*9.78%1,1721,185.44 1,194.75 1,225.75 1,234.15 1,311.09 1,465.04 1,490.15 1,550.15
    Sinn Féin Gerard McGuigan4.80%575575.64 575.64 578.64 578.92 579.31    
    Green (NI) Alan Warren2.09%251255.8 257.51 303.83 306.7 337.1    
    NI Conservatives Margaret Redpath2.05%246269.36 274.49 274.49 281.63     
    Workers' Party Paul Treanor1.13%136137.28 137.66       
    Electorate: 22,839  Valid: 11,985 (52.48%)  Spoilt: 346  Quota: 1,713  Turnout: 12,331 (53.99%)  

      Court

      1989: 2 x UUP, 1 x DUP, 1 x PUP, 1 x Protestant Unionist, 1 x Independent Unionist
      1993: 2 x UUP, 1 x DUP, 1 x PUP, 1 x Independent Unionist
      1989-1993 Change: Protestant Unionist loss due to the reduction of one seat

      Court - 5 seats [2]
      PartyCandidateFPv%Count
      1234567
      DUP Eric Smyth *24.98%2,385      
      Ulster Unionist Fred Cobain *17.53%1,674      
      PUP Hugh Smyth *16.85%1,609      
      Ulster Unionist Chris McGimpsey15.42%1,4721,672.2     
      Ind. Unionist Joseph Coggle*8.29%7921,010.4 1,101.4 1,133.55 1,158.34 1,164.77 1,569.37
      Ulster Unionist Herbert Ditty*5.99%572695.9 792.7 824.4 859.25 861.65 1,068.26
      PUP Elizabeth Seawright*5.84%558772.2 819.65 832.3 850.32 855.74  
      Alliance Irene Galway3.89%371387.1      
      Workers' Party Peter Cullen1.21%116119.5      
      Electorate: 18,813  Valid: 9,549 (50.76%)  Spoilt: 332  Quota: 1,592  Turnout: 9,881 (52.52%)  

        Laganbank

        1989: 2 x UUP, 1 x SDLP, 1 x Alliance, 1 x DUP
        1993: 2 x UUP, 2 x SDLP, 1 x Alliance
        1989-1993 Change: SDLP gain from DUP

        Laganbank - 5 seats [2]
        PartyCandidateFPv%Count
        12345678910
        Ulster Unionist Jim Clarke *19.44%1,845         
        SDLP Alasdair McDonnell *15.80%1,5001,500.98 1,508.98 1,530.98 1,533.98 1,571.98 1,644.98   
        Alliance Steve McBride *8.81%836838.66 852.66 867.66 897.08 935.08 992.22 999.22 1,631.22 
        SDLP Peter O'Reilly11.08%1,0521,052 1,058 1,067 1,067 1,086 1,112 1,139 1,200.42 1,490.42
        Ulster Unionist Michael McGimpsey 5.74%545731.9 745.74 747.74 823 832.56 1,075.54 1,075.54 1,133.74 1,136.74
        DUP Caroline Bingham10.54%1,0001,020.44 1,023.58 1,023.72 1,037.28 1,045.28 1,068.1 1,068.1 1,081.1 1,084.8
        Sinn Féin Sean Hayes9.40%892892 892 900 900 907 926 930 931  
        Alliance Hugh Greer7.66%727734.42 744.7 755.7 780.84 834.98 868.54 870.54   
        Ulster Unionist Dennis Rogan 2.49%236261.48 262.76 262.76 300.14 303.28     
        Workers' Party Paddy Lynn2.34%222222.14 239.14 265.42 265.42 290.42     
        Green (NI) Andrew Frew2.13%202203.12 211.68 243.68 244.82      
        NI Conservatives Graham Montgomery2.09%198203.04 204.04 205.04       
        Independent Labour Peter Hadden1.50%142142.42 150.42        
        Democratic Left Michael Craig1.00%9597.1         
        Electorate: 20,008  Valid: 9,492 (47.44%)  Spoilt: 313  Quota: 1,583  Turnout: 9,805 (49.01%)  

          Lower Falls

          1989: 3 x Sinn Féin, 2 x SDLP
          1993: 4 x Sinn Féin, 1 x SDLP
          1989-1993 Change: Sinn Féin gain from SDLP

          Lower Falls - 5 seats [2]
          PartyCandidateFPv%Count
          123456
          Sinn Féin Tom Hartley 19.79%2,573     
          Sinn Féin Fra McCann *18.40%2,393     
          Sinn Féin Patrick McGeown18.09%2,352     
          Sinn Féin Marie Moore14.97%1,9462,316.77    
          SDLP Mary Muldoon*13.45%1,7491,760.39 1,832.92 1,929.38 2,030.98 2,325.98
          SDLP Margaret Walsh7.59%987991.93 1,049.44 1,134.77 1,165.97 1,306.48
          Workers' Party John Lowry6.11%794804.37 831.54 874.47 924.07  
          Alliance Patrick Woods0.83%108109.87     
          Democratic Left Mary McMahon0.78%101105.24     
          Electorate: 19,978  Valid: 13,003 (65.09%)  Spoilt: 509  Quota: 2,168  Turnout: 13,512 (67.63%)  

            Oldpark

            1989: 2 x Sinn Féin, 2 x UUP, 1 x SDLP, 1 x Workers' Party
            1993: 3 x Sinn Féin, 2 x UUP, 1 x SDLP
            1989-1993 Change: Sinn Féin gain from Workers' Party

            Oldpark - 6 seats [2]
            PartyCandidateFPv%Count
            123456789
            Sinn Féin Joe Austin15.02%2,229        
            Ulster Unionist Fred Proctor*13.78%2,0452,045 2,085 2,091 2,138    
            SDLP Martin Morgan11.88%1,7631,766.48 1,768.48 1,817.48 1,903.56 2,028.68 2,553.68  
            Sinn Féin Paddy McManus*11.92%1,7691,810.36 1,810.36 1,822.48 1,836.72 1,840.8 1,852 1,873 1,982.68
            Sinn Féin Bobby Lavery10.90%1,6171,654.12 1,654.12 1,666.2 1,685.72 1,696.04 1,707.12 1,767.12 1,919.64
            Ulster Unionist Fred Rodgers9.05%1,3431,343 1,394 1,400 1,417 1,542 1,548 1,555 1,724
            DUP David Smylie8.92%1,3241,324.04 1,376.04 1,383.04 1,405.04 1,436.04 1,438.04 1,438.04 1,474.04
            Democratic Left Seamus Lynch*5.61%832833.92 837.92 892.96 962.04 1,118.04 1,154.04 1,352.04  
            SDLP Peter Prendiville3.96%588588.44 590.44 607.44 626.44 645.44    
            Alliance Beatrice Boyd3.19%473473.84 483.84 501.84 584.92     
            Green (NI) Peter Emerson 2.65%393394.12 421.12 447.12      
            Workers' Party Margaret Smith1.75%259259.32 261.32       
            NI Conservatives David Tarr1.39%206206        
            Electorate: 25,943  Valid: 14,841 (57.21%)  Spoilt: 532  Quota: 2,121  Turnout: 15,373 (59.26%)  

              Pottinger

              1989: 2 x DUP, 2 x UUP, 1 x Alliance, 1 Independent Unionist
              1993: 3 x DUP, 2 x UUP, 1 x Alliance
              1989-1993 Change: DUP gain from Independent Unionist

              Pottinger - 6 seats [2]
              PartyCandidateFPv%Count
              12345678
              DUP Sammy Wilson *25.52%2,784       
              Alliance Mervyn Jones*12.99%1,4171,427.35 1,461.35 1,476.15 1,700.15   
              DUP Jim Walker*7.27%7931,476.55 1,478.55 1,549.15 1,566.15   
              Ulster Unionist Reg Empey *11.87%1,2951,380.95 1,381.95 1,408.8 1,418.8 1,428.8 1,612.8 
              DUP Robert Cleland9.00%9821,252.45 1,254.45 1,307.9 1,324.8 1,326.8 1,379.45 1,388.45
              Ulster Unionist Alexander Blair8.22%897919.05 921.05 931.95 960.3 979.3 1,070.15 1,080.15
              Ulster Unionist Margaret Clarke*6.91%754778.75 782.2 790.1 802.55 807.55 926.65 939.65
              Sinn Féin Joseph O'Donnell6.50%709709 713 714 754 769 771  
              NI Conservatives Dorothy Dunlop*4.93%538574 580 595.15 624.15 644.15   
              Independent Labour Colin Ballentine2.48%271273.25 297.25 305.25     
              Workers' Party Joseph Bell2.08%227228.35 240.35 243.8     
              Ind. Unionist Samuel Walker1.22%133214.9 216.9      
              Green (NI) Thaddeus Bradley0.98%107108.35       
              Electorate: 24,293  Valid: 10,907 (44.90%)  Spoilt: 482  Quota: 1,559  Turnout: 11,389 (46.89%)  

                Upper Falls

                1989: 3 x Sinn Féin, 2 x SDLP
                1993: 3 x Sinn Féin, 2 x SDLP
                1989-1993 Change: No change

                Upper Falls - 5 seats [2]
                PartyCandidateFPv%Count
                123456789
                SDLP Alex Attwood *24.08%3,203        
                Sinn Féin Una Gillespie20.79%2,765        
                Sinn Féin Alex Maskey *20.56%2,735        
                Sinn Féin Mairtin O'Muilleoir *15.74%2,0932,114.12 2,629.32      
                SDLP Patricia Lewsley 6.00%7981,428.72 1,437.72 1,602.89 1,623.89 1,625.89 1,670.62 1,774.2 2,122.7
                SDLP Terence Tracey5.28%702888.24 891.64 1,007.84 1,019.24 1,027.24 1,059.73 1,167.52 1,327.21
                Independent Nationalist Cormac Boomer*2.84%378474.96 477.56 582.14 594.34 595.34 626.15 744.45  
                Independent Labour Billy Lynn1.08%144154.24 158.24 242.9 260.7 271.85 298.53   
                Alliance Julie Greaves1.09%145173.8 175.4 186.19 187.39 253.59 266.7   
                Workers' Party James Maxwell1.23%164171.36 173.56 206.76 208.36 217.36    
                DUP David McNerlin1.31%174174.64 174.64 176.3 176.7     
                Electorate: 21,948  Valid: 13,301 (60.60%)  Spoilt: 424  Quota: 2,217  Turnout: 13,725 (62.53%)  

                  Victoria

                  1989: 3 x UUP, 2 x Alliance, 2 x DUP
                  1993: 3 x UUP, 2 x Alliance, 2 x DUP
                  1989-1993 Change: No change

                  Victoria - 7 seats [2]
                  PartyCandidateFPv%Count
                  123456789
                  Alliance John Alderdice *24.67%3,337        
                  DUP Wallace Browne *15.92%2,153        
                  Ulster Unionist Thomas Patton *13.31%1,801        
                  DUP Robin Newton *12.78%1,729        
                  Ulster Unionist Ian Adamson *9.73%1,3161,395.56 1,547.81 1,564.23 1,686.5 1,880.5   
                  Alliance Danny Dow*4.08%5521,543.44 1,564.9 1,642.89 1,661.29 1,761.29   
                  Ulster Unionist Jim Rodgers 4.44%600631.62 749.07 757.18 1,091.36 1,274.11 1,408.11 1,560.65 1,510.25
                  Alliance Maureen McConnell5.68%7681,159.68 1,169.54 1,220.19 1,226.21 1,368.9 1,387.9 1,393.92 1,454.4
                  NI Conservatives Jim McCormick5.06%684759.99 784.93 807.3 828.13     
                  Ulster Unionist John Norris3.01%407435.56 554.17 561.97      
                  Green (NI) Michael Bell1.33%180218.76 225.72       
                  Electorate: 29,632  Valid: 13,527 (45.65%)  Spoilt: 360  Quota: 1,691  Turnout: 13,887 (46.86%)  

                    Related Research Articles

                    <span class="mw-page-title-main">Castle (District Electoral Area)</span> District Electoral Area in Belfast, Northern Ireland

                    Castle is one of the ten district electoral areas in Belfast, Northern Ireland. Located in the north of the city, the district elects six members to Belfast City Council and contains the wards of Bellevue, Cavehill, Chichester Park, Duncairn, Fortwilliam and Innisfayle. Castle, along with Oldpark district and parts of the Court district and Newtownabbey Borough Council, forms the Belfast North constituency for the Northern Ireland Assembly and UK Parliament. The district is bounded to the east by the Victoria Channel, to the north by Newtownabbey Borough Council and Belfast Lough, to the south by North Street and to the west by the Cavehill Road.

                    <span class="mw-page-title-main">Court (District Electoral Area)</span>

                    Court is one of the ten district electoral areas (DEA) in Belfast, Northern Ireland. Located in the north and west of the city, the district elects six members to Belfast City Council and contains the wards of Ballygomartin, Clonard, Falls, Forth River, Shankill, and Woodvale. Court is split between the Belfast North and Belfast West constituencies for the Northern Ireland Assembly and UK Parliament.

                    <span class="mw-page-title-main">Oldpark (District Electoral Area)</span>

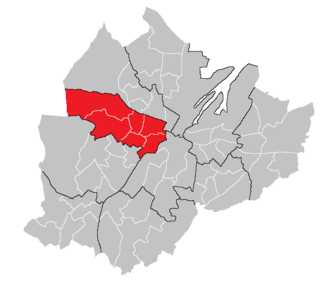
                    Oldpark is one of the ten district electoral areas (DEA) in Belfast, Northern Ireland. Located in the north of the city, the district elects six members to Belfast City Council and contains the wards of Ardoyne; Ballysillan; Cliftonville; Legoniel; New Lodge and Water Works. Oldpark forms part of the Belfast North constituency for the Northern Ireland Assembly and UK Parliament.

                    <span class="mw-page-title-main">Pottinger (District Electoral Area)</span> Human settlement in Northern Ireland

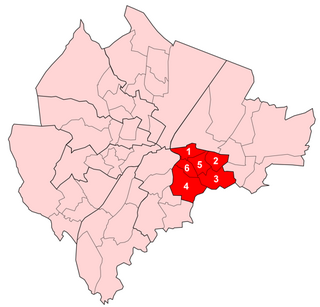
                    Pottinger was one of the nine district electoral areas (DEA) in Belfast, Northern Ireland from 1985 to 2014. Located in the east of the city, the district elected six members to Belfast City Council and contained the wards of Ballymacarrett, Bloomfield, Orangefield, Ravenhill, The Mount, and Woodstock.

                    <span class="mw-page-title-main">2011 Belfast City Council election</span>

                    Elections to Belfast City Council were held on 5 May 2011 on the same day as the other Northern Irish local government elections. The election used nine district electoral areas to elect a total of 51 councillors, most representing the more heavily populated north and west.

                    <span class="mw-page-title-main">2005 Belfast City Council election</span>

                    Elections to Belfast City Council were held on 5 May 2005 on the same day as the other Northern Irish local government elections. The election used nine district electoral areas to elect a total of 51 councillors, most representing the more heavily populated north and west.

                    <span class="mw-page-title-main">2019 Antrim and Newtownabbey Borough Council election</span>

                    Elections to Antrim and Newtownabbey Borough Council, part of the Northern Ireland local elections on 2 May 2019, returned 40 members to the council using Single Transferable Vote. The Democratic Unionist Party were the largest party in both first-preference votes and seats.

                    <span class="mw-page-title-main">2019 Causeway Coast and Glens Borough Council election</span> Local government election in Northern Ireland

                    The second election to Causeway Coast and Glens Borough Council, part of the Northern Ireland local elections on 2 May 2019, returned 40 members to the council via Single Transferable Vote. The Democratic Unionist Party won a plurality of first-preference votes and seats.

                    <span class="mw-page-title-main">2019 Fermanagh and Omagh District Council election</span>

                    Elections took place for Fermanagh and Omagh District Council on 2 May 2019, part of that year's local elections. 40 Councillors were elected via STV.

                    <span class="mw-page-title-main">2019 Armagh City, Banbridge and Craigavon Borough Council election</span>

                    Elections to Armagh City, Banbridge and Craigavon Borough Council, part of the Northern Ireland local elections on 2 May 2019, returned 41 members to the council using Single Transferable Vote. The Democratic Unionist Party were the largest party in both first-preference votes and seats.

                    <span class="mw-page-title-main">2001 Belfast City Council election</span> Northern Ireland local election

                    Elections to Belfast City Council were held on 7 June 2001 on the same day as the other Northern Irish local government elections. The election used nine district electoral areas to elect a total of 51 councillors, most representing the more heavily populated north and west.

                    Elections to Belfast City Council were held on 21 May 1997 on the same day as the other Northern Irish local government elections. The election used nine district electoral areas to elect a total of 51 councillors, most representing the more heavily populated north and west.

                    Elections to Belfast City Council were held on 17 May 1989 on the same day as the other Northern Irish local government elections. The election used nine district electoral areas to elect a total of 51 councillors, most representing the more heavily populated north and west.

                    Elections to Belfast City Council were held on 15 May 1985 on the same day as the other Northern Irish local government elections. The election used nine district electoral areas to elect a total of 51 councillors, most representing the more heavily populated north and west.

                    Elections to Lisburn Borough Council were held on 7 June 2001 on the same day as the other Northern Irish local government elections. The election used five district electoral areas to elect a total of 30 councillors.

                    Elections to Lisburn Borough Council were held on 21 May 1997 on the same day as the other Northern Irish local government elections. The election used five district electoral areas to elect a total of 30 councillors.

                    Elections to Newtownabbey Borough Council were held on 7 June 2001 on the same day as the other Northern Irish local government elections. The election used four district electoral areas to elect a total of 25 councillors.

                    Elections to Newry and Mourne District Council were held on 19 May 1993 on the same day as the other Northern Irish local government elections. The election used five district electoral areas to elect a total of 30 councillors.

                    Elections to Strabane District Council were held on 19 May 1993 on the same day as the other Northern Irish local government elections. The election used three district electoral areas to elect a total of 16 councillors.

                    <span class="mw-page-title-main">2023 Belfast City Council election</span> Local election in Northern Ireland

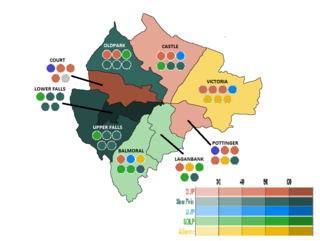
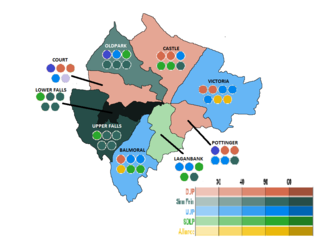
                    The 2023 election to Belfast City Council was held on 18 May 2023, alongside other local elections in Northern Ireland, two weeks after local elections in England. The Northern Ireland elections were delayed by 2 weeks to avoid overlapping with the coronation of King Charles III.

                    References

                    1. 1 2 "Belfast Council results". 27 July 2011. Retrieved 26 May 2021.
                    2. 1 2 3 4 5 6 7 8 9 "Local Government Results 1993". EONI. Retrieved 8 July 2021.