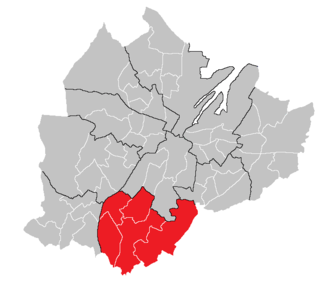
2005 Belfast City Council election

Last updated

2005 Belfast City Council election
Flag of Belfast.svg
  2001 5 May 2005 (2005-05-05) 2011  

All 51 seats to Belfast City Council
26 seats needed for a majority
 First partySecond partyThird party
 
Party DUP Sinn Féin SDLP
Seats won15148
Seat changeIncrease2.svg 5Steady2.svg 0Decrease2.svg 1

 Fourth partyFifth partySixth party
 
Party Ulster Unionist Alliance PUP
Seats won742
Seat changeDecrease2.svg 4Increase2.svg 1Decrease2.svg 1

 Seventh party
 
Party Independent
Seats won1
Seat changeSteady2.svg 0

2005 Belfast City Council Election Map.png
2005 Belfast City Council Election Results, shaded by First Preference Votes.

Lord Mayor before election

Tom Ekin
Alliance

Lord Mayor

Wallace Browne
DUP

Elections to Belfast City Council were held on 5 May 2005 on the same day as the other Northern Irish local government elections. The election used nine district electoral areas to elect a total of 51 councillors, most representing the more heavily populated north and west.

Contents

The DUP emerged as the largest party, and Wallace Browne became Lord Mayor.

Election results

Belfast Local Election Result 2005 [1]
PartySeatsGainsLossesNet gain/lossSeats %Votes %Votes+/−
  DUP 1550Increase2.svg529.425.825,722Increase2.svg7.7
  Sinn Féin 1411Steady2.svg027.530.630,531Increase2.svg2.2
  SDLP 801Decrease2.svg115.717.117,058Decrease2.svg0.3
  Ulster Unionist 751Decrease2.svg413.713.813,756Decrease2.svg4.5
  Alliance 410Increase2.svg17.86.86,808Steady2.svg0.0
  PUP 201Decrease2.svg13.92.72,713Decrease2.svg3.1
  Independent 100Steady2.svg02.01.01,007Decrease2.svg2.0
  Green (NI) 000Steady2.svg00.00.8801New
  Workers' Party 000Steady2.svg00.00.7698Steady2.svg0.0
  Socialist Party 000Steady2.svg00.00.3338New
  NI Conservatives 000Steady2.svg00.00.2243Steady2.svg0.0

Note: "Votes" are the first preference votes.

Districts summary

[1]

Results of the Belfast City Council election, 2005
by district
Ward %
Cllrs
 %
Cllrs
 %
Cllrs
 %
Cllrs
 %
Cllrs
 %
Cllrs
 %
Cllrs
Total
Cllrs
DUP Sinn Féin SDLP UUP Alliance PUP Others
Balmoral22.2210.3033.1219.7112.910.001.806
Castle38.6218.6127.1210.512.500.002.706
Court67.733.300.007.700.0010.7113.915
Laganbank15.1117.8131.5218.819.500.007.205
Lower Falls0.0085.2511.900.000.000.003.505
Oldpark22.3147.5315.917.910.003.803.206
Pottinger41.738.906.3022.017.5111.012.516
Upper Falls0.0075.2424.810.000.000.000.005
Victoria37.530.002.4033.0223.422.101.707
Total25.81530.61417.1813.876.842.723.2151

District results

Balmoral

2001: 2 x UUP, 2 x SDLP, 1 x Alliance, 1 x DUP
2005: 2 x SDLP, 1 x DUP, 1 x UUP, 1 x Alliance
2001-2005 Change: DUP gain from UUP

Balmoral - 6 seats [2]
PartyCandidateFPv%Count
123456789
SDLP Carmel Hanna *17.34%2,030        
SDLP Bernie Kelly7.09%906908 1,137.84 1,949.84     
Alliance Tom Ekin *12.88%1,5081,524 1,559.19 1,613.31 1,755.9    
Ulster Unionist Bob Stoker *10.08%1,1801,288 1,291.93 1,296.74 1,300.17 1,312.42 2,163.42  
DUP Jim Kirkpatrick 12.58%1,4731,484 1,485.19 1,485.19 1,487.15 1,488.13 1,642.79 1,934.39 
DUP Ruth Patterson*9.65%1,1301,180 1,180.17 1,183.51 1,183.51 1,184 1,261.66 1,452.46 1,706.11
Sinn Féin Stiofán Long10.26%1,2021,204 1,220.15 1,305.88 1,423.48 1,458.27 1,470.98 1,474.58 1,479.92
Ulster Unionist Esmond Birnie 9.61%1,1251,137 1,142.95 1,153.16 1,160.51 1,183.05    
SDLP Mary Kennedy8.05%943943 991.96       
Independent Thomas Wilson1.82%213        
Electorate: 18,382  Valid: 11,710 (63.70%)  Spoilt: 192  Quota: 1,673  Turnout: 11,902 (64.75%)  

    Castle

    2001: 2 x DUP, 2 x SDLP, 1 x Sinn Féin, 1 x UUP
    2005: 2 x DUP, 2 x SDLP, 1 x Sinn Féin, 1 x UUP
    2001-2005 Change: No change

    Castle - 6 seats [2]
    PartyCandidateFPv%Count
    1234567
    DUP Nigel Dodds *28.96%3,161      
    SDLP Pat Convery*16.66%1,818      
    Ulster Unionist David Browne *10.52%1,1481,454.51 1,563.59    
    SDLP Cathal Mullaghan10.41%1,1361,139.57 1,408.14 1,614.92   
    DUP Ian Crozier*4.01%4381,390.68 1,408.23 1,408.65 2,010.65  
    Sinn Féin Tierna Cunningham9.43%1,0291,032.06 1,066.06 1,087.34 1,109.25 1,133.25 1,163.17
    Sinn Féin David Kennedy9.17%1,0011,003.04 1,032.55 1,046.41 1,068.4 1,090.4 1,111.4
    DUP Lydia Patterson5.66%618908.7 918.74 919.16    
    Alliance Marjorie Hawkins2.47%270279.69      
    Green (NI) Shane Ó Heorpa1.68%183183.51      
    Workers' Party John Lavery1.03%112117.61      
    Electorate: 18,413  Valid: 10,914 (59.27%)  Spoilt: 253  Quota: 1,560  Turnout: 11,167 (60.65%)  

      Court

      2001: 2 x DUP, 1 x UUP, 1 x PUP, 1 x Independent
      2005: 3 x DUP, 1 x PUP, 1 x Independent
      2001-2005 Change: DUP gain from UUP

      Court - 5 seats [2]
      PartyCandidateFPv%Count
      12345
      DUP Diane Dodds 55.73%4,176    
      DUP William Humphrey 9.06%6792,320.52   
      DUP Elaine McMillen*2.95%221730.07 1,577.39  
      Independent Frank McCoubrey *10.60%7941,107.11 1,186.23 1,244.66 1,312.41
      PUP Hugh Smyth *10.66%7991,003.48 1,043.96 1,065.41 1,174.86
      Ulster Unionist Chris McGimpsey*7.67%575777.35 860.61 903.08 1,022.96
      Sinn Féin Francis Hamilton3.32%249266.04 267.42   
      Electorate: 13,582  Valid: 7,493 (55.17%)  Spoilt: 233  Quota: 1,249  Turnout: 7,726 (56.88%)  

        Laganbank

        2001: 2 x SDLP, 2 x UUP, 1 x Sinn Féin,
        2005: 2 x SDLP, 1 x UUP, 1 x Sinn Féin, 1 x DUP
        2001-2005 Change: DUP gain from UUP

        Laganbank - 5 seats [2]
        PartyCandidateFPv%Count
        12345
        Sinn Féin Alex Maskey *17.77%1,600    
        SDLP Patrick McCarthy *16.21%1,4591,503.8   
        SDLP Peter O'Reilly*15.28%1,3761,402.6 1,489.47 1,609.47 
        Ulster Unionist Michael McGimpsey *14.80%1,3321,333.68 1,350.82 1,647.82 
        DUP Christopher Stalford 15.13%1,3621,362.07 1,367.07 1,417.28 1,512.44
        Alliance Allan Leonard9.54%859861.94 901.78 1,172.51 1,222.53
        Green (NI) Andrew Frew4.10%369375.16 467.66   
        Ulster Unionist Paula Bradshaw 4.04%364364.28 366.35   
        Socialist Party James Barbour1.94%175181.86    
        Workers' Party Paddy Lynn1.19%107110.01    
        Electorate: 15,223  Valid: 9,003 (59.14%)  Spoilt: 205  Quota: 1,501  Turnout: 9,208 (60.49%)  

          Lower Falls

          2001: 4 x Sinn Féin, 1 x SDLP
          2005: 5 x Sinn Féin
          2001-2005 Change: Sinn Féin gain from SDLP

          Lower Falls - 5 seats [2]
          PartyCandidateFPv%Count
          1234
          Sinn Féin Janice Austin19.42%2,071   
          Sinn Féin Fra McCann *19.17%2,045   
          Sinn Féin Tom Hartley *18.39%1,962   
          Sinn Féin Máire Cush*15.33%1,7641,797  
          Sinn Féin Marie Moore*11.67%1,2451,253 1,528.1 1,764.42
          SDLP Margaret Walsh*11.86%1,2651,439 1,449.95 1,476.27
          Workers' Party John Lowry2.94%314   
          Electorate: 16,334  Valid: 10,666 (65.30%)  Spoilt: 392  Quota: 1,778  Turnout: 11,058 (67.70%)  

            Oldpark

            2001: 3 x Sinn Féin, 1 x SDLP, 1 x DUP, 1 x PUP
            2005: 3 x Sinn Féin, 1 x DUP, 1 x SDLP, 1 x UUP
            2001-2005 Change: UUP gain from PUP

            Oldpark - 6 seats [2]
            PartyCandidateFPv%Count
            1234567
            DUP Nelson McCausland *22.27%2,642      
            Sinn Féin Danny Lavery*17.64%2,093      
            Sinn Féin Margaret McClenaghan*15.42%1,829      
            SDLP Alban Maginness *11.90%1,4111,418.03 1,450.33 1,538.39 1,549.17 1,966.17 
            Ulster Unionist Fred Cobain 7.91%9381,594.01 1,594.01 1,652.29 1,652.43 1,663.1 1,685.1
            Sinn Féin Caral Ni Chuilin 10.47%1,2421,243.48 1,468.63 1,495.01 1,585.31 1,600.85 1,657.85
            PUP Billy Hutchinson*3.84%455690.69 691.45 732.59 732.66 735.22 757.22
            Sinn Féin Marie Mackessy3.94%467468.85 586.08 600.22 622.2 651.74 715.74
            SDLP Andrew Harding4.01%476479.33 487.69 539.44 540.07   
            Green (NI) Peter Emerson 2.10%249278.6 280.5     
            Workers' Party Paul Treanor0.51%6060.37 62.08     
            Electorate: 22,444  Valid: 11,862 (52.85%)  Spoilt: 329  Quota: 1,695  Turnout: 12,191 (59.63%)  

              Pottinger

              2001: 3 x DUP, 1 x UUP, 1 x PUP, 1 x Alliance
              2005: 2 x DUP, 2 x UUP, 1 x PUP, 1 x Sinn Féin
              2001-2005 Change: DUP and Alliance gain from UUP and Sinn Féin

              Pottinger - 6 seats [2]
              PartyCandidateFPv%Count
              123456
              DUP Sammy Wilson *22.60%2,385     
              Ulster Unionist Reg Empey *18.65%1,968     
              DUP May Campbell12.34%1,3021,530.29    
              PUP David Ervine *10.95%1,1561,248.87 1,324.71 1,394.99 1,556.39 
              DUP Margaret McKenzie6.79%7171,216.13 1,239.89 1,281.08 1,451.42 1,461.25
              Alliance Máire Hendron 7.53%795800.92 830.92 895.09 1,008.55 1,428.28
              Sinn Féin Deborah Devenny8.94%944944 947.84 967.84 969.84 1,126.08
              SDLP Mary Muldoon6.35%670672.22 677.26 743.18 766.22  
              Ulster Unionist Sonia Copeland2.62%277303.64 524.92 644.92   
              Socialist Party Tommy Black1.57%163165.96 168.36    
              Workers' Party Joseph Bell0.99%105105.74 106.74    
              Ulster Unionist Henry Wallace0.68%7285.69 180.25    
              Electorate: 19,621  Valid: 10,554 (53.79%)  Spoilt: 381  Quota: 1,508  Turnout: 10,935 (55.73%)  

                Upper Falls

                2001: 4 x Sinn Féin, 1 x SDLP
                2005: 4 x Sinn Féin, 1 x SDLP
                2001-2005 Change: No change

                Upper Falls - 5 seats [2]
                PartyCandidateFPv%Count
                1234
                Sinn Féin Paul Maskey *23.69%3,084   
                SDLP Tim Attwood21.63%2,815   
                Sinn Féin Gerard O'Neill*18.81%2,448   
                Sinn Féin Michael Browne*17.34%2,257   
                Sinn Féin Christine Mac Giolla Mhín10.97%1,4282,070.32 2,089.57 2,325.41
                SDLP Roisin Mulholland3.17%413467.56 1,025.56 1,031.83
                Sinn Féin Caoimhín Mac Giolla Mhín4.39%571779.54 843.44 863.79
                Electorate: 19,767  Valid: 13,016 (65.85%)  Spoilt: 437  Quota: 2,170  Turnout: 13,453 (68.06%)  

                  Victoria

                  2001: 3 x UUP, 2 x DUP, 2 x Alliance
                  2005: 3 x DUP, 2 x UUP, 2 x Alliance
                  2001-2005 Change: DUP gain from UUP

                  Victoria - 7 seats [2]
                  PartyCandidateFPv%Count
                  1234567
                  DUP Wallace Browne *18.60%2,689      
                  Alliance Naomi Long *17.74%2,565      
                  Ulster Unionist Jim Rodgers *16.88%2,441      
                  DUP Robin Newton *13.86%2,004      
                  Ulster Unionist Ian Adamson *12.98%1,877      
                  DUP David Rodway5.01%7251,527.4 1,549.72 1,635.12 1,810.52  
                  Alliance Mervyn Jones5.61%811815.42 1,421.47 1,456.75 1,458.85 1,461.82 1,838.82
                  Ulster Unionist Alan Crowe*3.17%459508.98 582.76 1,041.76 1,050.86 1,099.16 1,366.16
                  SDLP John Ó Doherty2.35%340343.4 374.09 379.69 379.99 380.14  
                  PUP John McQuillan2.10%303310.82 321.36 337.88 340.38 340.89  
                  NI Conservatives Peter Gray1.68%243252.52 265.23 287.35 288.45 289.53  
                  Electorate: 25,058  Valid: 14,457 (57.69%)  Spoilt: 349  Quota: 1,808  Turnout: 14,806 (59.09%)  

                    Related Research Articles

                    <span class="mw-page-title-main">Balmoral (District Electoral Area)</span>

                    Balmoral is the most southern of ten district electoral areas (DEA) in Belfast, Northern Ireland. The district elects five members to Belfast City Council and contains the wards of Belvoir; Finaghy; Malone; Musgrave; Windsor; and Upper Malone. Balmoral, along with neighbouring Botanic, forms the greater part of the Belfast South constituencies for the Northern Ireland Assembly and UK Parliament.

                    <span class="mw-page-title-main">Castle (District Electoral Area)</span> District Electoral Area in Belfast, Northern Ireland

                    Castle is one of the ten district electoral areas in Belfast, Northern Ireland. Located in the north of the city, the district elects six members to Belfast City Council and contains the wards of Bellevue, Cavehill, Chichester Park, Duncairn, Fortwilliam and Innisfayle. Castle, along with Oldpark district and parts of the Court district and Newtownabbey Borough Council, forms the Belfast North constituency for the Northern Ireland Assembly and UK Parliament. The district is bounded to the east by the Victoria Channel, to the north by Newtownabbey Borough Council and Belfast Lough, to the south by North Street and to the west by the Cavehill Road.

                    <span class="mw-page-title-main">Oldpark (District Electoral Area)</span> Electoral division in Belfast, Northern Ireland

                    Oldpark is one of the ten district electoral areas (DEA) in Belfast, Northern Ireland. Located in the north of the city, the district elects six members to Belfast City Council and contains the wards of Ardoyne; Ballysillan; Cliftonville; Legoniel; New Lodge and Water Works. Oldpark forms part of the Belfast North constituency for the Northern Ireland Assembly and UK Parliament.
                    <span class="mw-page-title-main">Pottinger (District Electoral Area)</span> Human settlement in Northern Ireland

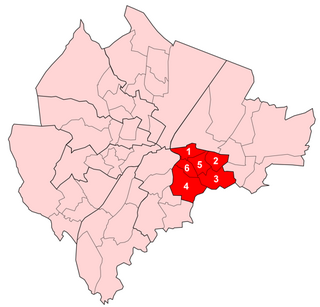
                    Pottinger was one of the nine district electoral areas (DEA) in Belfast, Northern Ireland from 1985 to 2014. Located in the east of the city, the district elected six members to Belfast City Council and contained the wards of Ballymacarrett, Bloomfield, Orangefield, Ravenhill, The Mount, and Woodstock.
                    <span class="mw-page-title-main">2011 Belfast City Council election</span>

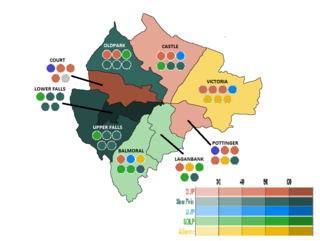
                    Elections to Belfast City Council were held on 5 May 2011 on the same day as the other Northern Irish local government elections. The election used nine district electoral areas to elect a total of 51 councillors, most representing the more heavily populated north and west.

                    <span class="mw-page-title-main">2014 Belfast City Council election</span>

                    Elections to Belfast City Council were held on 22 May 2014 – on the same day as other local government elections in Northern Ireland – as part of the process of local government reform provided for in the Local Government Act 2014.

                    <span class="mw-page-title-main">2019 Newry, Mourne and Down District Council election</span> 2019 Northern Ireland local election

                    The 2019 election to the Newry, Mourne and Down District Council, part of the Northern Ireland local elections that were held on 2 May 2019 returned 41 members to the council via Single Transferable Vote.

                    <span class="mw-page-title-main">2019 Belfast City Council election</span> Northern Ireland local election

                    The 2019 election to Belfast City Council, part of the Northern Ireland local elections on 2 May 2019, returned 60 members to the council via Single Transferable Vote.

                    <span class="mw-page-title-main">2019 Causeway Coast and Glens Borough Council election</span> Local government election in Northern Ireland

                    The second election to Causeway Coast and Glens Borough Council, part of the Northern Ireland local elections on 2 May 2019, returned 40 members to the council via Single Transferable Vote. The Democratic Unionist Party won a plurality of first-preference votes and seats.

                    <span class="mw-page-title-main">2019 Armagh City, Banbridge and Craigavon Borough Council election</span>

                    Elections to Armagh City, Banbridge and Craigavon Borough Council, part of the Northern Ireland local elections on 2 May 2019, returned 41 members to the council using Single Transferable Vote. The Democratic Unionist Party were the largest party in both first-preference votes and seats.
                    <span class="mw-page-title-main">2001 Belfast City Council election</span> Northern Ireland local election

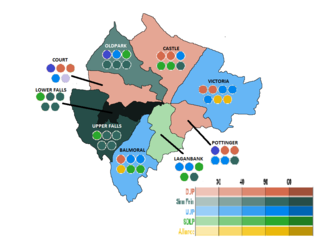
                    Elections to Belfast City Council were held on 7 June 2001 on the same day as the other Northern Irish local government elections. The election used nine district electoral areas to elect a total of 51 councillors, most representing the more heavily populated north and west.

                    Elections to Belfast City Council were held on 21 May 1997 on the same day as the other Northern Irish local government elections. The election used nine district electoral areas to elect a total of 51 councillors, most representing the more heavily populated north and west.

                    Elections to Belfast City Council were held on 19 May 1993 on the same day as the other Northern Irish local government elections. The election used nine district electoral areas to elect a total of 51 councillors, most representing the more heavily populated north and west.

                    Elections to Belfast City Council were held on 17 May 1989 on the same day as the other Northern Irish local government elections. The election used nine district electoral areas to elect a total of 51 councillors, most representing the more heavily populated north and west.

                    Elections to Belfast City Council were held on 15 May 1985 on the same day as the other Northern Irish local government elections. The election used nine district electoral areas to elect a total of 51 councillors, most representing the more heavily populated north and west.

                    Elections to Lisburn City Council were held on 5 May 2005 on the same day as the other Northern Irish local government elections. The election used five district electoral areas to elect a total of 30 councillors.

                    Elections to Newtownabbey Borough Council were held on 7 June 2001 on the same day as the other Northern Irish local government elections. The election used four district electoral areas to elect a total of 25 councillors.

                    <span class="mw-page-title-main">2023 Belfast City Council election</span> Local election in Northern Ireland

                    The 2023 election to Belfast City Council was held on 18 May 2023, alongside other local elections in Northern Ireland, two weeks after local elections in England. The Northern Ireland elections were delayed by 2 weeks to avoid overlapping with the coronation of King Charles III.

                    <span class="mw-page-title-main">2023 Causeway Coast and Glens Borough Council election</span> Northern Ireland local election

                    The 2023 election to Causeway Coast and Glens Borough Council was scheduled to be held on 18 May 2023, alongside other local elections in Northern Ireland, two weeks after local elections in England. The Northern Ireland elections were delayed by 2 weeks to avoid overlapping with the coronation of King Charles III.

                    Dunmurry Cross was one of the district electoral areas in Lisburn, Northern Ireland which existed from 1985 to 2014. It was one of four Lisburn DEAs until 1993, and one of five until 2014. The district elected seven members to Lisburn City Council and formed part of Belfast West constituencies for the Northern Ireland Assembly and UK Parliament and part of the Lagan Valley constituencies for the Northern Ireland Assembly and UK Parliament.

                    References

                    1. 1 2 "Belfast Council results". 11 May 2011. Retrieved 18 June 2016.
                    2. 1 2 3 4 5 6 7 8 9 "Local Government Results 2005". EONI. Retrieved 8 July 2021.