2005 Cambridgeshire County Council election

Last updated

2005 Cambridgeshire County Council election
Cambridgeshire Flag.svg
  2001 5 May 2005 2009  

All 69 seats to Cambridgeshire County Council
35 seats needed for a majority
 First partySecond partyThird party
  No image wide.svg No image wide.svg No image wide.svg
Party Conservative Liberal Democrats Labour
Last election34 seats, 40.5%16 seats, 31.5%9 seats, 25.5%
Seats before33178
Seats won42234
Seat changeIncrease2.svg 8Increase2.svg 7Decrease2.svg 5
Popular vote112,543104,31043,630
Percentage41.0%38.0%15.9%
SwingIncrease2.svg 0.5%Increase2.svg 6.5%Decrease2.svg 9.6%

Cambridgeshire UK local election 2005 map.svg
Results by electoral division. Striped wards have mixed representation.

Council control before election

Conservative

Council control after election

Conservative

An election to Cambridgeshire County Council took place on 5 May 2005 as part of the 2005 United Kingdom local elections. The election took place on the same day as the 2005 United Kingdom General Election. 69 councillors were elected from 60 electoral divisions, which returned either one or two county councillors each by first-past-the-post voting. New electoral division boundaries were brought in for this election, increasing the number of seats from the 59 seats at the 2001 Cambridgeshire County Council election. The Conservative Party retained their majority on the council, while the Labour Party lost all their rural councillors with their representation limited to the city of Cambridge.

Contents

Previous composition

2001 election

PartySeats
Conservative 34
Liberal Democrats 16
Labour 9
Total59

Composition of council seats before election

PartySeats
Conservative 33
Liberal Democrats 17
Labour 8
Independent 1
Total59

Results summary

Cambridgeshire County Council election, 2005 [1] [2] [3]
PartySeatsGainsLossesNet gain/lossSeats %Votes %Votes+/−
  Conservative 42135Increase2.svg 860.941.1112,543+0.6
  Liberal Democrats 23103Increase2.svg 733.338.0104,310+6.5
  Labour 405Decrease2.svg 54.315.943,630 [lower-alpha 1] –9.6
  Green 00000.04.010,979+2.0
  Independent 00000.00.61,625+0.6
  UKIP 00000.00.41,090+0.4

Party strength by electoral division

The following maps show the percentage of the vote each party obtained by electoral division. A colour key for each map can be viewed by clicking on the image.

Conservative Party Liberal Democrats
Cambridgeshire UK local election 2005 Con strength.svg Cambridgeshire UK local election 2005 LD strength.svg
Labour Party Green Party
Cambridgeshire UK local election 2005 Lab strength.svg Cambridgeshire UK local election 2005 Green strength.svg

Election of Group Leaders

John Walters (Sawtry and Ellington) was re-elected leader of the Conservative Group with John Reynolds (Bar Hill) re-elected as the deputy leader, Julian Huppert (East Chesterton) was re-elected leader of the Lib Dem Group with Judith Broadway (Soham and Fordham Villages) as the deputy leader, and Martin Ballard (Coleridge) was elected leader of the Labour Group with Christine Carter (Cherry Hinton) as the deputy leader.

Huppert would stand down as leader in May 2007 and was replaced by David Jenkins (Cottenham, Histon and Impington) with Peter Downes (Brampton and Kimbolton) as his deputy. Ballard would stand down as leader in May 2008 to be replaced with Paul Sales (Abbey).

Election of Leader of the Council

John Walters the leader of the conservative group was duly elected leader of the council and formed a conservative administration.

Walters would retire as leader in May 2007 [4] to be succeeded by Shona Johnston (Willingham) who had been the Cabinet Member for Children and Young People’s Services. Dennis Pegram (St Ives) was elected as deputy leader. However Johnstone was forced to resign after less than 6 months after admitting making an "inappropriate" phone call to a chief executive candidate. [5] Walters would return as leader until May 2008 when Jill Tuck (Waldersey) replaced him with Lawrence McGuire (Norman Cross) as her deputy.

Results by electoral division

Cambridge (14 seats)

District Summary

PartySeats+/-Votes%+/-
Liberal Democrat 10Increase2.svg 322,50843.17+3.60
Labour 4Decrease2.svg 314,34727.52−7.12
Conservative 0Steady2.svg9,93919.06−3.28
Green 0Steady2.svg5,22210.02+6.87
UKIP 0Steady2.svg1220.23+0.23

Division Results

Abbey
PartyCandidateVotes%
Labour Co-op Paul Sales 1,384 39.9
Liberal Democrats Edward Sexton1,03329.8
Conservative Simon Mitton63118.2
Green Margaret Wright 41612.0
Majority35110.1
Turnout 3,46455.5
Registered electors 6,244
Labour Co-op win (new boundaries)
Arbury
PartyCandidateVotes%
Liberal Democrats Rupert Moss-Eccardt 1,686 41.0
Labour Co-op Ian Kidman *1,38633.7
Conservative Shapour Meftah74318.1
Green Michael Smith2957.2
Majority3007.3
Turnout 4,11060.6
Registered electors 6,788
Liberal Democrats win (new boundaries)
Castle
PartyCandidateVotes%
Liberal Democrats John White * 2,132 52.2
Conservative Robert Boorman76718.8
Labour Jane Jacks73317.9
Green Stephen Lawrence45111.1
Majority1,36533.4
Turnout 4,08362.6
Registered electors 6,527
Liberal Democrats win (new boundaries)
Cherry Hinton
PartyCandidateVotes%
Labour Christine Carter * 1,633 40.5
Liberal Democrats Benjamin Hutchings1,10527.4
Conservative Edward MacNaghten1,05426.2
Green Neil Ford2375.9
Majority52813.1
Turnout 4,02964.0
Registered electors 6,292
Labour win (new boundaries)
Coleridge
PartyCandidateVotes%
Labour Martin Ballard * 1,255 35.9
Liberal Democrats Andrew Blackhurst1,20334.4
Conservative Steve Jones71820.6
Green Marilyn Carter2416.9
UKIP Albert Watts772.2
Majority521.5
Turnout 3,49459.9
Registered electors 5,829
Labour win (new boundaries)
East Chesterton
PartyCandidateVotes%
Liberal Democrats Julian Huppert * 1,411 39.2
Labour Janet Robertson1,18732.9
Conservative Kevin Francis69419.3
Green Peter Pope3068.5
Majority2246.2
Turnout 3,59860.8
Registered electors 5,916
Liberal Democrats win (new boundaries)
King's Hedges
PartyCandidateVotes%
Labour Primrose Hughes 1,228 36.9
Liberal Democrats Clive Hollins1,12933.9
Conservative Rhona Boorman72821.9
Green Gerhard Goldbeck-Wood2437.3
Majority993.0
Turnout 3,32855.2
Registered electors 6,027
Labour win (new boundaries)
Market
PartyCandidateVotes%
Liberal Democrats Gaynor Griffiths 1,877 50.1
Conservative Timothy Haire66517.8
Labour Elizabeth Walter61016.3
Green Martin Lucas-Smith59215.8
Majority1,21232.4
Turnout 3,74457.5
Registered electors 6,514
Liberal Democrats win (new boundaries)
Newnham
PartyCandidateVotes%
Liberal Democrats Alexander Reid * 1,978 50.7
Conservative Alasdair Ross70318.0
Labour Rita Gaggs67117.2
Green Anna Gomori-Woodcock55314.2
Majority1,27532.7
Turnout 3,90562.1
Registered electors 6,287
Liberal Democrats win (new boundaries)
Petersfield
PartyCandidateVotes%
Liberal Democrats Nichola Harrison 1,356 40.4
Labour Lucy Sheerman1,05231.3
Green John Collins52715.7
Conservative Rosemary Clarkson42612.7
Majority33049.0
Turnout ,36154.8
Registered electors 6,137
Liberal Democrats win (new boundaries)
Queen Edith's
PartyCandidateVotes%
Liberal Democrats Geoffrey Heathcock * 2,392 59.2
Conservative Andre Beaumont84821.0
Labour Co-op Leonard Freeman57414.2
Green Shayne Mitchell2255.6
Majority1,54438.2
Turnout 4,03963.0
Registered electors 6,412
Liberal Democrats win (new boundaries)
Romsey
PartyCandidateVotes%
Liberal Democrats Joanna Toomey 1,668 44.9
Labour Co-op Jozef Gluza *1,23533.3
Green Hamish Downer40210.8
Conservative Mark Fanken-Hall3599.7
UKIP Marjorie Barr451.2
Majority43311.7
Turnout 3,70959.1
Registered electors 6,278
Liberal Democrats win (new boundaries)
Trumpington
PartyCandidateVotes%
Liberal Democrats Anne Kent 1,669 50.9
Conservative John Ionides90427.6
Labour Co-op George Tudor43513.3
Green Ceri Galloway2668.1
Majority76523.4
Turnout 3,27461.1
Registered electors 5,355
Liberal Democrats win (new boundaries)
West Chesterton
PartyCandidateVotes%
Liberal Democrats Kevin Wilkins 1,869 46.7
Labour Simon Watkins96424.1
Conservative James Strachan69917.5
Green Sarah Peake46811.7
Majority90522.6
Turnout 4,00062.8
Registered electors 6,370
Liberal Democrats win (new boundaries)

East Cambridgeshire (9 seats)

District Summary

PartySeats+/-Votes%+/-
Liberal Democrat 6Increase2.svg 314,03340.84+4.28
Conservative 3Decrease2.svg 118,42153.61+13.17
Labour 0Steady2.svg1,5694.57−17.07
Green 0Steady2.svg3360.98−0.38

Division Results

Burwell
PartyCandidateVotes%
Liberal Democrats Hazel Williams 2,220 55.9
Conservative Lavinia Edwards1,74944.1
Majority47111.9
Turnout 3,96964.4
Registered electors 6,166
Liberal Democrats win (new boundaries)
Ely North and East
PartyCandidateVotes%
Liberal Democrats Nigel Bell 2,589 59.6
Conservative Victoria Hearne-Casapieri *1,75440.4
Majority83519.2
Turnout 4,34360.2
Registered electors 7,216
Liberal Democrats win (new seat)
Ely South and West
PartyCandidateVotes%
Liberal Democrats Linda Crossley 2,123 56.2
Conservative Andrew Mair *1,65643.8
Turnout 3,77964.7
Majority46712.4
Registered electors 5,846
Liberal Democrats win (new seat)
Haddenham
PartyCandidateVotes%
Conservative William Hunt 1,994 41.3
Liberal Democrats Gareth Wilson1,78937.1
Labour Michele Wilkinson71014.7
Green Astra Carter-Marsh3366.9
Majority2054.2
Turnout 3,77966.8
Registered electors 5,846
Conservative win (new seat)
Littleport
PartyCandidateVotes%
Liberal Democrats Brenda Bean 1,599 55.2
Conservative Frederick Brown1,29944.8
Majority30010.4
Turnout 3,77951.9
Registered electors 5,846
Liberal Democrats win (new boundaries)
Soham and Fordham Villages (2)
PartyCandidateVotes%
Liberal Democrats Judith Broadway 3,380 52.7
Conservative John Powley * 3,039 47.3
Liberal Democrats Michael Allan2,872
Conservative Jacqueline Petts2,837
Majority5435.3
Majority1672.8
Turnout 6,06450.6
Registered electors 11,979
Liberal Democrats win (new seat)
Conservative win (new seat)
Sutton
PartyCandidateVotes%
Liberal Democrats Philip Bailey 2,122 56.8
Conservative Philip Read *1,61743.3
Majority50513.5
Turnout 3,73963.2
Registered electors 5,920
Liberal Democrats win (new boundaries)
Woodditton
PartyCandidateVotes%
Conservative Mathew Shuter 2,476 49.7
Liberal Democrats Beate (Sisse) McCall1,64433.0
Labour Steven O'Dell85917.3
Majority83216.7
Turnout 4,97965.2
Registered electors 7,634
Conservative win (new boundaries)

Fenland (11 seats)

District Summary

PartySeats+/-Votes%+/-
Conservative 11Increase2.svg 221,23252.00+2.41
Liberal Democrat 0Steady2.svg11,06027.09+11.61
Labour 0Steady2.svg6,86516.81−17.43
Green 0Steady2.svg1,0842.65+2.65
UKIP 0Steady2.svg5921.45+1.45
Chatteris
PartyCandidateVotes%
Conservative Alan Melton * 1,604 46.0
Liberal Democrats David Upstone95527.4
Labour Susan Coomey92626.6
Majority64918.6
Turnout 3,48562.1
Registered electors 5,608
Conservative win (new boundaries)
Forty Foot
PartyCandidateVotes%
Conservative Geoffrey Harper * 2,114 52.6
Labour Grant Osbourn1,14228.4
Liberal Democrats Evelyn Bradford76519.0
Majority97224.2
Turnout 4,02162.9
Registered electors 6,385
Conservative win (new seat)
March East
PartyCandidateVotes%
Conservative Frederick Yeulett * 1,623 44.5
Labour Karon Webb1,19032.6
Liberal Democrats Michael Pitt55115.1
Green Christopher Bennett2877.9
Majority43311.9
Turnout 3,65160.9
Registered electors 5,997
Conservative win (new boundaries)
March North
PartyCandidateVotes%
Conservative John West 1,497 52.1
Liberal Democrats Edna Howarth1,37847.9
Majority1194.1
Turnout 2,87557.5
Registered electors 5,004
Conservative win (new seat)
March West
PartyCandidateVotes%
Conservative Michael Ogden * 2,105 57.6
Liberal Democrats Simon Rodgers1,54942.4
Majority15.2556
Turnout 3,65461.5
Registered electors 5,940
Conservative win (new boundaries)
Roman Bank and Peckover
PartyCandidateVotes%
Conservative Brian Hardy * 2,294 59.1
Liberal Democrats Toby Fisher1,59140.9
Majority70318.1
Turnout 3,88557.9
Registered electors 6,705
Conservative win (new seat)
Waldersey
PartyCandidateVotes%
Conservative Jillian Tuck * 2,164 58.8
Liberal Democrats Shirley Fieldhouse1,51741.2
Majority64717.6
Turnout 3,68157.7
Registered electors 6,375
Conservative win (new seat)
Whittlesey North
PartyCandidateVotes%
Conservative Martin Curtis 2,014 52.5
Labour Richard Hibbert1,34134.9
Liberal Democrats Malcolm Schofield48312.6
Majority67317.5
Turnout 3,83862.7
Registered electors 6,122
Conservative win (new seat)
Whittlesey South
PartyCandidateVotes%
Conservative Thomas Butcher 2,291 57.9
Labour Mark Goffrey1,08227.3
Liberal Democrats Thomas Yates58514.8
Majority1,20930.5
Turnout 3,95861.6
Registered electors 6,421
Conservative win (new seat)
Wisbech North
PartyCandidateVotes%
Conservative Leslie Sims 1,585 47.0
Labour Kevin Goddard1,18435.1
Liberal Democrats Anthony Morris60217.9
Majority40111.9
Turnout 3,37148.2
Registered electors 6,998
Conservative win (new seat)
Wisbech South
PartyCandidateVotes%
Conservative Simon King * 1,941 53.7
Liberal Democrats Louis Rodrigues1,08429.9
UKIP Paul Clapp59216.4
Majority85723.7
Turnout 3,61751.0
Registered electors 7,091
Conservative win (new seat)

Huntingdonshire (19 seats)

District Summary

PartySeats+/-Votes%+/-
Conservative 17Increase2.svg 435,57647.41−2.16
Liberal Democrat 2Steady2.svg24,43932.57+1.82
Labour 0Steady2.svg13,02917.36−1.96
Independent 0Steady2.svg1,6252.17+2.17
UKIP 0Steady2.svg3760.50+0.50

Division Results

Brampton and Kimbolton
PartyCandidateVotes%
Liberal Democrats Peter Downes * 2,563 48.3
Conservative Ian Gardner2,28542.1
Labour Robert Pugh4608.7
Majority2785.2
Turnout 5,30873.7
Registered electors 7,203
Liberal Democrats win (new seat)
Buckden, Gransden and The Offords
PartyCandidateVotes%
Conservative Barbara Boddington 2,092 47.6
Liberal Democrats William Clough1,27729.1
Independent Alec Stenner *57913.2
Labour David Nicholls44210.1
Majority81518.6
Turnout 4,39072.1
Registered electors 6,086
Conservative win (new seat)
Godmanchester (2)
PartyCandidateVotes%
Conservative Jeffery Dutton 3,114 45.7
Conservative Colin Hyams 2,847
Liberal Democrats Peter Fleming2,39735.2
Liberal Democrats Michael Shellens2,047
Labour William Hennessey1,30119.1
Labour David Brown1,298
Majority71710.5
Turnout 6,50257.5
Registered electors 11,311
Conservative win (new seat)
Huntingdon (2)
PartyCandidateVotes%
Conservative Peter Brown 2,830 47.9
Conservative Elaine Kadic 2,352
Liberal Democrats Michael Burrell1,37523.3
Labour Ann Beevor1,33022.5
Liberal Democrats Ann Monk1,227
Labour David King1,119
UKIP Leonard Bruce3766.4
UKIP Andrew Manning326
Majority1,45524.6
Turnout 5,46852.1
Registered electors 10,501
Conservative win (new seat)
Little Paxton and St Neots North (2)
PartyCandidateVotes%
Conservative David Harty 3,598 49.6
Conservative Sharon Lee 3,342
Liberal Democrats Robert Eaton2,38832.9
Liberal Democrats Gordon Thorpe2,017
Labour Janet Boston1,27217.5
Labour Patricia Nicholls1,240
Majority1,21016.7
Turnout 6,93055.9
Registered electors 12,407
Conservative win (new seat)
Norman Cross (2)
PartyCandidateVotes%
Conservative Lawrence McGuire * 3,454 48.0
Conservative William Hensley * 3,108
Labour Margaret Cochrane2,00927.9
Liberal Democrats John Davidson1,72724.0
Labour Graeme Watkins1,573
Liberal Democrats Janet Dutton1,328
Majority1,44520.1
Turnout 6,60054.8
Registered electors 12,034
Conservative win (new boundaries)
Conservative win (new seat)
Ramsey
PartyCandidateVotes%
Conservative Susan Normington * 1,737 46.3
Liberal Democrats Raymond Powell1,41237.6
Labour Carol Harper60316.1
Majority3258.7
Turnout 3,75258.9
Registered electors 6,373
Conservative win (new boundaries)
Sawtry and Ellington
PartyCandidateVotes%
Conservative John Walters * 2,898 58.1
Liberal Democrats Martin Land1,24424.9
Labour Mary Howell84616.9
Majority1,65433.2
Turnout 4,98867.9
Registered electors 7,352
Conservative win (new seat)
Somersham and Earith
PartyCandidateVotes%
Conservative John Eddy * 2,386 49.2
Liberal Democrats Anthony Hulme1,81437.4
Labour Mark Holman64913.38
Majority57211.8
Turnout 4,84966.5
Registered electors 7,296
Conservative win (new seat)
St Ives (2)
PartyCandidateVotes%
Conservative Kevin Reynolds 3,747 42.3
Conservative Dennis Pegram 3,229
Liberal Democrats David Hodge2,69130.4
Liberal Democrats Gillian Jackson2,471
Labour Richard Allen1,36815.5
Labour Angela Richards1,191
Independent Stuart Littlewood1,04611.8
Majority1,05611.9
Turnout 787255.5
Registered electors 14,194
Conservative win (new seat)
St Neots Eaton Socon (2)
PartyCandidateVotes%
Liberal Democrats Sandra Giles * 2,405 38.7
Conservative Rodney Farrer 2,293 36.9
Liberal Democrats Ian Taylor2,055
Conservative Paul Ursell1,935
Labour Anthony Gregory1,52424.5
Labour William O'Connor1,337
Majority1121.8
Turnout 5,77550.6
Registered electors 11,412
Liberal Democrats win (new seat)
Conservative win (new seat)
The Hemingfords and Fenstanton
PartyCandidateVotes%
Conservative Ian Bates * 2,598 52.8
Liberal Democrats Mark Rainer1,65733.7
Labour John Watson66213.5
Majority94119.1
Turnout 4,91769.8
Registered electors 7,042
Conservative win (new seat)
Warboys and Upwood
PartyCandidateVotes%
Conservative Victor Lucas * 2,544 55.4
Liberal Democrats John Souter1,48932.4
Labour Steven Hicks56312.3
Majority1,05523.0
Turnout 4,59664.6
Registered electors 7,112
Conservative win (new seat)

South Cambridgeshire (16 seats)

District Summary

PartySeats+/-Votes%+/-
Conservative 11Increase2.svg 330,21241.96+1.97
Liberal Democrat 5Increase2.svg 128,83740.05+7.49
Labour 0Decrease2.svg 27,82010.86−11.24
Green 0Steady2.svg5,1347.13+2.99

Division Results

Bar Hill
PartyCandidateVotes%
Conservative John Reynolds * 2,266 45.8
Liberal Democrats Thomas Flanagan1,80836.6
Labour John Shepherd87017.6
Majority4589.3
Turnout 4,94469.5
Registered electors 7,111
Conservative win (new seat)
Bassingbourn
PartyCandidateVotes%
Conservative Linda Oliver * 1,981 54.4
Liberal Democrats Ashley Woodford98226.9
Green Simon Saggers67918.6
Majority99927.4
Turnout 3,64267.3
Registered electors 5,414
Conservative win (new seat)
Bourn
PartyCandidateVotes%
Conservative Lister Wilson * 1,125 45.3
Liberal Democrats Jonathan Hansford80732.5
Labour Mark Hurn40616.4
Green Pauline Radley1435.8
Majority31812.8
Turnout 2,48168.8
Registered electors 3,606
Conservative win (new seat)
Cottenham, Histon and Impington (2)
PartyCandidateVotes%
Conservative Matthew Bradney 3,269 36.8
Liberal Democrats John (David) Jenkins 3,213 36.2
Conservative Peter Hudson2,717
Liberal Democrats Linden Leeke2,377
Labour Helen Wright1,45316.4
Labour Aidan Hervey1,357
Green Mark Claessen94910.7
Majority560.6
Turnout 7,66861.7
Registered electors 12,429
Conservative win (new seat)
Liberal Democrats win (new seat)
Duxford
PartyCandidateVotes%
Liberal Democrats Timothy Stone 2,140 43.9
Conservative Robin Driver *2,10043.1
Labour Alexandra Mayer 63413.0
Majority400.8
Turnout 4,87472.9
Registered electors 6,690
Liberal Democrats win (new seat)
Fulbourn
PartyCandidateVotes%
Conservative Robert Turner 2,010 43.2
Liberal Democrats Frances Amrani1,93941.7
Green Mary Lawson70515.2
Majority711.5
Turnout 4,65461.1
Registered electors 7,619
Conservative win (new boundaries)
Gamlingay
PartyCandidateVotes%
Liberal Democrats Sebastian Kindersley 2,541 45.1
Conservative Josephine Percy2,08436.9
Labour Mirian Lynn66311.8
Green Stephen Edmondson3476.2
Majority4578.1
Turnout 5,63572.8
Registered electors 7,742
Liberal Democrats win (new boundaries)
Hardwick
PartyCandidateVotes%
Conservative Denzil Baldwin 2,168 41.3
Liberal Democrats Livia Mitson1,85535.4
Labour John Kazer78614.9
Green William Connolley 4388.4
Majority3136.0
Turnout 5,24771.8
Registered electors 7,304
Conservative win (new seat)
Linton
PartyCandidateVotes%
Liberal Democrats John Batchelor 2,298 43.7
Conservative Peter Hase2,02338.5
Labour Michael Gale69613.2
Green William Quinn2404.6
Majority2755.2
Turnout 5,25772.8
Registered electors 7,222
Liberal Democrats win (new boundaries)
Melbourn
PartyCandidateVotes%
Conservative David McCraith 2,083 42.1
Liberal Democrats Anthony Milton *1,85437.4
Labour Donald McCallum73514.8
Green Sally Nichols2815.7
Majority2294.6
Turnout 4,95370.5
Registered electors 7,031
Conservative win (new boundaries)
Papworth and Swavesey
PartyCandidateVotes%
Conservative Mandy Smith 2,033 52.5
Liberal Democrats Robin Martlew1,84047.5
Majority1935.0
Turnout 3,87367.9
Registered electors 5,707
Conservative win (new seat)
Sawston (2)
PartyCandidateVotes%
Conservative Christine Kenney 3,270 37.9
Conservative Anthony Orgee * 3,225
Liberal Democrats Max Campbell2,91533.7
Liberal Democrats David Ford2,829
Labour Ronald Hornby1,57718.3
Labour Pamela Stacey1,521
Green Jacquelyn Garfit87710.2
Majority3554.1
Turnout 8,10761.8
Registered electors 13,118
Conservative win (new boundaries)
Conservative win (new seat)
Waterbeach
PartyCandidateVotes%
Liberal Democrats Robert Williamson 2,820 61.2
Conservative Gerda Covell1,78938.8
Majority1,03122.4
Turnout 4,60963.4
Registered electors 7,276
Liberal Democrats win (new boundaries)
Willingham
PartyCandidateVotes%
Conservative Shona Johnstone * 2,011 46.7
Liberal Democrats Rebecca Mead1,82542.3
Green Marion Barber47511.0
Majority1864.3
Turnout 4,31165.8
Registered electors 6,552
Conservative win (new boundaries)

Related Research Articles

<span class="mw-page-title-main">Peterborough City Council</span> Local authority in England

Peterborough City Council is the local authority for Peterborough in the East of England. It is a unitary authority, having the powers of a non-metropolitan county and district council combined. The City was incorporated as a municipal borough in 1874; from 1888, it fell within the jurisdiction of the Soke of Peterborough county council and from 1965, Huntingdon and Peterborough county council. In 1974, it was replaced by a wholly new non-metropolitan district, broadly corresponding to the Soke, in the new enlarged Cambridgeshire. In 1998, Peterborough became independent of Cambridgeshire as a unitary authority, but the city continues to form part of that county for ceremonial purposes as defined by the Lieutenancies Act 1997.

<span class="mw-page-title-main">Cambridgeshire County Council</span> The elected administrative body governing Cambridgeshire, England

Cambridgeshire County Council is the county council of Cambridgeshire, England. The council consists of 61 councillors, representing 59 electoral divisions. The council is based at New Shire Hall in Alconbury Weald, near Huntingdon. It is part of the East of England Local Government Association and a constituent member of the Cambridgeshire and Peterborough Combined Authority.

<span class="mw-page-title-main">2005 Suffolk County Council election</span> 2005 UK local government election

Elections to Suffolk County Council were held on 5 May 2005. The whole council was up for election with boundary changes since the last election in 2001 reducing the number of seats by 5. The Conservative Party gained control of the council from no overall control.

<span class="mw-page-title-main">2009 Suffolk County Council election</span> 2009 UK local government election

Elections to Suffolk County Council were held on 4 June 2009 as part of the 2009 United Kingdom local elections on the same day as the elections to the European Parliament. 75 councillors were elected from 63 electoral divisions, which returned either one or two county councillors each by first-past-the-post voting for a four-year term of office. The electoral divisions were the same as those used at the previous election in 2005.

<span class="mw-page-title-main">2009 Essex County Council election</span> 2009 UK local government election

An election to Essex County Council took place on 4 June 2009 as part of the 2009 United Kingdom local elections. The elections had been delayed from 7 May, to coincide with elections to the European Parliament. 75 councillors were elected from various electoral divisions, which returned either one or two county councillors each by first-past-the-post voting for a four-year term of office. The electoral divisions were the same as those used at the previous election in 2005.

<span class="mw-page-title-main">2013 Norfolk County Council election</span> 2013 UK local government election

The Norfolk County Council election took place across Norfolk on 2 May 2013, coinciding with local elections for all county councils in England. The results were announced the following day, Friday 3 May 2013. The result brought to an end 12 years of Conservative administration, who finished three seats short of a majority after losing 20 seats, leaving the Council in no overall control (NOC). UKIP and the Labour Party both made gains of 14 and 11 seats respectively. The Liberal Democrats and the Green Party both lost three seats each, whilst an independent won a single seat in North Norfolk.

<span class="mw-page-title-main">2013 Cambridgeshire County Council election</span>

An election to Cambridgeshire County Council took place on 2 May 2013 as part of the 2013 United Kingdom local elections. 69 councillors were elected from 60 electoral divisions, which returned either one or two county councillors each by first-past-the-post voting for a four-year term of office. The electoral divisions were the same as those used at the previous election in 2009. No elections were held in Peterborough, which is a unitary authority outside the area covered by the County Council. The election saw the Conservative Party lose overall control of the council.

<span class="mw-page-title-main">2013 Essex County Council election</span> 2013 UK local government election

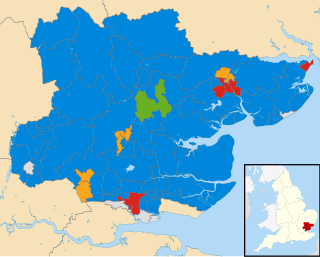
An election to Essex County Council took place on 2 May 2013 as part of the 2013 United Kingdom local elections. 75 councillors were elected from 70 electoral divisions, which returned either one or two county councillors each by first-past-the-post voting for a four-year term of office. The electoral divisions were the same as those used at the previous election in 2009. No elections were held in Thurrock or Southend-on-Sea, which are unitary authorities outside the area covered by the County Council.

<span class="mw-page-title-main">2013 Suffolk County Council election</span> 2013 UK local government election

Elections to Suffolk County Council took place on 2 May 2013 as part of the 2013 United Kingdom local elections. 75 councillors were elected from 63 electoral divisions, which returned either one or two county councillors each by first-past-the-post voting for a four-year term of office. The electoral divisions were the same as those used at the previous election in 2009.

<span class="mw-page-title-main">2005 Essex County Council election</span> English local authority election

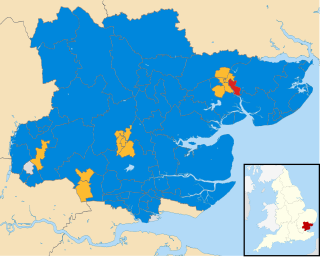
An election to Essex County Council took place on 9 May 2005 as part of the 2005 United Kingdom local elections. 75 councillors were elected from various electoral divisions, which returned either one or two county councillors each by first-past-the-post voting for a four-year term of office. The electoral divisions were redrawn for this election.

An election to Essex County Council took place on 7 June 2001 as part of the 2001 United Kingdom local elections. 79 councillors were elected from various electoral divisions, which returned either one or two county councillors each by first-past-the-post voting for a four-year term of office. The electoral divisions were the same as those used at the previous election in 1997.

An election to Essex County Council took place on 1 May 1997 as part of the 1997 United Kingdom local elections. 79 councillors were elected from various electoral divisions, which returned either one or two county councillors each by first-past-the-post voting for a four-year term of office. With the creation of Southend-on-Sea Borough Council and Thurrock Council in 1998 the number of seats contested at this election was reduced by 19. In 1993 the breakdown of these seats were, Lab 9 Con 5 LD 5.

<span class="mw-page-title-main">2017 Essex County Council election</span> 2017 UK local government election

Elections to Essex County Council took place on 4 May 2017 as part of the 2017 local elections. All 75 councillors were elected from 70 electoral divisions, which each returned either one or two councillors by first-past-the-post voting for a four-year term of office.

<span class="mw-page-title-main">2017 Cambridgeshire County Council election</span> 2017 UK local government election

The 2017 Cambridgeshire County Council election was held on 4 May 2017 as part of the 2017 local elections in the United Kingdom. All 61 councillors were elected from 59 electoral divisions, which returned either one or two county councillors each by first-past-the-post voting for a four-year term of office.

<span class="mw-page-title-main">2017 Norfolk County Council election</span> 2017 UK local government election

The 2017 Norfolk County Council election took place on 4 May 2017 as part of the 2017 local elections in the United Kingdom.

<span class="mw-page-title-main">2017 Suffolk County Council election</span> 2017 UK local government election

The 2017 Suffolk County Council election took place on 4 May 2017 as part of the 2017 local elections in the United Kingdom. All 75 councillors were elected from 63 electoral divisions, which returned either one or two county councillors each, by first-past-the-post voting, for a four-year term of office.

<span class="mw-page-title-main">2021 Cambridgeshire and Peterborough mayoral election</span>

The 2021 Cambridgeshire and Peterborough mayoral election was held on 6 May 2021 to elect the mayor of Cambridgeshire and Peterborough.

<span class="mw-page-title-main">2021 Cambridgeshire County Council election</span>

The 2021 Cambridgeshire County Council election took place on 6 May 2021 as part of the 2021 local elections in the United Kingdom. All 61 councillors were elected from 59 electoral divisions, which returned either one or two county councillors each by first-past-the-post voting for a four-year term of office. The election was held alongside a full election for Cambridge City Council, the Cambridgeshire Police and Crime Commissioner, Mayor of Cambridgeshire and Peterborough and one-third of Peterborough City Council.

<span class="mw-page-title-main">2021 Suffolk County Council election</span> 2021 UK local government election

The 2021 Suffolk County Council election took place on 6 May 2021 as part of the 2021 local elections in the United Kingdom. All 75 councillors were elected from 63 electoral divisions, which return either one or two county councillors each, by first-past-the-post voting, for a four-year term of office.

<span class="mw-page-title-main">2021 Essex County Council election</span> 2021 UK local government election

The 2021 Essex County Council election took place on 6 May 2021 as part of the 2021 United Kingdom local elections. All 75 councillors were elected from 70 electoral divisions, with each returning either one or two councillors by first-past-the-post voting for a four-year term of office.

References

  1. "Election results and information for 2005". Cambridgeshire County Council. Archived from the original on 12 June 2012. Retrieved 18 April 2012.
  2. "Local election results: Cambridgeshire". BBC News. Retrieved 18 April 2012.
  3. "Cambridgeshire". Andrew Teale. Retrieved 18 April 2012.
  4. "County council leader steps down". BBC News. 26 March 2007. Retrieved 1 June 2022.
  5. "Shona Johnstone resigns". Hunts Post. 12 November 2007. Retrieved 1 June 2022.