2013 Northamptonshire County Council election

Last updated

2013 Northamptonshire County Council election [1]
Flag of England.svg
  2009 2 May 2013 2017  

All 57 seats in the Northamptonshire County Council
29 seats needed for a majority
 First partySecond party
 
Party Conservative Labour
Seats won3611
Seat changeDecrease2.svg20Increase2.svg5
Popular vote59,66743,149
Percentage36.5%26.4%

 Third partyFourth party
 
Party Liberal Democrats UKIP
Seats won63
Seat changeDecrease2.svg3Increase2.svg3
Popular vote14,68736,607
Percentage9.0%22.4%

Northamptonshire UK local election 2013 map.svg
Map showing the results of the 2013 Northamptonshire County Council elections.

Council control before election

Conservative

Council control after election

Conservative

District Councils Northants 2.jpg

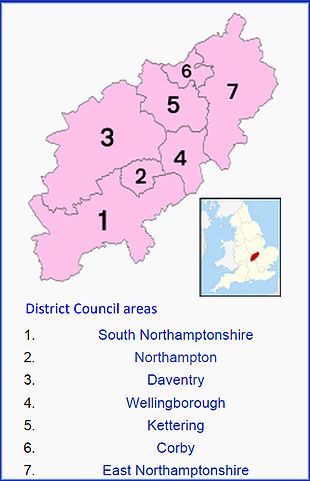
An election to Northamptonshire County Council took place on 2 May 2013 as part of the 2013 United Kingdom local elections. [2] Following a boundary review, the number of county councillors was reduced from 73 to 57 from this election. [n 1] All members were elected by first-past-the-post voting from single-member electoral divisions for a four-year term of office. The Conservative Party held on to their overall majority, having held overall control of the council since 2005.

Contents

All locally registered electors (British, Irish, Commonwealth and European Union citizens) who were aged 18 or over on Thursday 2 May 2013 were entitled to vote in the local elections. [3] Those who were temporarily away from their ordinary address (for example, away working, on holiday, in student accommodation or in hospital) were also entitled to vote in the local elections, although those who had moved abroad and registered as overseas electors cannot vote in the local elections. It is possible to register to vote at more than one address (such as a university student who had a term-time address and lives at home during holidays) at the discretion of the local Electoral Register Office, but it remains an offence to vote more than once in the same local government election. [4]

Summary

The election saw the Conservatives maintain overall control of the council with a reduced majority of 8 seats. The Labour Party regained their status as the council's official opposition group with 11 seats, a net gain of five. The Liberal Democrats had 6 members elected, a net loss of three. UKIP achieved 3 council seats, while one independent candidate was elected.

Results

Northamptonshire County Council Election Result 2013
PartySeatsGainsLossesNet gain/lossSeats %Votes %Votes+/−
  Conservative 36-2063.1636.761,128-14.6
  Labour 11+519.30%26.143,479+6.6
  Liberal Democrats 6-310.53%8.714,494-12.1
  UKIP 330+35.26%22.837,874+22.8
  Independent 101-11.75%4.16,875-2.0
  Green 000001.52,500-0.8

Results by Division

Corby

Corby Rural [5]
PartyCandidateVotes%
Conservative Stan Heggs 738 28.1
UKIP Margot Parker 64024.4
Labour Jonathan West63324.1
Liberal Democrats Bob Riley61423.4
Turnout 262539.81
Corby West [5]
PartyCandidateVotes%
Labour Julie Brookfield 1,916 59.6
Conservative Eve Howitt55717.3
Independent Stuart McKay41212.8
BNP Marc Riddell2267.0
Liberal Democrats Philip Bromhall1043.2
Turnout 321532.17
Kingswood [5]
PartyCandidateVotes%
Labour John McGhee 1,850 69.9
Conservative Helen Harrison36813.9
BNP Stella Wright2459.2
Green Steven Scrutton1104.1
Liberal Democrats Eddie McGeown843.2
Turnout 265725.48
Lloyds [5]
PartyCandidateVotes%
Labour Bob Scott 1,923 61.7
UKIP Fred Parker67021.5
Conservative Christopher Woolmer39212.6
BNP Gordon Riddell702.2
Liberal Democrats Terri Meechan601.9
Turnout 311529.2
Oakley [5]
PartyCandidateVotes%
Labour Mary Butcher 1,110 38.4
UKIP Peter McGowan65822.8
Liberal Democrats Chris Stanbra56519.6
Conservative David Sims51817.9
BNP James Campbell361.2
Turnout 288730.11

Daventry

Braunston & Crick
PartyCandidateVotes%
Conservative Steve Slatter 1,008 34.0
UKIP Derek Whitaker93231.5
Labour Abigail Campbell88429.8
Liberal Democrats Pamela Varnsverry1384.7
Turnout 296232.1
Brixworth
PartyCandidateVotes%
Conservative Catherine Boardman 1,683 51.0
UKIP Pamela Booker82625.0
Labour Robert MaNally43613.2
Green Steve Whiffen2216.7
Liberal Democrats Liz Pym1334.0
Turnout 329936.33
Daventry East
PartyCandidateVotes%
Conservative Alan Hills 896 43.6
UKIP Eric Macanndrais57628.0
Labour Ken Ritchie 53025.8
Independent Alan Gordon†542.6
Turnout 205627.57

Trade Unions and Socialists against cuts

Daventry West
PartyCandidateVotes%
UKIP Adam Collyer 721 33.9
Conservative Chris Long68332.1
Labour Wendy Randall65730.9
Liberal Democrats Luisa Pereira663.1
Turnout 212722.57
Long Buckby
PartyCandidateVotes%
Conservative Steve Osborne 1,421 46.0
UKIP Beverley Rundle80412.0
Labour Christopher Lee54917.8
Liberal Democrats Neil Farmer2638.5
Independent Tom Price†511.7
Turnout 308836.36

Trade Unions and Socialists against cuts

Moulton
PartyCandidateVotes%
Conservative Judy Shephard 1,447 46.1
UKIP Ian Dexter1,01732.4
Labour Mark Maryan46814.9
Liberal Democrats Jacqueline Glynane1304.1
CPA Timothy Webb752.4
Turnout 313736.66
Woodford & Weedon
PartyCandidateVotes%
Conservative Robin Brown 1,295 49.3
UKIP Debra Perry70526.8
Labour Ron Pursey38514.7
Liberal Democrats Christopher Salaman2027.7
Independent Bea Price†391.5
Turnout 262629.73

Trade Unions and Socialists against cuts

East Northamptonshire

Higham Ferrers
PartyCandidateVotes%
Conservative Derek Lawson 1,184 44.2
UKIP Jo Faulkner66726.0
Labour Angela White38514.4
Independent Richard Gell29911.2
Liberal Democrats Joshua Dixon1164.3
Turnout 268129.44
Irthlingborough
PartyCandidateVotes%
Conservative Sylvia Hughes 1,436 48.0
Labour Jon Gray1,26342.2
BNP John Whitestone2959.9
Turnout 299431.04
Oundle
PartyCandidateVotes%
Conservative Heather Smith 1,849 55.6
UKIP Linda Saunders67720.4
Labour Chris Cox57317.2
Liberal Democrats George Smid2256.8
Turnout 332435.78
Raunds
PartyCandidateVotes%
Conservative Dudley Hughes 1,351 51.9
Labour Pauline Ellis1,02939.5
Liberal Democrats Garth Ratcliffe2258.6
Turnout 260531.24
Rushden Pemberton West
PartyCandidateVotes%
Conservative Michael Tye 1,366 47.2
UKIP David Hamblin74125.6
Labour Keith Cox70924.5
Liberal Democrats Anthony Woods802.8
Turnout 289630.4
Rushden South
PartyCandidateVotes%
Conservative Andy Mercer 1,386 48.0
UKIP Dan Blair72525.1
Labour Les Rolfe63121.9
Liberal Democrats David Hooton1445.0
Turnout 288627.89
Thrapston
PartyCandidateVotes%
Conservative Wendy Brackenbury 1,380 37.9
UKIP Joseph Garner93025.5
Labour Gordon Stewart57015.6
Independent Bob Seery39310.8
Independent Peter Baden1283.5
Green Thomas Wand1243.4
Liberal Democrats David Burgess1193.3
Turnout 364435.29

Kettering

Burton & Broughton
PartyCandidateVotes%
Independent Christopher Groome 799 34.1
Conservative Steve Bellamy60926.0
UKIP Daniel Perkins56624.1
Labour Ian Watts31913.6
Liberal Democrats David Garlick512.2
Turnout 234428.55
Clover Hill
PartyCandidateVotes%
Conservative Bill Parker 1,208 43.2
Labour Harvey Bhandal83029.7
UKIP Eddie Brace56620.3
English Democrat Victoria Hilling1174.2
Liberal Democrats John Crake732.6
Turnout 279430.94
Croyland & Swanspool
PartyCandidateVotes%
Conservative Graham Lawman 944 37.9
Labour Tony Aslam79732.0
UKIP Peter Jakeways60424.2
English Democrat Tony Spencer1496.0
Turnout 249428.06
Desborough
PartyCandidateVotes%
Conservative Allan Matthews 1,014 28.2
Independent Belinda Humfrey95226.5
UKIP Paul Oakden63517.7
Labour John Padwick61017.0
English Democrat Kevin Sills1905.3
Liberal Democrats Stanley Freeman1243.4
BNP Clive Skinner712.0
Turnout 359635.25
Hatton Park
PartyCandidateVotes%
Conservative Malcolm Waters 1,306 39.6
UKIP Allan Shipham88426.8
Labour Andrea Watts77623.5
English Democrat Rob Walker1334.0
Green Emma Hornett1113.4
Liberal Democrats Norman Jones892.7
Turnout 329932.5
Ise
PartyCandidateVotes%
Conservative Jim Harker 1,307 40.5
UKIP Jonathan Bullock 1,13335.1
Labour Harjinder Singh67120.8
Liberal Democrats Alan Window1203.7
Turnout 323138.85
Northall
PartyCandidateVotes%
Labour Mick Scrimshaw 1,025 38.3
Conservative Larry Henson96135.9
UKIP Dan Gaskin59722.3
Liberal Democrats Portia Wilson943.5
Turnout 267726.96
Rothwell & Mawsley
PartyCandidateVotes%
Conservative James Hakewell 1,172 37.9
UKIP Alan Pote97131.4
Labour Margaret Draper84027.2
Liberal Democrats Philip Rice1103.6
Turnout 309334.42
Wickstead
PartyCandidateVotes%
Conservative Russel Roberts 1,113 39.6
UKIP Jehad Soliman79028.1
Labour Maureen Shram77527.6
Liberal Democrats Christopher McGlynn1354.8
Turnout 281330.58
Windmill
PartyCandidateVotes%
Labour Eileen Hales 859 36.7
UKIP John Raffill70430.1
Conservative Chris Smith-Haynes55423.7
English Democrat Derek Hilling1325.6
Liberal Democrats David Tate913.9
Turnout 234026.89

Northampton

Abington & Phippsville
PartyCandidateVotes%
Labour Danielle Stone 885 31.8
Conservative Rebecca Harding83530.0
Liberal Democrats Brian Hoare45216.3
UKIP Karim Ayoubi33512.1
Green Jac Higgs2739.8
Turnout 278020.19
Boothville & Parklands
PartyCandidateVotes%
Conservative Mike Hallam 1,513 47.3
UKIP Colin Lill73222.9
Labour Ben Wesson67121.0
Liberal Democrats Mike Torpy1946.1
Green Anthony Lochmuller912.8
Turnout 320135.7
Castle
PartyCandidateVotes%
Labour Winston Strachan 806 39.5
Green Tony Clarke 43721.4
Conservative Chris Kellett30314.8
UKIP Dusan Torbica27313.4
Liberal Democrats Aktar Hussein1718.4
Independent Mohammed Azir512.5
Turnout 204121.1
Dallington Spencer
PartyCandidateVotes%
Labour Gareth Eales 937 46.1
Liberal Democrats Jenny Conroy49424.3
Conservative Luke Graystone37118.3
Green Eamonn Fitzpatrick23011.3
Turnout 203223.42
Delapre & Rushmere
PartyCandidateVotes%
Liberal Democrats Brendan Glynane 851 34.4
Labour Rhea Keehn69528.1
Conservative Andrew Kilbride62025.1
BNP Mark Plowman2168.7
Independent Steve White†923.7
Turnout 247427.52

Trade Unions & Socialists against cuts

Duston East
PartyCandidateVotes%
Conservative Suresh Patel 1,039 38.9
Independent Dave Green†80930.3
Labour Ulric Gravesande50418.9
Green Hannah Gibson2208.2
Liberal Democrats Michael Quinn993.7
Turnout 267128.91

Northampton Save our Services

Duston West & St Crispin
PartyCandidateVotes%
Conservative Matthew Golby 1,179 61.8
Labour Beverly Mennell48325.3
Liberal Democrats Julia Lynne24612.9
Turnout 190827.48
East Hunsbury & Shelfleys
PartyCandidateVotes%
Conservative Andre Gonzalez de Savage 1,126 41.2
UKIP John Howsam77328.3
Labour Bob Burnell47417.3
Green Gary Burgess1917.0
Liberal Democrats Charles Markham1726.3
Turnout 273629.16
Headlands
PartyCandidateVotes%
Labour Arthur McCutcheon 894 29.5
UKIP Colin Bricher81626.9
Conservative Matt Lynch74624.6
Liberal Democrats Marion Minney37012.2
Green Marcus Rock1645.4
BNP Marc Whitestone391.3
Turnout 302931.34
Kingthorpe North
PartyCandidateVotes%
UKIP Michael Brown 1,042 33.8
Conservative Mary Markham94830.8
Labour Clement Chunga69122.4
Liberal Democrats Trini Crake3049.9
BNP Peter Whitestone973.1
Turnout 308231.71
Kingthorpe South
PartyCandidateVotes%
Liberal Democrats Sally Beardsworth 872 33.8
Labour Zoe Smith63126.5
UKIP Colin Pearson49020.6
Conservative John Yates29612.4
Green David Phillips923.9
Turnout 238124.11
Nene Valley
PartyCandidateVotes%
Conservative Phil Larratt 948 37.5
UKIP Alan Price61424.3
Independent Liam Costello45017.8
Labour Steven Brooks40916.2
Liberal Democrats Cerri Glynane1064.2
Turnout 252729.44
Riverside Park
PartyCandidateVotes%
Conservative Stephen Legg 1,298 40.9
UKIP Kevin Reeve85026.8
Labour Janice Duffy81925.8
Liberal Democrats Richard Arterton2036.4
Turnout 317031.95
Sixfields
PartyCandidateVotes%
Liberal Democrats Jill Hope 865 37.4
Conservative Brandon Eldred81335.1
Labour Viv Dams63727.5
Turnout 231524.25
St George
PartyCandidateVotes%
Liberal Democrats Sarah Uldall 771 31.4
Labour Rufia Ashraf67127.3
UKIP Robin Fruish55322.5
Conservative Michael O'Connor33413.6
Green Julie Hawkins1265.1
Turnout 245527.06
Talavera
PartyCandidateVotes%
Liberal Democrats Dennis Meredith 1,040 38.9
Labour Ifty Choudary81930.6
UKIP John Allen55620.8
Conservative Sheila Roberts2609.7
Turnout 267527.24

South Northamptonshire

Brackley
PartyCandidateVotes%
UKIP Jim Broomfield 1,012 38.7
Conservative Ron Sawbridge95236.4
Labour Douglas Barry42216.1
Liberal Democrats Jane Hollis2318.8
Turnout 261725.63
Bugbrooke
PartyCandidateVotes%
Conservative Joan Kirkbride 1,758 48.9
UKIP Wes Charlesworth1,15032.0
Labour Lynda Davies48613.5
Liberal Democrats Shaun Hope2005.6
Turnout 359435.03
Deanshanger
PartyCandidateVotes%
Conservative Allen Walker 1,708 63.0
Labour John Rawlings67124.8
Liberal Democrats Lisa Samiotis33012.2
Turnout 270933.44
Hackleton & Grange Park
PartyCandidateVotes%
Conservative Michael Clarke 1,553 42.3
UKIP Tom Rubython1,50441.0
Labour Ian Grant44912.2
Liberal Democrats Angela Paterson1654.5
Turnout 367136.59
Middleton Cheney
PartyCandidateVotes%
Conservative Ken Melling 1,165 42.8
UKIP Stafford Nash96335.4
Labour Bernard Rooney35713.1
Liberal Democrats Martin Johns2398.8
Turnout 272430.55
Silverstone
PartyCandidateVotes%
Conservative Ian Morris 1,676 48.3
UKIP Peter Conquest98228.3
Labour Lucy Mills52715.2
Liberal Democrats Scott Collins2868.2
Turnout 347134.74
Hackleton & Grange Park
PartyCandidateVotes%
Conservative Michael Clarke 1,553 42.3
UKIP Tom Rubython1,50441.0
Labour Ian Grant44912.2
Liberal Democrats Angela Paterson1654.5
Turnout 367136.59
Towcester & Roade
PartyCandidateVotes%
Liberal Democrats Chris Lofts 1,226 35.6
Conservative Andrew Grant97628.3
UKIP Barry Mahoney79923.2
Labour Mike Caseman-Jones40811.8
BNP John Hughes361.0
Turnout 344533.58

Wellingborough

Brickhill & Queensway
PartyCandidateVotes%
Labour Elizabeth Coombe 899 32.2
Conservative David Dean87431.3
UKIP Michael Curtis83529.9
Green Jonathan Hornett1103.9
BNP David Robinson702.5
Turnout 278830.47
Croyland & Swanspool
PartyCandidateVotes%
Conservative Grayham Lawman 944 37.9
Labour Tony Aslam79732.0
UKIP Peter Jakeways60424.2
English Democrat Tony Spencer1496.0
Turnout 249428.06
Earls Barton
PartyCandidateVotes%
Conservative Paul Bell 1,768 46.0
UKIP Debra Elderton1,09028.4
Labour Kevin Watts80220.9
Liberal Democrats Daniel Jones1834.8
Turnout 384339.28
Finedon
PartyCandidateVotes%
Conservative Peter Bhupendra 997 34.0
Labour James Ashton94432.5
UKIP Gary Evans86829.9
Liberal Democrats John Weaver1043.6
Turnout 290331.88
Irchester
PartyCandidateVotes%
Conservative Sue Homer 1,429 41.3
Labour Tim Maguire1,23935.8
UKIP Tony Giddings79022.8
Turnout 345840.39

Interim By-elections and Defections

Between 2009 and 2013, the only change to council composition were defections from the Conservatives who lost four councillors: one to UKIP, one to the Liberal Democrats and two went independent.

Notes and references

Notes
  1. Accordingly, the Council's expert opinion on the matter of comparison of any electoral division results before and after is expressed as "This makes division-by-division comparisons between the result of this election and the previous election very difficult. For this reason, we will not be presenting the information in terms of which parties have held or gained/lost seats." However a proportionate measure of the results provides the following exact seat distribution, which rounded to one decimal place, is used for the overall measure of parties strengths: Conservatives:43.7 Labour:4.7 Liberal Democrats:7.0 Independent:1.5 UKIP:0
References
  1. "Local Election Summaries 2013". The Elections Centre. Retrieved 24 June 2019.
  2. - Dorset results BBC News. Retrieved 2013-05-13
  3. "The Representation of the People (Form of Canvass) (England and Wales) Regulations 2006, Schedule Part 1". Legislation.gov.uk. 13 October 2011. Retrieved 18 April 2012.
  4. "I have two homes. Can I register at both addresses?". The Electoral Commission. Archived from the original on 31 December 2013. Retrieved 5 January 2011.
  5. 1 2 3 4 5 "Detailed Results for Corby" . Retrieved 4 March 2014.

Related Research Articles

<span class="mw-page-title-main">2009 Cambridgeshire County Council election</span>

An election to Cambridgeshire County Council took place on 4 June 2009 as part of the 2009 United Kingdom local elections. The election was delayed from 7 May to coincide with elections to the European Parliament. 69 councillors were elected from 60 electoral divisions, which returned either one or two county councillors each by first-past-the-post voting. The Conservative Party retained their majority on the council, while the Green Party and UKIP gained their first seats.

<span class="mw-page-title-main">2009 Somerset County Council election</span>

An election to Somerset County Council took place on 4 June 2009 as part of the 2009 United Kingdom local elections, having been delayed from 7 May, to coincide with elections to the European Parliament. The result brought to an end 16 years of Liberal Democrat rule to a Conservative controlled administration. 58 councillors were elected from various electoral divisions, which returned one county councillor each. Members were elected by the first-past-the-post voting system for a four-year term of office. This was the last election before the number of seats was cut to 55 for the 2013 election. With a total of 58 seats being reduced to 55 for the next election.

<span class="mw-page-title-main">2012 City of Lincoln Council election</span> UK municipal election

The 2012 City of Lincoln Council election took place on 3 May 2012 to elect one-third of the members of City of Lincoln Council in Lincolnshire, England, for a 4-year term of office. This was on the same day as other 2012 United Kingdom local elections.

<span class="mw-page-title-main">2013 United Kingdom local elections</span>

The 2013 United Kingdom local elections took place on Thursday 2 May 2013. Elections were held in 35 English councils: all 27 non-metropolitan county councils and eight unitary authorities, and in one Welsh unitary authority. Direct mayoral elections took place in Doncaster and North Tyneside. These elections last took place on the 4 June 2009 at the same time as the 2009 European Parliament Elections, except for County Durham, Northumberland and the Anglesey where elections last took place in 2008.

<span class="mw-page-title-main">2013 Leicestershire County Council election</span>

An election to Leicestershire County Council took place on 2 May 2013 as part of the 2013 United Kingdom local elections. 55 councillors were elected from 52 electoral divisions, which returned either one or two county councillors each by first-past-the-post voting for a four-year term of office. The Conservatives held control of the council with a reduced majority of 5 seats. Despite a strong challenge from UKIP, the party only gained 2 seats whilst the Liberal Democrats lost one seat and Labour recouped some of their 2009 losses, gaining 6 seats.

<span class="mw-page-title-main">2013 West Sussex County Council election</span>

The West Sussex County Council election, 2013 took place on 2 May 2013, as part of the 2013 United Kingdom local elections. All 71 electoral divisions were up for election, which returned one county councillor each by first-past-the-post voting for a four-year term of office. At this election, the Conservative Party was seeking to retain overall control of the council, and the Liberal Democrats to maintain their position as the main opposition party.

<span class="mw-page-title-main">2013 East Sussex County Council election</span>

The East Sussex County Council election, 2013 took place on 2 May 2013 as part of the 2013 United Kingdom local elections. All 49 councillors of East Sussex County Council were elected from 44 electoral divisions, which return either one or two councillors each by first-past-the-post voting for a four-year term of office. The electoral divisions were the same as those used at the previous election in 2009. No elections were held in Brighton and Hove, which is a unitary authority outside the area covered by the County Council.

<span class="mw-page-title-main">2013 Hampshire County Council election</span>

An election to Hampshire County Council took place on 2 May 2013 as part of the 2013 United Kingdom local elections. 78 councillors were elected from 75 electoral divisions, which returned either one or two county councillors each by first-past-the-post voting for a four-year term of office. The electoral divisions were the same as those of the previous election in 2009. No elections were held in Portsmouth and Southampton, which are unitary authorities outside the area covered by the County Council. The election saw the Conservative Party retain overall control of the council, with a reduced majority of five councillors.

<span class="mw-page-title-main">2013 Kent County Council election</span>

The Kent County Council election, 2013 was an election to all 84 seats on Kent County Council held on Thursday 2 May as part of the 2013 United Kingdom local elections. 84 councillors were elected from 72 electoral divisions, which returned either one or two county councillors each by first-past-the-post voting for a four-year term of office. The electoral divisions were the same as those used at the previous election in 2009. No elections were held in Medway, which is a unitary authority outside the area covered by the County Council. The election saw the Conservative Party narrowly retain overall control of the council.

<span class="mw-page-title-main">2013 Cambridgeshire County Council election</span>

An election to Cambridgeshire County Council took place on 2 May 2013 as part of the 2013 United Kingdom local elections. 69 councillors were elected from 60 electoral divisions, which returned either one or two county councillors each by first-past-the-post voting for a four-year term of office. The electoral divisions were the same as those used at the previous election in 2009. No elections were held in Peterborough, which is a unitary authority outside the area covered by the County Council. The election saw the Conservative Party lose overall control of the council.

<span class="mw-page-title-main">2013 Worcestershire County Council election</span>

An election to Worcestershire County Council took place on 2 May 2013 as part of the 2013 United Kingdom local elections. 57 councillors were elected from 53 electoral divisions, which returned either one or two county councillors each by first-past-the-post voting for a four-year term of office. The divisions were the same as those used at the previous election in 2009. The election saw the Conservative Party retain overall control of the council with a significantly reduced majority of just 2 seats.

<span class="mw-page-title-main">2013 Lincolnshire County Council election</span>

An election to Lincolnshire County Council took place on 2 May 2013 as part of the 2013 United Kingdom local elections. 77 electoral divisions returned one county councillor each by first-past-the-post voting for a four-year term of office. The electoral divisions were the same as those used at the previous election in 2009. No elections were held in North Lincolnshire or North East Lincolnshire, which are unitary authorities outside the area covered by the County Council.

<span class="mw-page-title-main">2013 Gloucestershire County Council election</span>

Elections to Gloucestershire County Council took place on 2 May 2013 as part of the 2013 United Kingdom local elections. 53 electoral divisions elected one county councillor each by first-past-the-post voting for a four-year term of office. No elections were held in South Gloucestershire, which is a unitary authority outside the area covered by the County Council.

<span class="mw-page-title-main">2013 Hertfordshire County Council election</span>

An election to Hertfordshire County Council took place on 2 May 2013, as part of the 2013 United Kingdom local elections. 77 electoral divisions elected one county councilor each by first-past-the-post voting for a four-year term of office. The electoral divisions were the same as those used at the previous election in 2009.

<span class="mw-page-title-main">2013 Essex County Council election</span>

An election to Essex County Council took place on 2 May 2013 as part of the 2013 United Kingdom local elections. 75 councillors were elected from 70 electoral divisions, which returned either one or two county councillors each by first-past-the-post voting for a four-year term of office. The electoral divisions were the same as those used at the previous election in 2009. No elections were held in Thurrock or Southend-on-Sea, which are unitary authorities outside the area covered by the County Council.

<span class="mw-page-title-main">2013 Staffordshire County Council election</span> UK local elections

An election to Staffordshire County Council took place on 2 May 2013 as part of the 2013 United Kingdom local elections. 62 electoral divisions returned one county councillor each by first-past-the-post voting for a four-year term of office. Following a boundary review, new electoral division boundaries were established for this election. No elections were held in Stoke-on-Trent, which is a unitary authority outside the area covered by the County Council. The council continues to be administered on the Leader and Cabinet model.

<span class="mw-page-title-main">2013 Buckinghamshire County Council election</span>

An election to Buckinghamshire County Council took place on 2 May 2013 as part of the 2013 United Kingdom local elections. 49 councillors were elected from electoral divisions which returned one county councillor each by first-past-the-post voting for a four-year term of office. Following a boundary review, the size of the council was reduced from 57 to 49 members for this election. No elections were held in Milton Keynes, which is a unitary authority outside the area covered by the County Council. The council continues to be administered on the Leader and Cabinet model. The Conservative Party won a reduced majority on the council.

<span class="mw-page-title-main">2013 Dorset County Council election</span>

An election to Dorset County Council took place on 2 May 2013 as part of the United Kingdom local elections. 45 councillors were elected from 42 electoral divisions, which returned either one or two county councillors each by first-past-the-post voting for a four-year term of office. The electoral divisions were the same as those used at the previous election in 2009. No elections were held in Bournemouth or Poole, which are unitary authorities outside the area covered by the County Council. The election saw the Conservative Party maintain overall control of the council.

<span class="mw-page-title-main">2013 Suffolk County Council election</span>

Elections to Suffolk County Council took place on 2 May 2013 as part of the 2013 United Kingdom local elections. 75 councillors were elected from 63 electoral divisions, which returned either one or two county councillors each by first-past-the-post voting for a four-year term of office. The electoral divisions were the same as those used at the previous election in 2009.

<span class="mw-page-title-main">2017 Gloucestershire County Council election</span>

The 2017 Gloucestershire County Council election took place on 4 May 2017 as part of the 2017 local elections in the United Kingdom. All 53 councillors were elected from electoral divisions which returned one county councillor each by first-past-the-post voting for a four-year term of office. Control of the council went from a Conservative Party minority to a majority administration.