2013 Northumberland County Council election

Last updated

2013 Northumberland County Council election [1]
Flag of Northumberland.svg
  2008 2 May 2013 (2013-05-02) 2017  

All 67 seats
to Northumberland County Council
34 seats needed for a majority
Turnout33.7%
 First partySecond party
 
Party Labour Conservative
Last election1717
Seats won3221
Seat changeIncrease2.svg15Increase2.svg4
Popular vote29,63125,354
Percentage35.8%30.7%

 Third partyFourth party
 
Party Liberal Democrats Independent
Last election267
Seats won113
Seat changeDecrease2.svg15Decrease2.svg4
Popular vote17,0354,881
Percentage20.6%5.9%

Northumberland UK local election 2013 map.svg
Map of the results of the 2013 local election.

Control of Council before election


No overall control

Control of Council after election


No overall control

Elections to Northumberland County Council were held on 2 May 2013. The full council was up for election, with each successful candidate serving a four-year term of office, expiring in 2017.

Contents

The council remained in no overall control with the Labour Party becoming the largest party, holding 32 out of 67 seats on the council. Of the remaining 35 seats on the council, the Conservative Party won the 21 seats, the Liberal Democrats won 11 seats and Independents won 3 seats. [2]

Results

Northumberland County Council election, 2013
PartySeatsGainsLossesNet gain/lossSeats %Votes %Votes+/−
  Labour 3247.7635.0729,793
  Conservative 2131.3430.7426,123
  Liberal Democrats 1116.4221.1517,964
  Independent 34.485.754,881
  UKIP 06.795,764
  Green 00.50424

The overall turnout was 34.03% with a total of 84,949 valid votes cast. A total of 726 ballots were rejected.

Council Composition

Following the election, the composition of the council was:

3221113
LabourConservativeLiberal DemocratIND

IND - Independent

Ward results

.

Alnwick

Alnwick (2 seats)
PartyCandidateVotes%
Conservative Gordon Castle 1,128 20.03
Liberal Democrats Lydia Heather Cairns 1,008 17.90
Liberal Democrats Clare Margaret Mills92916.50
Conservative Bruce Hewison76713.62
UKIP Michael John Weatheritt59410.55
UKIP Margaret Weatheritt4828.56
Labour William Grisdale4618.19
Labour Mary Pidcock2624.65
Majority791.40
Turnout 5,63137.2
Conservative hold
Liberal Democrats hold

Amble

Amble (1 seat)
PartyCandidateVotes%
Labour George Robert Arckless 575 69.87
Conservative Peter Robinson16219.68
Liberal Democrats Roger Cashmore8610.45
Majority41350.19
Turnout 823
Labour hold

Amble West with Warkworth

Amble West with Warkworth (1 seat)
PartyCandidateVotes%
Conservative Amble West with Warkworth 432 27.73
Liberal Democrats Juliet Hedda Pörksen43127.66
UKIP Leslie George Herbert Bilboe26016.69
Independent Dorothy Ann Burke22214.25
Labour Paul Claridge21313.67
Majority10.07
Turnout 1,55845.5
Conservative hold

Ashington Central

Ashington Central (1 seat)
PartyCandidateVotes%
Labour Thomas Sinclair Wilson 795 90.34
Conservative John Ridley Wearmouth859.66
Majority71080.68
Turnout 88023.87
Labour hold

Bamburgh

Bamburgh (1 seat)
PartyCandidateVotes%
Conservative John Crawford Woodman 813 56.85
Liberal Democrats David John Holwell46332.38
Labour Nicola Morrison15410.77
Majority35024.47
Turnout 1,43039.9
Conservative hold

Bedlington Central

Bedlington Central (1 seat)
PartyCandidateVotes%
Labour Alyson Wallace 606 57.55
Liberal Democrats Arthur Holland Pegg23422.22
Conservative Paul Robert Aynsley21320.23
Majority37235.33
Turnout 1,05328.64
Labour hold

Bedlington East

Bedlington East (1 seat)
PartyCandidateVotes%
Labour Valerie Tyler 701 85.28
Conservative Edna Elizabeth Rixon749.00
Liberal Democrats Joan Carol Tebbutt475.72
Majority62776.28
Turnout 82223.84
Labour hold

Bedlington West

Bedlington West (1 seat)
PartyCandidateVotes%
Labour Terence Johnstone 530 46.99
Independent Malcolm Robinson28625.35
Conservative Tracy Aynsley16614.72
Liberal Democrats Anthony Barrett14612.94
Majority24421.64
Turnout 1,12830.43
Labour hold

Bellingham

Bellingham (1 seat)
PartyCandidateVotes%
Conservative John Robert Riddle 867 69.03
Labour Alexandra Norah Richards22818.15
Liberal Democrats Angus David McCraken16112.82
Majority63950.88
Turnout 1,25639.57
Conservative hold

Berwick East

Berwick East (1 seat)
PartyCandidateVotes%
Liberal Democrats James Edward Smith 342 45.18
Conservative Georgina Emma Rowley Hill25333.42
Labour John Paul Hewit16221.40
Majority8911.76
Turnout 75721.80
Liberal Democrats hold

Berwick North

Berwick North (1 seat)
PartyCandidateVotes%
Liberal Democrats Gavin William Jones 456 36.6
Independent Brian Alexander Douglas36529.29
Conservative Thomas Reginald Forrester31825.52
Labour Keith Trobe1078.59
Majority917.31
Turnout 1,24637.8
Liberal Democrats hold

Berwick West with Ord

Berwick West with Ord (1 seat)
PartyCandidateVotes%
Liberal Democrats Elizabeth Isabel Hunter 558 57.76
Conservative John William Stephenson29630.64
Labour Anthony George Reay11211.60
Majority26227.12
Turnout 96631.90
Liberal Democrats hold

Bothal

Bothal (1 seat)
PartyCandidateVotes%
Labour Lynne Grimshaw 666 54.37
Liberal Democrats Simon Luke Reed47939.10
Conservative Jack Alexander Gebhard806.53
Majority18715.27
Turnout 1,22534.33
Labour hold

Bywell

Bywell (1 seat)
PartyCandidateVotes%
Independent Paul Kelly 559 38.66
Conservative Fiona Mary Hunter42329.26
Liberal Democrats Andrew Haddon23216.04
Labour John Robert Temple23216.04
Majority1369.41
Turnout 1,44640.52
Independent hold

Choppington

Choppington (1 seat)
PartyCandidateVotes%
Labour David Ledger 688 81.90
Conservative Rachel Elizabeth Moore15218.10
Majority53663.80
Turnout 84022.86
Labour hold

College

College (1 seat)
PartyCandidateVotes%
Labour James Sawyer 878 90.70
Conservative Charlotte Elizabeth Peacock909.30
Majority78881.40
Turnout 96825.50
Labour hold

Corbridge

Corbridge (1 seat)
PartyCandidateVotes%
Conservative Jean Barbara Fearon 704 61.06
Labour Gillian Richardson28624.80
Liberal Democrats Philip Ronald Latham16314.14
Majority41836.26
Turnout 1,15333.32
Conservative hold

Cowpen

Cowpen (1 seat)
PartyCandidateVotes%
Labour Susan Davey 483 52.16
UKIP Barry William Elliott38041.04
Conservative Connor Graham Rumble323.45
Liberal Democrats Alisdair Lindsey Gibbs-Barton313.35
Majority10311.12
Turnout 92628.20
Labour hold

Cramlington East

Cramlington East (1 seat)
PartyCandidateVotes%
Labour Ian Carr Fry Swithenbank 588 78.19
Conservative Anne Charlotte Waggitt8311.04
Liberal Democrats Brenda Brechany8110.77
Majority50567.15
Turnout 75224.34
Labour hold

Cramlington Eastfield

Cramlington Eastfield (1 seat)
PartyCandidateVotes%
Labour Laura Barbara Pidcock 665 49.04
Liberal Democrats Barrie Crowther42831.56
Conservative Christopher Wallis26319.40
Majority23717.48
Turnout 1,35632.16
Labour hold

Cramlington North

Cramlington North (1 seat)
PartyCandidateVotes%
Conservative Wayne Daley 1,127 78.59
Labour Martin John Wright26718.62
Liberal Democrats Sandra Armstrong402.79
Majority86059.97
Turnout 1,43434.86
Conservative hold

Cramlington South East

Cramlington South East (1 seat)
PartyCandidateVotes%
Labour Allan Hepple 742 47.26
Independent William Bowers30019.11
Liberal Democrats Thomas Brechany28017.83
Conservative Lynn Rixon24815.80
Majority44228.15
Turnout 1,57040.21
Labour hold

Cramlington Village

Cramlington Village (1 seat)
PartyCandidateVotes%
Labour Kathleen Olivia Graham 492 37.13
Liberal Democrats Alan Rockcliffe Armstrong37428.23
Conservative Christopher Patrick Desmond Dorman-O'Gowan31723.92
Independent Susan Mary Bryce Johnston14210.72
Majority1188.90
Turnout 1,32536.65
Labour hold

Cramlington West

Cramlington West (1 seat)
PartyCandidateVotes%
Conservative Barry Malcolm Flux 719 54.89
Labour Ian Ayres53140.53
Liberal Democrats Michael Robert Gerard Emmett604.58
Majority18814.36
Turnout 1,31032.52
Conservative hold

Croft

Croft (1 seat)
PartyCandidateVotes%
Labour Kathleen Nisbet 582 71.24
Independent Vincent Coils11413.95
Conservative Sheila O'Sullivan627.59
Liberal Democrats Sylvia Calvert597.22
Majority46857.29
Turnout 81723.76
Labour hold

Dudridge Bay

Dudridge Bay (1 seat)
PartyCandidateVotes%
Labour Scott James Dickinson 786 63.13
Conservative Daniel John Hedley28723.05
Liberal Democrats Carole Lindsay Arkley17213.82
Majority49940.08
Turnout 1,24529.90
Labour hold

Haltwhistle

Haltwhistle (1 seat)
PartyCandidateVotes%
Conservative James Ian Hutchinson 651 43.03
Labour Eric David Watson55436.61
UKIP Graham Edward Young22815.07
Liberal Democrats Niall Alasdair Munro Deas805.29
Majority976.42
Turnout 1,51342.06
Conservative hold

Hartley

Hartley (1 seat)
PartyCandidateVotes%
Labour Susan Elizabeth Dungworth 947 58.03
Liberal Democrats Anita Cynthia Romer42325.92
Conservative Daniel James Carr26216.05
Majority52432.11
Turnout 1,63241.43
Labour hold

Haydon & Hadrian

Haydon & Hadrian (1 seat)
PartyCandidateVotes%
Liberal Democrats Alan Sharp 696 45.52
Conservative William Joseph Green46430.35
UKIP Melanie Hurst20513.41
Labour Mary Annette McGlade Wright16410.72
Majority23215.17
Turnout 1,52944.40
Liberal Democrats hold

Haydon

Haydon (1 seat)
PartyCandidateVotes%
Labour Brian Gallacher 857 72.69
Liberal Democrats Andrew Rupert McGregor24921.12
Conservative Nicola Ann Bawn736.19
Majority60851.57
Turnout 1,17932.58
Labour hold

Hexham Central with Acomb

Hexham Central with Acomb (1 seat)
PartyCandidateVotes%
Conservative Terence Robson 755 48.46
Labour Jane Caroline Wrigley53734.47
UKIP Jason Osvaldo Fiori17711.36
Liberal Democrats Peter John Arnold895.71
Majority21813.99
Turnout 1,55844.41
Conservative hold

Hexham East

Hexham East (1 seat)
PartyCandidateVotes%
Conservative Catherine Robson Homer 623 46.67
Labour Lorna Jane Boyd30022.47
UKIP Alan Philipson20715.50
Liberal Democrats Judith Elizabeth Lloyd20515.36
Majority32324.20
Turnout 1,33539.17
Conservative hold

Hexham West

Hexham West (1 seat)
PartyCandidateVotes%
Conservative Colin Cessford 848 48.34
Liberal Democrats Derek Kennedy54030.79
Labour David Crockit26114.88
UKIP Zoe Philipson1055.99
Majority30817.55
Turnout 1,75452.49
Conservative hold

Hirst

Hirst (1 seat)
PartyCandidateVotes%
Labour Kenneth Parry 518 60.73
Independent Pauline Thompson30635.87
Conservative Richard Wearmouth293.40
Majority21224.86
Turnout 85322.76
Labour hold

Holywell

Holywell (1 seat)
PartyCandidateVotes%
Labour Bernard Pidcock 733 46.25
Liberal Democrats Robert Marshall Nixon44928.33
Independent Robert Watson28217.79
Conservative Simon Troy Hartland1217.63
Majority28417.92
Turnout 1,58537.26
Labour hold

Humshaugh

Humshaugh (1 seat)
PartyCandidateVotes%
Conservative Rupert McLure Gibson 807 66.80
Labour Milo Jasper Barnett26421.85
Liberal Democrats Paul Steven Harrison13711.34
Majority54344.95
Turnout 1,20835.94
Conservative hold

Isabella

Isabella (1 seat)
PartyCandidateVotes%
Labour Gordon Webb 649 80.42
Liberal Democrats Gordon Calvert8510.53
Conservative Aaron Spence739.05
Majority56469.89
Turnout 80724.19
Labour hold

Kitty Brewster

Kitty Brewster (1 seat)
PartyCandidateVotes%
Labour James Grant Davey 685 73.58
Conservative Katherine McVicar13114.07
Liberal Democrats Walter Rickerby11512.35
Majority55459.51
Turnout 93122.80
Labour hold

Longhorsley

Longhorsley (1 seat)
PartyCandidateVotes%
Labour Hugh Glen Howard Sanderson 994 72.35
UKIP David Malcolm Cox15211.06
Labour Otis Gilbert1279.24
Liberal Democrats Charles Jevon1017.35
Majority84261.29
Turnout 1,37442.7
Labour hold

Longhoughton

Longhoughton (1 seat)
PartyCandidateVotes%
Independent John Anthony Taylor 705 51.01
Conservative David James Campbell Rixon31522.79
Independent Ian James Ramsey Sutherland18413.32
UKIP Geoffrey Watson17812.88
Majority39028.22
Turnout 1,38243.00
Independent hold

Lynemouth

Lynemouth (1 seat)
PartyCandidateVotes%
Labour Milburn Irving Douglas 661 61.60
Liberal Democrats Barry Kent34231.87
Conservative Jeremy Lewis Wilcock706.53
Majority31929.73
Turnout 1,07332.20
Labour hold

Morpeth Kirkhill

Morpeth Kirkhill (1 seat)
PartyCandidateVotes%
Liberal Democrats Andrew Tebbutt 710 45.75
Conservative David Herne46429.90
Labour Adrian Martin James Slassor37824.35
Majority24615.85
Turnout 1,55238.30
Liberal Democrats hold

Morpeth North

Morpeth North (1 seat)
PartyCandidateVotes%
Conservative David Lee Bawn 523 31.79
Green Nicholas Francis Best42425.78
Liberal Democrats Kenneth Brown38523.40
Labour Colin Taylor31319.03
Majority996.01
Turnout 1,64543.80
Conservative hold

Morpeth Stobhill

Morpeth Stobhill (1 seat)
PartyCandidateVotes%
Liberal Democrats Ian Paul Lindley 553 37.57
Conservative John Ace Beynon47232.06
Labour Debra Belinda Davies44730.37
Majority815.51
Turnout 1,47240.20
Liberal Democrats hold

Newbiggin Central & East

Newbiggin Central & East (1 seat)
PartyCandidateVotes%
Labour Elizabeth Mary Simpson 751 67.29
Liberal Democrats James Alan Thompson26523.75
Conservative Dorothy Anne Wonnacott1008.96
Majority48643.54
Turnout 1,11630.18
Labour hold

Newsham

Newsham (1 seat)
PartyCandidateVotes%
Labour Deirdre Campbell 441 45.94
UKIP Richard William Hall35236.67
Liberal Democrats Elizabeth Marina Vuyk11211.66
Conservative Nicola Swinburn555.73
Majority899.27
Turnout 96027.65
Labour hold

Norham & Islandshires

Norham & Islandshires (1 seat)
PartyCandidateVotes%
Liberal Democrats Richard John Douglas Watkin 808 54.85
Conservative Steven John Purvis53336.19
Labour Sandra Dawn Dickinson1328.96
Majority27518.66
Turnout 1,47342.10
Liberal Democrats hold

Pegswood

Pegswood (1 seat)
PartyCandidateVotes%
Labour Alan George Sambrook 510 40.38
Liberal Democrats David George Woodard32325.58
Conservative Sheila Luck22617.89
UKIP Muriel Brown20416.15
Majority18714.80
Turnout 1,26332.10
Labour hold

Plessey

Plessey (1 seat)
PartyCandidateVotes%
Liberal Democrats Jeffrey Stewart Reid 580 42.21
Labour Gordon Thomas Knox50136.46
UKIP Revell Cornell25418.49
Conservative Karl David McLean392.84
Majority795.75
Turnout 1,37439.24
Liberal Democrats hold

Ponteland East & Stannington

Ponteland East & Stannington (1 seat)
PartyCandidateVotes%
Conservative Eileen Armstrong 896 83.19
UKIP John Collin Dickinson18116.81
Majority71566.38
Turnout 1,07733.43
Conservative hold

Ponteland North

Ponteland North (1 seat)
PartyCandidateVotes%
Conservative Richard Dodd Uncontested
Conservative hold

Ponteland South with Heddon

Ponteland South with Heddon (1 seat)
PartyCandidateVotes%
Conservative Peter Alan Jackson83681.40
Liberal Democrats Ian Shepherd Sotheran19118.60
Majority64562.80
Turnout 1,02730.72
Conservative hold

Ponteland West

Ponteland West (1 seat)
PartyCandidateVotes%
Conservative Veronica Jones 907 80.48
UKIP David Nicholson22019.52
Majority68760.96
Turnout 1,12734.51
Conservative hold

Prudhoe North

Prudhoe North (1 seat)
PartyCandidateVotes%
Labour Eileen Burt 587 49.12
UKIP Alan Keith Piper30025.10
Conservative Gerald Bernard Price25721.51
Liberal Democrats John Michael Womersley Williams514.27
Majority28724.02
Turnout 1,19527.54
Labour hold

Prudhoe South

Prudhoe South (1 seat)
PartyCandidateVotes%
Labour Anthony William Reid 549 52.74
UKIP Geraldine Margaret Welton26425.36
Conservative Jade Marie Scott17917.19
Liberal Democrats Darren William Levitt494.71
Majority28527.38
Turnout 1,04126.15
Labour hold

Rothbury

Rothbury (1 seat)
PartyCandidateVotes%
Liberal Democrats Steven Christopher Bridgett 1,544 70.86
Conservative Brian Hesler54024.78
Labour Thelma Morse954.36
Majority1,00446.08
Turnout 2,17954.20
Liberal Democrats hold

Seaton with Newbiggin West

Seaton with Newbiggin West (1 seat)
PartyCandidateVotes%
Labour James Aidan Lang 842 78.33
UKIP Gary James Leighton12011.16
Liberal Democrats Malcolm Peden716.60
Conservative Timothy James Nichol423.91
Majority72267.17
Turnout 1,07529.55
Labour hold

Seghill with Seaton Delaval

Seghill with Seaton Delaval (1 seat)
PartyCandidateVotes%
Labour Margaret Evelyn Richards 840 73.23
Conservative Alastair John Ion18115.78
Liberal Democrats Anna Jane Reid12610.99
Majority65957.45
Turnout 1,14728.20
Labour hold

Shilbottle

Shilbottle (1 seat)
PartyCandidateVotes%
Conservative Trevor Norman Thorne 765 45.40
Labour Brenda Trobe47628.25
UKIP John Anderson Curry34220.30
Liberal Democrats Gregah Alan Roughead1026.05
Majority28917.15
Turnout 1,68541.90
Conservative hold

Sleekburn

Sleekburn (1 seat)
PartyCandidateVotes%
Labour John James Gobin 498 57.31
Liberal Democrats Mark David Owen31035.67
Conservative David Gavin Moffatt617.02
Majority18821.64
Turnout 86916.51
Labour hold

South Blyth

South Blyth (1 seat)
PartyCandidateVotes%
Liberal Democrats Lesley Jennifer Rickerby 551 46.11
UKIP Peter Potts28724.02
Labour Heidrun Hedwig Knox27823.26
Conservative Jamie Wyatt796.61
Majority26422.09
Turnout 1,195
Liberal Democrats hold

South Tynedale

South Tynedale (1 seat)
PartyCandidateVotes%
Conservative Colin William Horncastle 1,069 71.41
Labour Catherine Anne Hedley31020.71
Liberal Democrats Stuart Alan Rowlands1187.88
Majority75950.70
Turnout 1,49738.23
Conservative hold

Stakeford

Stakeford (1 seat)
PartyCandidateVotes%
Labour Julie Denise Foster 878 78.32
Conservative Chris Galley24321.68
Majority63556.64
Turnout 1,12130.01
Labour hold

Stocksfield & Boomhaugh

Stocksfield & Boomhaugh (1 seat)
PartyCandidateVotes%
Independent Patricia Anne Mary Dale 1,416 73.10
Conservative Paul Vickers34417.76
Labour Karen Louise Pollock1779.14
Majority1,07255.34
Turnout 1,93748.62
Independent hold

Wensleydale

Wensleydale (1 seat)
PartyCandidateVotes%
Labour Eileen Cartie 650 69.52
Liberal Democrats Penelope Anne Reid20421.82
Conservative Margaret Mary Ion818.66
Majority44647.70
Turnout 935
Labour hold

Wooler

Wooler (1 seat)
PartyCandidateVotes%
Conservative Anthony Harkness Murray 850 64.25
UKIP Gavin William Thomas Egdell27220.56
Liberal Democrats Rosemary Cott1108.31
Labour David Buchanan Williams916.88
Majority57843.69
Turnout 1,32338.80
Conservative hold

Related Research Articles

<span class="mw-page-title-main">1998 Solihull Metropolitan Borough Council election</span>

The 1998 Solihull Metropolitan Borough Council election took place on 7 May 1998 to elect members of Solihull Metropolitan Borough Council in the West Midlands, England. One third of the council was up for election and the council stayed under no overall control.

<span class="mw-page-title-main">Politics of Cornwall</span> South West England county

Cornwall is administered as a county of South West England whose politics are influenced by a number of issues that make it distinct from the general political scene in the wider United Kingdom, and the political trends of neighbouring counties. Its position on the geographical periphery of the island of Great Britain is also a factor.

<span class="mw-page-title-main">2011 Babergh District Council election</span>

The 2011 Babergh Council election took place on 5 May 2011 to elect members of Babergh District Council in Suffolk, England. The whole council was up for election and the council stayed under no overall control.

<span class="mw-page-title-main">2007 St Albans City and District Council election</span>

The 2007 St Albans City and District Council election took place on 3 May 2007 to elect members of St Albans District Council in Hertfordshire, England. One third of the council was up for election and the Liberal Democrats lost overall control of the council to no overall control.

Thanet District Council elections are held every four years to elect Thanet District Council in Kent, England. Since the last boundary changes in 2003 the council has comprised 56 councillors representing 23 wards.

<span class="mw-page-title-main">2007 Solihull Metropolitan Borough Council election</span>

The 2007 Solihull Metropolitan Borough Council election took place on 4 May 2007 to elect members of Solihull Metropolitan Borough Council in the West Midlands, England. One third of the council was up for election and the Conservative Party lost overall control of the council to no overall control.

<span class="mw-page-title-main">2010 Carlisle City Council election</span>

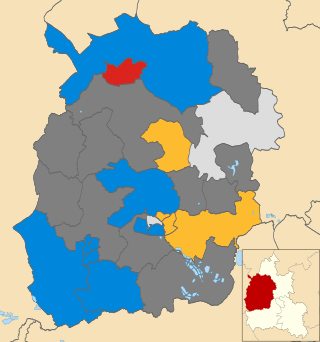
The 2010 Carlisle City Council election took place on 6 May 2010 to elect members of Carlisle District Council in Cumbria, England. One third of the council was up for election and the council stayed under no overall control.

<span class="mw-page-title-main">2013 United Kingdom local elections</span>

The 2013 United Kingdom local elections took place on Thursday 2 May 2013. Elections were held in 35 English councils: all 27 non-metropolitan county councils and eight unitary authorities, and in one Welsh unitary authority. Direct mayoral elections took place in Doncaster and North Tyneside. These elections last took place on the 4 June 2009 at the same time as the 2009 European Parliament Elections, except for County Durham, Northumberland and the Anglesey where elections last took place in 2008.

<span class="mw-page-title-main">2013 Norfolk County Council election</span>

The Norfolk County Council election took place across Norfolk on 2 May 2013, coinciding with local elections for all county councils in England. The results were announced the following day, Friday 3 May 2013. The result brought to an end 12 years of Conservative administration, who finished three seats short of a majority after losing 20 seats, leaving the Council in no overall control (NOC). UKIP and the Labour Party both made gains of 14 and 11 seats respectively. The Liberal Democrats and the Green Party both lost three seats each, whilst an independent won a single seat in North Norfolk.

<span class="mw-page-title-main">2013 West Sussex County Council election</span>

The West Sussex County Council election, 2013 took place on 2 May 2013, as part of the 2013 United Kingdom local elections. All 71 electoral divisions were up for election, which returned one county councillor each by first-past-the-post voting for a four-year term of office. At this election, the Conservative Party was seeking to retain overall control of the council, and the Liberal Democrats to maintain their position as the main opposition party.

<span class="mw-page-title-main">2013 Hampshire County Council election</span>

An election to Hampshire County Council took place on 2 May 2013 as part of the 2013 United Kingdom local elections. 78 councillors were elected from 75 electoral divisions, which returned either one or two county councillors each by first-past-the-post voting for a four-year term of office. The electoral divisions were the same as those of the previous election in 2009. No elections were held in Portsmouth and Southampton, which are unitary authorities outside the area covered by the County Council. The election saw the Conservative Party retain overall control of the council, with a reduced majority of five councillors.

<span class="mw-page-title-main">2013 Gloucestershire County Council election</span>

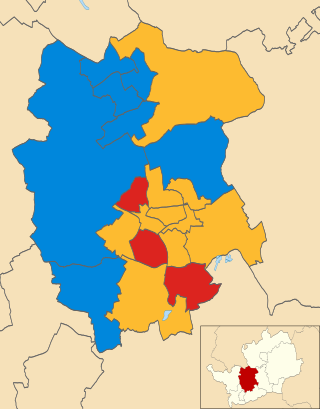
Elections to Gloucestershire County Council took place on 2 May 2013 as part of the 2013 United Kingdom local elections. 53 electoral divisions elected one county councillor each by first-past-the-post voting for a four-year term of office. No elections were held in South Gloucestershire, which is a unitary authority outside the area covered by the County Council.

<span class="mw-page-title-main">2014 South Dublin County Council election</span> Part of the 2014 Irish local elections

An election to South Dublin County Council took place on 23 May 2014 as part of that year's Irish local elections. Forty councillors were elected for a five-year term of office from six local electoral areas (LEAs) on the electoral system of proportional representation by means of the single transferable vote (PR-STV).

<span class="mw-page-title-main">2012 Tandridge District Council election</span>

The 2012 Tandridge District Council election took place on 3 May 2012 to elect members of Tandridge District Council in Surrey, England. One third of the council was up for election and the Conservative Party stayed in overall control of the council.

<span class="mw-page-title-main">2011 Taunton Deane Borough Council election</span>

The 2011 Taunton Deane Borough Council election took place on 5 May 2011 to elect members of Taunton Deane Borough Council in Somerset, England. The whole council was up for election and the council stayed under no overall control. The Conservatives won 28 seats, exactly half, while the Liberal Democrats took 23. Labour only won three seats, with the two remaining held by independent candidates. Falling only one seat short of an overall majority, the Conservatives took on the leadership of the council as a minority administration, under Councillor John Williams.

<span class="mw-page-title-main">2015 East Dorset District Council election</span>

The 2015 East Dorset District Council election took place on 7 May 2015 in order to elect members of the East Dorset District Council in Dorset, England. The whole council was up for election after boundary changes reduced the number of seats by seven. The Conservative Party stayed in overall control of the council.

<span class="mw-page-title-main">2003 West Oxfordshire District Council election</span>

The 2003 West Oxfordshire District Council election took place on 1 May 2003 to elect members of West Oxfordshire District Council in Oxfordshire, England. One third of the council was up for election and the Conservative Party stayed in overall control of the council.

<span class="mw-page-title-main">2014 West Oxfordshire District Council election</span>

The 2014 West Oxfordshire District Council election took place on 22 May 2014 to elect members of West Oxfordshire District Council in Oxfordshire, England. One third of the council was up for election and the Conservative Party stayed in overall control of the council.

<span class="mw-page-title-main">2017 Northumberland County Council election</span>

An election for the Northumberland County Council took place on 4 May 2017 as part of the 2017 local elections in the United Kingdom. All 67 councillors were elected from 66 electoral divisions which returned either one or two county councillors each by first-past-the-post voting for a four-year term of office.

<span class="mw-page-title-main">2022 City of Bradford Metropolitan District Council election</span> 2022 local election in Bradford

The 2022 City of Bradford Metropolitan District Council election took place on 5 May 2022 to elect one third of councillors to the City of Bradford Metropolitan District Council. The election took place at the same time as other local elections across the United Kingdom.

References

  1. "Local Election Summaries 2013". The Elections Centre. Retrieved 21 June 2019.
  2. "Councillors". Northumberland County Council. Archived from the original on 27 July 2013. Retrieved 30 January 2012.