| |||||||||||||||||||||||||
All 67 seats to Nottinghamshire County Council 34 seats needed for a majority | |||||||||||||||||||||||||
---|---|---|---|---|---|---|---|---|---|---|---|---|---|---|---|---|---|---|---|---|---|---|---|---|---|
| |||||||||||||||||||||||||
Map showing the results of the 2013 Nottinghamshire County Council election. | |||||||||||||||||||||||||
|
The Nottinghamshire County Council Election took place on 2 May 2013 as part of the 2013 United Kingdom local elections. 67 councillors were elected from 54 electoral divisions, which returned either one or two county councillors each by first-past-the-post voting for a four-year term of office. The electoral divisions were the same as those used at the previous election in 2009. No elections were held in the City of Nottingham, which is a unitary authority outside the area covered by the County Council. The Labour Party won a narrow majority of one seat, gaining overall control from the Conservative Party who had controlled the council since the 2009 election.
Party | Seats | Gains | Losses | Net gain/loss | Seats % | Votes % | Votes | +/− | |
---|---|---|---|---|---|---|---|---|---|
Labour | 34 | 50.75 | 36.47 | 100,307 | |||||
Conservative | 21 | 31.34 | 25.76 | 70,863 | |||||
Liberal Democrats | 8 | 11.90 | 9.40 | 25,851 | |||||
Independent/Other | 4 | 5.97 | 7.45 | 20,478 | |||||
UKIP | 0 | 0 | 18.96 | 52,146 | |||||
Green | 0 | 0 | 1.97 | 5,402 | |||||
(10 seats, 8 electoral divisions) [1]
Party | Seats | Gains | Losses | Net gain/loss | Seats % | Votes % | Votes | +/− | |
---|---|---|---|---|---|---|---|---|---|
Labour | 6 | 60 | 38.96 | 17,061 | |||||
Liberal Democrats | 3 | 30 | 14.47 | 6,335 | |||||
Selston Area Independents | 1 | 10 | 8.31 | 3,641 | |||||
UKIP | 0 | 0 | 20.46 | 8,962 | |||||
Conservative | 0 | 0 | 17.57 | 7,698 | |||||
Green | 0 | 0 | 0.22 | 98 | |||||
Party | Candidate | Votes | % | ±% | |
---|---|---|---|---|---|
Labour | John Wilmott | 3,173 | 13.6 | +3.8 | |
Labour | Alice Grice | 2,990 | 12.8 | +3.5 | |
Labour | John Wilkinson | 2,918 | 12.5 | +3.4 | |
UKIP | Tom Irvine | 2,739 | 11.7 | +1.2 | |
UKIP | Alison Irvine | 2,373 | 10.2 | +5.2 | |
Conservative | Mick Murphy | 2,235 | 9.6 | -1.4 | |
UKIP | Carole Terzza | 2,131 | 9.1 | +4.2 | |
Conservative | Trevor Peat | 2,127 | 9.1 | -1.3 | |
Conservative | Kevin Rostance | 1,797 | 7.4 | -6.9 | |
Liberal Democrats | Harry Toseland | 260 | 1.1 | -3.5 | |
Liberal Democrats | Ken Cotham | 250 | 1.1 | -3.3 | |
Liberal Democrats | Jan Smith | 182 | 0.8 | -2.8 | |
TUSC | Cliff Smith | 158 | 0.7 | N/A | |
Turnout |
Party | Candidate | Votes | % | ±% | |
---|---|---|---|---|---|
Labour | John Knight | 1,456 | 63.4 | +37.0 | |
Independent | Madeliene Gibson | 417 | 18.2 | N/A | |
Liberal Democrats | Rebecca Mullaney | 225 | 9.8 | -3.1 | |
Independent | Russell Wykes | 199 | 8.7 | N/A | |
Turnout |
Party | Candidate | Votes | % | ±% | |
---|---|---|---|---|---|
Liberal Democrats | Rachel Madden | 1,798 | 42.8 | +3.5 | |
Labour | Linda Ward | 1,326 | 31.5 | +22.0 | |
UKIP | Simon Ashcroft | 731 | 17.4 | N/A | |
Conservative | Deborah Mason | 252 | 6.0 | -7.7 | |
Green | Mark Harrison | 98 | 2.3 | -3.5 | |
Turnout |
Party | Candidate | Votes | % | ±% | |
---|---|---|---|---|---|
Selston Area Independents | Gail Turner | 2,427 | 71.8 | +31.5 | |
Labour | Stephen Mays | 794 | 23.5 | +4.0 | |
Independent | John Turner | 161 | 4.8 | N/A | |
Turnout |
Party | Candidate | Votes | % | ±% | |
---|---|---|---|---|---|
Labour | David Kirkham | 1,182 | 53.1 | +27.3 | |
UKIP | Ian Stokes | 608 | 27.3 | N/A | |
Conservative | Shaun Hartley | 252 | 11.3 | -2.9 | |
Liberal Democrats | Michelle Gent | 185 | 8.3 | -21.3 | |
Turnout |
Party | Candidate | Votes | % | ±% | |
---|---|---|---|---|---|
Labour | Steven Carroll | 1,441 | 69.0 | +41.7 | |
Conservative | Francis Purdue-Horan | 363 | 17.4 | +2.3 | |
Liberal Democrats | Tom Harpham | 285 | 13.6 | -8.7 | |
Turnout |
Party | Candidate | Votes | % | ±% | |
---|---|---|---|---|---|
Liberal Democrats | Jason Zadrozny | 1,626 | 53.4 | +26.1 | |
Labour | Paul Roberts | 881 | 28.9 | +3.7 | |
UKIP | Neil Stokes | 380 | 12.5 | N/A | |
Conservative | Brian Jarvis | 160 | 5.3 | -13.9 | |
Turnout |
Party | Candidate | Votes | % | ±% | |
---|---|---|---|---|---|
Liberal Democrats | Tom Hollis | 1,524 | 49.8 | +13.3 | |
Labour | Natalie Fleet | 900 | 29.4 | +3.5 | |
Conservative | Paul Saxelby | 412 | 13.5 | -4.4 | |
Independent | Anna-Marie Wilson | 225 | 7.4 | N/A | |
Turnout |
9 seats, 9 electoral divisions [1]
Party | Seats | Gains | Losses | Net gain/loss | Seats % | Votes % | Votes | +/− | |
---|---|---|---|---|---|---|---|---|---|
Labour | 7 | 77.8 | 50.5 | 12,952 | |||||
Conservative | 2 | 22.2 | 27.8 | 7,130 | |||||
UKIP | 0 | 0 | 18.3 | 4,705 | |||||
Liberal Democrats | 0 | 0 | 2.4 | 614 | |||||
Independent | 0 | 0 | 1.0 | 266 | |||||
Party | Candidate | Votes | % | ±% | |
---|---|---|---|---|---|
Labour | Sheila Place | 1,667 | 65.1 | +12.4 | |
UKIP | Roger Vernon | 447 | 17.4 | N/A | |
Conservative | Annette Simpson | 363 | 14.2 | -35.1 | |
Liberal Democrats | Peter Thompson | 85 | 3.3 | N/A | |
Turnout |
Party | Candidate | Votes | % | ±% | |
---|---|---|---|---|---|
Conservative | Liz Yates | 1,633 | 50.5 | -26.0 | |
Labour | David Challinor | 827 | 25.6 | +2.0 | |
UKIP | Deidre Vernon | 670 | 20.7 | N/A | |
Liberal Democrats | Ilana Duveen | 103 | 3.2 | N/A | |
Turnout |
Party | Candidate | Votes | % | ±% | |
---|---|---|---|---|---|
Labour | Pamela Skelding | 1,360 | 46.8 | +8.8 | |
Conservative | Wendy Quigley | 974 | 33.5 | -43.0 | |
UKIP | Philip Hallam | 481 | 16.6 | N/A | |
Liberal Democrats | Mark Hunter | 91 | 3.1 | N/A | |
Turnout |
Party | Candidate | Votes | % | ±% | |
---|---|---|---|---|---|
Labour | Ian Campbell | 1,311 | 45.9 | +12.5 | |
Conservative | Mike Quigley | 610 | 21.3 | -25.0 | |
UKIP | Jon Wade | 599 | 21.0 | N/A | |
Independent | Jim Napier | 266 | 9.3 | N/A | |
Liberal Democrats | Jennifer Coggles | 72 | 2.5 | -17.9 | |
Turnout |
Party | Candidate | Votes | % | ±% | |
---|---|---|---|---|---|
Conservative | John Ogle | 1,851 | 60.0 | -1.0 | |
Labour | John Douglas | 1,236 | 40.0 | +23.1 | |
Turnout |
Party | Candidate | Votes | % | ±% | |
---|---|---|---|---|---|
Labour | Glynn Gilfoyle | 1,815 | 68.8 | +12.6 | |
UKIP | Dave Scott | 606 | 23.0 | N/A | |
Conservative | Wayne Clarke | 154 | 5.8 | -12.9 | |
Liberal Democrats | Carole Thompson | 63 | 2.4 | N/A | |
Turnout |
Party | Candidate | Votes | % | ±% | |
---|---|---|---|---|---|
Labour | Sybil Fielding | 1,650 | 58.4 | +3.9 | |
UKIP | Ivor Jones | 731 | 25.9 | N/A | |
Conservative | Michael Gray | 364 | 12.9 | -32.6 | |
Liberal Democrats | Helen Cooper | 79 | 2.8 | N/A | |
Turnout |
Party | Candidate | Votes | % | ±% | |
---|---|---|---|---|---|
Labour | Alan Rhodes | 1,747 | 57.8 | +7.6 | |
UKIP | Tony Clayton | 665 | 22.0 | N/A | |
Conservative | Barry Bowles | 610 | 20.2 | -28.7 | |
Turnout |
Party | Candidate | Votes | % | ±% | |
---|---|---|---|---|---|
Labour | Kevin Maurizio Greaves | 1,339 | 52.8 | +29.9 | |
Conservative | Alec Thorpe | 571 | 22.5 | -28.3 | |
UKIP | Mick Lowe | 506 | 19.9 | N/A | |
Liberal Democrats | Leon Duveen | 121 | 4.8 | N/A | |
Turnout |
10 seats, 8 electoral divisions
Party | Seats | Gains | Losses | Net gain/loss | Seats % | Votes % | Votes | +/− | |
---|---|---|---|---|---|---|---|---|---|
Liberal Democrats | 5 | 50 | 21.79 | 8,968 | |||||
Conservative | 4 | 40 | 26.56 | 10,932 | |||||
Labour | 1 | 10 | 28.91 | 11,901 | |||||
UKIP | 0 | 0 | 19.03 | 7,836 | |||||
Green | 0 | 0 | 3.71 | 1,529 | |||||
Other parties | 0 | 0 | 2.65 | 1,090 | |||||
Party | Candidate | Votes | % | ±% | |
---|---|---|---|---|---|
Conservative | John Handley | 1,050 | 34.8 | ||
Labour | Edward Llewellyn-Jones | 902 | 29.9 | ||
UKIP | Vincent Gilbert | 719 | 23.9 | ||
Liberal Democrats | Josie Forrest | 163 | 5.4 | ||
Green | Beth Hewis | 101 | 3.4 | ||
BNP | David Wright | 78 | 2.4 | ||
Turnout |
Party | Candidate | Votes | % | ±% | |
---|---|---|---|---|---|
Liberal Democrats | Steve Carr | 1,606 | 46.9 | ||
Labour | Mick Warner | 1,053 | 30.8 | ||
Conservative | Stephanie Kerry | 313 | 9.1 | ||
UKIP | Sarah Hillier | 277 | 8.1 | ||
Green | Paul Anderson | 172 | 5.0 | ||
Turnout |
Party | Candidate | Votes | % | ±% | |
---|---|---|---|---|---|
Labour | Kate Foale | 1,394 | 39.0 | ||
Conservative | Eric Kerry | 1,265 | 35.4 | ||
UKIP | Vid Auty | 524 | 14.7 | ||
Green | Sylvia Rule | 235 | 6.6 | ||
Liberal Democrats | Brian Taylor | 154 | 4.3 | ||
Turnout |
Party | Candidate | Votes | % | ±% | |
---|---|---|---|---|---|
Liberal Democrats | Stan Heptinsall | 1,857 | 15.1 | ||
Liberal Democrats | Jacky Williams | 1,489 | 12.1 | ||
Labour | Gillian Yamin | 1,407 | 11.5 | ||
Conservative | Christopher Doddy | 1,368 | 11.2 | ||
Labour | Andrew Clayworth | 1,344 | 11.0 | ||
Conservative | David Park | 1,197 | 9.8 | ||
UKIP | Matthew Doar | 1,156 | 9.4 | ||
UKIP | Chris Cobb | 1,145 | 9.3 | ||
Independent | Richard MacRae | 955 | 7.8 | ||
Green | Gordon Stoner | 243 | 2.0 | ||
Green | Stuart Neyton | 106 | 0.9 | ||
Turnout |
Party | Candidate | Votes | % | ±% | |
---|---|---|---|---|---|
Conservative | Richard Jackson | 2,122 | 18.4 | ||
Conservative | John Doddy | 2,116 | 18.3 | ||
Labour | David Patrick | 1,803 | 15.6 | ||
Labour | Janet Elizabeth Pearse | 1,578 | 13.7 | ||
UKIP | Bob Heeley | 1,205 | 10.4 | ||
UKIP | Keith Marriott | 1,153 | 10.0 | ||
Liberal Democrats | Barbara Carr | 500 | 4.3 | ||
Liberal Democrats | David Watts | 473 | 4.1 | ||
Green | Richard Eddleston | 329 | 2.9 | ||
Green | Mary Venning | 255 | 2.2 | ||
Turnout |
Party | Candidate | Votes | % | ±% | |
---|---|---|---|---|---|
Liberal Democrats | Keith Longdon | 1,234 | 45.7 | ||
Labour | Susan Bagshaw | 834 | 30.9 | ||
UKIP | Laurence Herniman | 360 | 13.3 | ||
Conservative | Adrian Limb | 214 | 7.9 | ||
BNP | Alex McConnell | 57 | 2.1 | ||
Turnout |
Party | Candidate | Votes | % | ±% | |
---|---|---|---|---|---|
Liberal Democrats | Ken Rigby | 1,492 | 41.7 | ||
Labour | Helena Lings | 787 | 22.0 | ||
UKIP | Robert Davidson | 736 | 20.6 | ||
Conservative | John Longdon | 478 | 13.3 | ||
Green | David Kirwan | 88 | 2.5 | ||
Turnout |
Party | Candidate | Votes | % | ±% | |
---|---|---|---|---|---|
Conservative | Philip Owen | 1,501 | 52.3 | ||
Labour | Dawn Elliott | 809 | 28.2 | ||
UKIP | Simon Rood | 561 | 19.5 | ||
Turnout |
10 seats, 6 electoral divisions
Party | Seats | Gains | Losses | Net gain/loss | Seats % | Votes % | Votes | +/− | |
---|---|---|---|---|---|---|---|---|---|
Labour | 8 | 80 | 41.2 | 22,116 | |||||
Conservative | 2 | 20 | 28.6 | 15,379 | |||||
UKIP | 0 | 0 | 22.3 | 11,960 | |||||
Liberal Democrats | 0 | 0 | 5.9 | 3,172 | |||||
Green | 0 | 0 | 1.4 | 754 | |||||
Other parties | 0 | 0.5 | 284 | ||||||
Party | Candidate | Votes | % | ±% | |
---|---|---|---|---|---|
Labour | Pauline Allan | 2,702 | 22.4 | ||
Labour | Michael Payne | 2,569 | 21.3 | ||
Conservative | Carol Pepper | 1,773 | 14.7 | ||
Conservative | Julie Catkin | 1,671 | 13.9 | ||
UKIP | Colin Hart | 1,411 | 11.7 | ||
UKIP | Christina Stala | 1,187 | 9.8 | ||
Green | Jim Norris | 218 | 1.8 | ||
Green | Margret Vince | 210 | 1.7 | ||
Liberal Democrats | Martin Smalley | 178 | 1.5 | ||
Liberal Democrats | Margaret Swift | 144 | 1.2 | ||
Turnout |
Party | Candidate | Votes | % | ±% | |
---|---|---|---|---|---|
Labour | Roy Allan | 2,941 | 21.3 | ||
Labour | Muriel Weisz | 2,840 | 20.6 | ||
Conservative | Michael Adams | 2,189 | 15.9 | ||
Conservative | Suzanne Prew-Smith | 2,012 | 14.6 | ||
UKIP | Jane Marshall | 1,681 | 12.2 | ||
UKIP | Lee Waters | 1,533 | 11.1 | ||
Liberal Democrats | Roger Patterson | 307 | 2.2 | ||
Liberal Democrats | Andrew Swift | 293 | 2.1 | ||
Turnout |
Party | Candidate | Votes | % | ±% | |
---|---|---|---|---|---|
Conservative | Boyd Elliott | 1,144 | 39.5 | ||
Labour | Mike Hope | 804 | 27.8 | ||
UKIP | Wes Stala | 666 | 23.0 | ||
Independent | John Wood | 217 | 7.5 | ||
Liberal Democrats | John Flynn | 63 | 2.2 | ||
Turnout | {{{change}}} |
Party | Candidate | Votes | % | ±% | |
---|---|---|---|---|---|
Labour | John Clarke | 2,225 | 20.0 | ||
Labour | Nicki Brooks | 2,093 | 18.8 | ||
Conservative | Allen Clarke | 1,494 | 13.4 | ||
Conservative | Cheryl Clarke | 1,343 | 12.1 | ||
UKIP | Colin Blandamer | 1,186 | 10.7 | ||
UKIP | Pat Blandamer | 1,097 | 9.9 | ||
Liberal Democrats | Anne Wright | 658 | 5.9 | ||
Liberal Democrats | Andrew Ellwood | 644 | 5.8 | ||
Green | Nick Martin | 170 | 1.5 | ||
Green | Jean Katimertzis | 156 | 1.4 | ||
TUSC | Bill Buchanan | 67 | 0.6 | ||
Turnout |
Party | Candidate | Votes | % | ±% | |
---|---|---|---|---|---|
Labour | Jim Creamer | 2,704 | 25.1 | ||
Labour | Darrell Pulk | 2,588 | 24.0 | ||
UKIP | Edmund Silverman | 1,229 | 11.4 | ||
UKIP | Nina Peterson-Tait | 1,228 | 11.4 | ||
Conservative | Robert Dawson | 1,201 | 11.1 | ||
Conservative | Tim White | 1,030 | 9.6 | ||
Liberal Democrats | Paul Hughes | 449 | 4.2 | ||
Liberal Democrats | Jason Stansfield | 344 | 3.2 | ||
Turnout |
Party | Candidate | Votes | % | ±% | |
---|---|---|---|---|---|
Conservative | Chris Barnfather | 1,522 | 50.6 | ||
UKIP | Mark Brinsley-Day | 742 | 24.7 | ||
Labour | Linford Gibbons | 650 | 21.6 | ||
Liberal Democrats | Paul Buxton | 92 | 3.1 | ||
Turnout |
9 seats, 5 electoral divisions [1]
Party | Seats | Gains | Losses | Net gain/loss | Seats % | Votes % | Votes | +/− | |
---|---|---|---|---|---|---|---|---|---|
Labour | 7 | 77.78 | 41.85 | 16,876 | |||||
Other parties | 2 | 22.22 | 31.49 | 12,698 | |||||
UKIP | 0 | 0 | 18.96 | 7,645 | |||||
Conservative | 0 | 0 | 6.12 | 2,469 | |||||
Liberal Democrats | 0 | 0 | 1.07 | 431 | |||||
Green | 0 | 0 | 0.50 | 203 | |||||
Party | Candidate | Votes | % | ±% | |
---|---|---|---|---|---|
Labour | Alan Bell | 1,801 | 18.8 | ||
Labour | Colleen Harwood | 1,631 | 17.0 | ||
Mansfield Independent Forum | Martin Wright | 1,499 | 15.7 | ||
Mansfield Independent Forum | Bill Drewett | 1,369 | 14.3 | ||
UKIP | Andrea Hamilton | 1,168 | 12.2 | ||
UKIP | Jason Pawlik | 1,022 | 10.7 | ||
Conservative | Brian Marshall | 507 | 5.3 | ||
Conservative | Muriel Ragis | 371 | 3.9 | ||
Green | Mary Button | 203 | 2.1 | ||
Turnout |
Party | Candidate | Votes | % | ±% | |
---|---|---|---|---|---|
Labour | Joyce Bosnjak | 2,443 | 27.9 | ||
Labour | Parry Tsimbiridis | 2,008 | 22.9 | ||
UKIP | David Hamilton | 1,584 | 18.1 | ||
Mansfield Independent Forum | Diane Etches | 777 | 8.9 | ||
Conservative | Stephanie Stewardson | 586 | 6.7 | ||
Conservative | Sasha Chmielewska | 494 | 5.6 | ||
Independent | Craig Eyre | 290 | 3.3 | ||
Liberal Democrats | Anne Ellis | 264 | 3.0 | ||
Liberal Democrats | Nick Spencer | 167 | 1.9 | ||
TUSC | Karen Seymour | 145 | 1.7 | ||
Turnout |
Party | Candidate | Votes | % | ±% | |
---|---|---|---|---|---|
Mansfield Independent Forum | Steve Garner | 2,940 | 27.0 | ||
Mansfield Independent Forum | Andy Sissons | 2,543 | 23.4 | ||
Labour | John Coxhead | 1,851 | 17.0 | ||
Labour | Chris Winterton | 1,764 | 16.2 | ||
UKIP | Philip Moss | 952 | 8.8 | ||
UKIP | John Pawlik | 823 | 7.6 | ||
Turnout |
Party | Candidate | Votes | % | ±% | |
---|---|---|---|---|---|
Labour | Darren Langton | 1,974 | 22.5 | ||
Labour | Diana Meale | 1,901 | 21.7 | ||
Nottinghamshire Independents | June Stendall | 1,567 | 17.9 | ||
Nottinghamshire Independents | Barry Answer | 1,262 | 14.4 | ||
UKIP | Graham Roebuck | 902 | 10.3 | ||
UKIP | Claude-Francois Loi | 804 | 9.2 | ||
Conservative | Vic Bobo | 346 | 4.0 | ||
Turnout |
Party | Candidate | Votes | % | ±% | |
---|---|---|---|---|---|
Labour | John Allin | 1,503 | 63.6 | ||
UKIP | Peter Zinn | 390 | 16.5 | ||
Mansfield Independent Forum | Jeremy Regan | 306 | 12.9 | ||
Conservative | Michael Cameron Garner | 165 | 7.0 | ||
Turnout |
10 seats, 10 electoral divisions [1]
Party | Seats | Gains | Losses | Net gain/loss | Seats % | Votes % | Votes | +/− | |
---|---|---|---|---|---|---|---|---|---|
Conservative | 6 | 60 | 36.04 | 10,711 | |||||
Labour | 3 | 30 | 29.71 | 8,829 | |||||
Other parties | 1 | 10 | 8.41 | 2,499 | |||||
UKIP | 0 | 0 | 17.13 | 5,091 | |||||
Liberal Democrats | 0 | 0 | 8.72 | 2,591 | |||||
Party | Candidate | Votes | % | ±% | |
---|---|---|---|---|---|
Conservative | Keith Walker | 884 | 42.1 | ||
Labour | Andy Jee | 537 | 25.6 | ||
UKIP | Ken Browne | 465 | 22.1 | ||
Liberal Democrats | Neil Allen | 214 | 10.2 | ||
Turnout |
Party | Candidate | Votes | % | ±% | |
---|---|---|---|---|---|
Labour | Yvonne Woodhead | 1,360 | 54.5 | ||
Independent | Geoff Merry | 653 | 26.2 | ||
UKIP | Geoff Thorpe | 481 | 19.3 | ||
Turnout |
Party | Candidate | Votes | % | ±% | |
---|---|---|---|---|---|
Independent | Maureen Dobson | 1,237 | 36.8 | ||
Conservative | David Payne | 936 | 27.9 | ||
UKIP | Peter Weston-Davies | 588 | 17.5 | ||
Labour | Daniel Hibberd | 484 | 14.4 | ||
Liberal Democrats | Marylyn Rayner | 115 | 3.4 | ||
Turnout |
Party | Candidate | Votes | % | ±% | |
---|---|---|---|---|---|
Conservative | Sue Saddington | 1,519 | 54.9 | ||
UKIP | Susan Wilkinson | 645 | 23.3 | ||
Labour | Hugh Watt | 408 | 14.7 | ||
Liberal Democrats | Jim Gould | 196 | 7.1 | ||
Turnout |
Party | Candidate | Votes | % | ±% | |
---|---|---|---|---|---|
Conservative | Roger Jackson | 1,892 | 54.6 | ||
Labour | Linda Tift | 679 | 19.6 | ||
UKIP | Steve Cook | 605 | 17.5 | ||
Liberal Democrats | William Davison | 288 | 8.3 | ||
Turnout |
Party | Candidate | Votes | % | ±% | |
---|---|---|---|---|---|
Conservative | Stuart Wallace | 979 | 45.4 | ||
Labour | Dennis Jones | 651 | 30.2 | ||
UKIP | Ian Robinson | 396 | 18.4 | ||
Liberal Democrats | Ed Lowe | 131 | 6.1 | ||
Turnout |
Party | Candidate | Votes | % | ±% | |
---|---|---|---|---|---|
Conservative | Tony Roberts | 694 | 29.0 | ||
Labour | Trish Gurney | 666 | 27.9 | ||
Independent | Paul Baggaley | 609 | 25.5 | ||
UKIP | Dieter Schanzer | 354 | 14.8 | ||
Liberal Democrats | Chris Adams | 68 | 2.8 | ||
Turnout |
Party | Candidate | Votes | % | ±% | |
---|---|---|---|---|---|
Labour | Stella Smedley | 1,603 | 58.4 | ||
Conservative | Matthew Riley | 594 | 21.6 | ||
UKIP | Margaret Hart | 549 | 20.0 | ||
Turnout |
Party | Candidate | Votes | % | ±% | |
---|---|---|---|---|---|
Labour | John Peck | 2,008 | 58.2 | ||
Conservative | Keith Benison | 848 | 24.6 | ||
UKIP | Rhea Charles | 592 | 17.2 | ||
Turnout |
Party | Candidate | Votes | % | ±% | |
---|---|---|---|---|---|
Conservative | Bruce Laughton | 2,365 | 49.3 | ||
Liberal Democrats | Peter Harris | 1,579 | 32.9 | ||
Labour | Dave Clark | 433 | 9.0 | ||
UKIP | Alison Schanzer | 416 | 8.7 | ||
Turnout |
9 seats, 8 electoral divisions
Party | Seats | Gains | Losses | Net gain/loss | Seats % | Votes % | Votes | +/− | |
---|---|---|---|---|---|---|---|---|---|
Conservative | 7 | 77.78 | 41.76 | 16,544 | |||||
Labour | 2 | 22.22 | 26.68 | 10,572 | |||||
UKIP | 0 | 0 | 15.01 | 5,947 | |||||
Liberal Democrats | 0 | 0 | 9.44 | 3,740 | |||||
Green | 0 | 0 | 7.11 | 2,818 | |||||
Party | Candidate | Votes | % | ±% | |
---|---|---|---|---|---|
Conservative | Martin Suthers | 1,522 | 41.8 | ||
Labour | Dave Holmes | 738 | 20.3 | ||
Liberal Democrats | George Davidson | 725 | 19.9 | ||
UKIP | Daniel Stowell | 656 | 18.0 | ||
Turnout |
Party | Candidate | Votes | % | ±% | |
---|---|---|---|---|---|
Conservative | Richard Butler | 1,330 | 46.2 | ||
Labour | Craig Chewings | 818 | 28.4 | ||
UKIP | Rachel Wolfe | 484 | 16.8 | ||
Green | Helena Brumpton-Surgey | 150 | 5.2 | ||
Liberal Democrats | Sue Hull | 95 | 3.3 | ||
Turnout |
Party | Candidate | Votes | % | ±% | |
---|---|---|---|---|---|
Conservative | John Cottee | 1,931 | 50.9 | ||
Labour | Chris Kemp | 584 | 15.4 | ||
Liberal Democrats | Debbie Boote | 565 | 14.9 | ||
UKIP | Dave King | 535 | 14.1 | ||
Green | Tony Latham | 179 | 4.7 | ||
Turnout |
Party | Candidate | Votes | % | ±% | |
---|---|---|---|---|---|
Conservative | Kay Cutts | 2,073 | 53.2 | ||
Labour | James Gibson | 849 | 21.8 | ||
UKIP | Scott Carlton | 712 | 18.3 | ||
Liberal Democrats | Barbara Venes | 259 | 6.7 | ||
Turnout |
Party | Candidate | Votes | % | ±% | |
---|---|---|---|---|---|
Conservative | Reg Adair | 1,529 | 45.2 | ||
Labour | Robert Crosby | 716 | 21.2 | ||
UKIP | Peter Wolfe | 651 | 19.2 | ||
Liberal Democrats | Peter McGowan | 486 | 14.4 | ||
Turnout |
Party | Candidate | Votes | % | ±% | |
---|---|---|---|---|---|
Conservative | Andrew Brown | 1,698 | 50.1 | ||
UKIP | David Lee | 711 | 21.0 | ||
Labour | Steve Collins | 700 | 20.7 | ||
Liberal Democrats | Linda Abbey | 278 | 8.2 | ||
Turnout |
Party | Candidate | Votes | % | ±% | |
---|---|---|---|---|---|
Labour | Steve Calvert | 2,679 | 18.1 | ||
Labour | Liz Plant | 2,583 | 17.5 | ||
Conservative | Barrie Cooper | 2,574 | 17.4 | ||
Conservative | Gordon Moore | 2,231 | 15.1 | ||
Green | Sue Mallender | 1,156 | 7.8 | ||
Green | Richard Mallender | 1,054 | 7.1 | ||
UKIP | John Foden | 928 | 6.3 | ||
UKIP | Pat Wolfe | 772 | 5.2 | ||
Liberal Democrats | Keith Jamieson | 408 | 2.8 | ||
Liberal Democrats | Juliette Khan | 390 | 2.6 | ||
Turnout |
Party | Candidate | Votes | % | ±% | |
---|---|---|---|---|---|
Conservative | Gordon Wheeler | 1,656 | 42.8 | ||
Labour | Laurence Turner | 905 | 23.4 | ||
Liberal Democrats | Rod Jones | 534 | 13.8 | ||
UKIP | Matthew Faithfull | 498 | 12.9 | ||
Green | Jerome Baddley | 279 | 7.2 | ||
Turnout |
By-elections are called when a representative Councillor resigns or dies, so are unpredictable. A by-election is held to fill a political office that has become vacant between the scheduled elections.
Party | Candidate | Votes | % | ±% | |
---|---|---|---|---|---|
Labour | Michael Pringle (E) | 1,171 | 56.4 | -2.0 | |
Conservative | Ben Bradley (politician) | 533 | 25.7 | +4.1 | |
UKIP | Colin Hart | 347 | 16.7 | -3.3 | |
Liberal Democrats | Marylyn Rayner | 24 | 1.2 | +1.2 | |
Majority | |||||
Turnout | |||||
Labour hold | Swing | ||||
Party | Candidate | Votes | % | ±% | |
---|---|---|---|---|---|
Selston Parish Independents | David Barnard Martin | 2054 | 59.2 | -12.5 | |
Independent | Sam Wilson | 794 | 22.9 | +22.9 | |
Labour | Mike Hollis | 355 | 10.2 | -13.2 | |
UKIP | Ray Young | 161 | 4.6 | +4.6 | |
Conservative | Paul James Baxelby | 103 | 3.0 | +3.0 | |
Majority | |||||
Turnout | |||||
Selston Parish Independents hold | Swing |
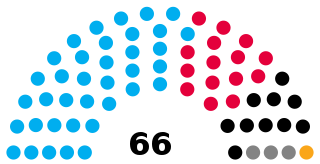
Nottinghamshire County Council is the upper-tier local authority for the non-metropolitan county of Nottinghamshire in England. It consists of 66 county councillors, elected from 56 electoral divisions every four years. The most recent election was held in 2021.
Jason Bernard Zadrozny is a British local politician from the Ashfield Independents and Leader of Ashfield District Council.
Elections to Nottinghamshire County Council took place on 4 June 2009, having been delayed from 7 May, in order to coincide with elections to the European Parliament.
An election to Derbyshire County Council took place on 2 May 2013 as part of the 2013 United Kingdom local elections. Following the final draft of the 2012 electoral review, 64 councillors were elected from 61 electoral divisions which returned either one or two county councillors each by first-past-the-post voting for a four-year term of office. No elections were held in the City of Derby, which is a unitary authority outside the area covered by the County Council. The Labour Party won back control of the council by a landslide victory, taking forty-two of the authority's sixty-four seats.
An election to Leicestershire County Council took place on 2 May 2013 as part of the 2013 United Kingdom local elections. 55 councillors were elected from 52 electoral divisions, which returned either one or two county councillors each by first-past-the-post voting for a four-year term of office. The Conservatives held control of the council with a reduced majority of 5 seats. Despite a strong challenge from UKIP, the party only gained 2 seats whilst the Liberal Democrats lost one seat and Labour recouped some of their 2009 losses, gaining 6 seats.
The West Sussex County Council election, 2013 took place on 2 May 2013, as part of the 2013 United Kingdom local elections. All 71 electoral divisions were up for election, which returned one county councillor each by first-past-the-post voting for a four-year term of office. At this election, the Conservative Party was seeking to retain overall control of the council, and the Liberal Democrats to maintain their position as the main opposition party.
Elections to the Wiltshire Council unitary authority took place on 2 May 2013. All ninety-eight seats were up for election, with each councillor being elected in a single-member electoral division, although in six of the divisions only one candidate was nominated and was thus declared the winner without elections taking place.
An election to Hampshire County Council took place on 2 May 2013 as part of the 2013 United Kingdom local elections. 78 councillors were elected from 75 electoral divisions, which returned either one or two county councillors each by first-past-the-post voting for a four-year term of office. The electoral divisions were the same as those of the previous election in 2009. No elections were held in Portsmouth and Southampton, which are unitary authorities outside the area covered by the County Council. The election saw the Conservative Party retain overall control of the council, with a reduced majority of five councillors.
Elections to Gloucestershire County Council took place on 2 May 2013 as part of the 2013 United Kingdom local elections. 53 electoral divisions elected one county councillor each by first-past-the-post voting for a four-year term of office. No elections were held in South Gloucestershire, which is a unitary authority outside the area covered by the County Council.
An election to Essex County Council took place on 2 May 2013 as part of the 2013 United Kingdom local elections. 75 councillors were elected from 70 electoral divisions, which returned either one or two county councillors each by first-past-the-post voting for a four-year term of office. The electoral divisions were the same as those used at the previous election in 2009. No elections were held in Thurrock or Southend-on-Sea, which are unitary authorities outside the area covered by the County Council.
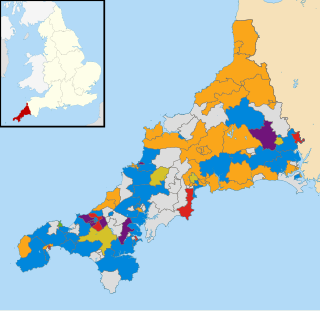
The Cornwall Council election, 2013, was an election for all 123 seats on the council. Cornwall Council is a unitary authority that covers the majority of the ceremonial county of Cornwall, with the exception of the Isles of Scilly which have an independent local authority. The elections took place concurrently with other local elections across England and Wales.
An election to Dorset County Council took place on 2 May 2013 as part of the United Kingdom local elections. 45 councillors were elected from 42 electoral divisions, which returned either one or two county councillors each by first-past-the-post voting for a four-year term of office. The electoral divisions were the same as those used at the previous election in 2009. No elections were held in Bournemouth or Poole, which are unitary authorities outside the area covered by the County Council. The election saw the Conservative Party maintain overall control of the council.
An election to Northamptonshire County Council took place on 2 May 2013 as part of the 2013 United Kingdom local elections. Following a boundary review, the number of county councillors was reduced from 73 to 57 from this election. All members were elected by first-past-the-post voting from single-member electoral divisions for a four-year term of office. The Conservative Party held on to their overall majority, having held overall control of the council since 2005.
The 2017 United Kingdom local elections were held on Thursday 4 May 2017. Local elections were held across Great Britain, with elections to 35 English local authorities and all councils in Scotland and Wales.
The 1985 Nottinghamshire County Council election was held on Thursday, 2 May 1985. The whole council of eighty-eight members was up for election and the result was that the Labour Party retained control of the Council, winning forty-eight seats. The Conservatives won thirty-seven councillors and the SDP–Liberal Alliance made gains in terms of percentage vote share, but won just two seats. An Independent councillor was elected in the Retford North division.
The 2017 Nottinghamshire County Council election took place on 4 May 2017 as part of the 2017 local elections in the United Kingdom. The whole council of 66 councillors was elected for a four-year term spanning 56 electoral divisions, a minority of which return two councillors. The voting system used is first-past-the-post.
The 1973 Nottinghamshire County Council election was held on Thursday, 12 April 1973. The election resulted in the Labour Party winning an overall majority of seats on the council.
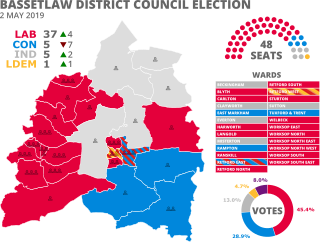
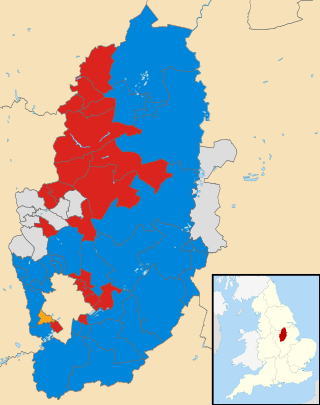
The 2019 Bassetlaw District Council election took place on 2 May 2019 to elect all 48 members of Bassetlaw District Council in England. This was on the same day as other local elections.
The 2021 Nottinghamshire County Council election took place on 6 May 2021 as part of the 2021 local elections in the United Kingdom. All 66 councillors were elected from 56 electoral divisions, which returned either one or two county councillors each by first-past-the-post voting for a four-year term of office.
Elections to Staffordshire County Council took place on 6 May 2021 on the same day as district council elections in Cannock Chase and Tamworth and other local elections in England. All of the council's divisions were up for election, meaning a total of 62 councillors were elected.