District result maps
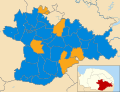 2011 results map
 2015 results map
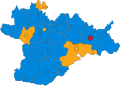 2019 results map
 2023 results map
South Norfolk District Council in Norfolk, England is elected once every four years. Since the last boundary changes in 2007, 46 councillors have been elected from 36 wards. [1]
The below table outlines the composition of South Norfolk Council from 1973 to 2023. [2]
| Year | Conservative | Lib Dems | Labour | Other | Governance | ||||
|---|---|---|---|---|---|---|---|---|---|
| 1973 | 6 | 1 | 7 | 33 | Independent | ||||
| 1976 | 38 | 2 | 1 | 6 | Conservative | ||||
| 1979 | 38 | 1 | 2 | 6 | Conservative | ||||
| 1983 | 33 | 5 | 1 | 8 | Conservative | ||||
| 1987 | 26 | 16 | 0 | 5 | Conservative | ||||
| 1991 | 22 | 22 | 0 | 3 | No overall control | ||||
| 1995 | 12 | 30 | 3 | 2 | Liberal Democrats | ||||
| 1999 | 16 | 27 | 2 | 2 | Liberal Democrats | ||||
| 2003 | 18 | 28 | 0 | 0 | Liberal Democrats | ||||
| 2007 | 39 | 7 | 0 | 0 | Conservative | ||||
| 2011 | 38 | 8 | 0 | 0 | Conservative | ||||
| 2015 | 40 | 6 | 0 | 0 | Conservative | ||||
| 2019 | 35 | 10 | 1 | 0 | Conservative | ||||
| 2023 | 25 | 11 | 9 | 2 | Conservative | ||||


| Party | Candidate | Votes | % | ±% | |
|---|---|---|---|---|---|
| Liberal Democrats | 731 | 48.5 | -4.9 | ||
| Conservative | 271 | 18.0 | +5.2 | ||
| Labour | 257 | 17.0 | +0.9 | ||
| Independent | 249 | 16.5 | -1.1 | ||
| Majority | 474 | 30.5 | |||
| Turnout | 1,508 | 27.5 | |||
| Liberal Democrats hold | Swing | ||||
| Party | Candidate | Votes | % | ±% | |
|---|---|---|---|---|---|
| Conservative | Margaret Dewsbury | 500 | 57.1 | +3.7 | |
| Liberal Democrats | Paul Blathwayt | 336 | 38.4 | +10.2 | |
| Green | Andrew Brockbank | 40 | 4.6 | -2.6 | |
| Majority | 164 | 18.7 | |||
| Turnout | 876 | 45.9 | |||
| Conservative hold | Swing | ||||
| Party | Candidate | Votes | % | ±% | |
|---|---|---|---|---|---|
| Conservative | Anthony Palmer | 845 | 50.9 | +25.5 | |
| Liberal Democrats | Susan Ayres | 714 | 43.0 | +2.9 | |
| Green | Graham Sessions | 102 | 6.1 | +6.1 | |
| Majority | 131 | 7.9 | |||
| Turnout | 1,661 | 29.6 | |||
| Liberal Democrats hold | Swing | ||||
| Party | Candidate | Votes | % | ±% | |
|---|---|---|---|---|---|
| Liberal Democrats | Katy Smith | 659 | 52.8 | ||
| Labour | Cyril Gibbs | 312 | 25 | ||
| Green | Ian Boreham | 277 | 22.2 | ||
| Majority | 347 | ||||
| Turnout | |||||
| Liberal Democrats hold | Swing | ||||
| Party | Candidate | Votes | % | ±% | |
|---|---|---|---|---|---|
| Conservative | Jaan Larner | 260 | 53.5 | ||
| Labour | Sarah Langton | 93 | 19.1 | ||
| Liberal Democrats | Ernest Green | 69 | 14.2 | ||
| UKIP | Ron Murphy | 64 | 13.2 | ||
| Majority | 167 | ||||
| Turnout | |||||
| Conservative hold | Swing | ||||
| Party | Candidate | Votes | % | ±% | |
|---|---|---|---|---|---|
| Liberal Democrats | Ian Spratt | 1,202 | 42.0 | +6.0 | |
| Conservative | Silvia Schmidtova | 969 | 33.8 | -13.0 | |
| Labour | John Martin | 402 | 14.0 | -3.2 | |
| Green | Tom Williamson | 183 | 6.4 | +6.4 | |
| Reform UK | Andrew Pond | 107 | 3.7 | +3.7 | |
| Majority | 233 | 8.1 | |||
| Turnout | 2,863 | ||||
| Liberal Democrats hold | Swing | ||||
| Party | Candidate | Votes | % | ±% | |
|---|---|---|---|---|---|
| Liberal Democrats | Robert McClenning | 667 | 37.1 | ||
| Conservative | Tony Holden | 434 | 24.2 | ||
| Independent | Nigel Legg | 404 | 22.5 | ||
| Labour | Geraldine Smith-Cullen | 164 | 9.1 | ||
| Green | Claire Sparkes | 128 | 7.1 | ||
| Majority | 233 | 13.0 | |||
| Turnout | 1,797 | ||||
| Liberal Democrats hold | Swing | ||||
| Party | Candidate | Votes | % | ±% | |
|---|---|---|---|---|---|
| Liberal Democrats | Carmina McConnell | 286 | 35.0 | ||
| Conservative | Martyn Lemon | 268 | 32.8 | ||
| Labour | Lowell Doheny | 173 | 21.2 | ||
| Green | Victoria Walters | 89 | 10.9 | ||
| Majority | 18 | 2.2 | |||
| Turnout | 816 | ||||
| Liberal Democrats hold | Swing | ||||
| Party | Candidate | Votes | % | ±% | |
|---|---|---|---|---|---|
| Green | Suzanne Wateridge | 404 | 40.5 | +29.1 | |
| Conservative | Charles Easton | 394 | 39.5 | -9.5 | |
| Labour | Michael Crouch | 131 | 13.1 | -9.5 | |
| Liberal Democrats | Trevor Wenman | 68 | 6.8 | -11.2 | |
| Majority | 10 | 1.0 | |||
| Turnout | 997 | 39.8 | |||
| Registered electors | 2,521 | ||||
| Green gain from Conservative | Swing | ||||
The election of councillors to Allerdale Borough Council in Cumbria, England took place every four years. The council was established in 1974 and it was abolished in 2023. The last elections were in 2019.
South Staffordshire District Council elections are held every four years. South Staffordshire District Council is the local authority for the non-metropolitan district of South Staffordshire in Staffordshire, England. Since the last boundary changes in 2023, 42 councillors have been elected from 20 wards.
Dacorum Borough Council in Hertfordshire, England is elected every four years. Since the last boundary changes in 2007, 51 councillors have been elected from 25 wards.
One third of North Hertfordshire District Council in England is elected each year, followed by one year without election. A boundary review is underway to allow the council to instead be elected all at once every four years from 2024 onwards.
Broadland District Council in Norfolk, England is elected every four years. Up until 2004 one third of the Council was elected each year, followed by one year without election. Since the last boundary changes in 2004, 47 councillors have been elected from 27 wards.
Aylesbury Vale District Council was the council for the non-metropolitan district of Aylesbury Vale in Buckinghamshire, England, which existed as a local government area from 1974 to 2020. The council was elected every four years from 1973 until 2020. At the time of its abolition, the council had 59 councillors, elected from 33 wards.
One third of Basildon Borough Council in Essex, England is elected each year, followed by one year without election. Since the last boundary changes in 2002, 42 councillors have been elected from 16 wards.
One third of Basingstoke and Deane Borough Council in Hampshire, England is elected each year, followed by one year without election. Since the last boundary changes in 2021, 54 councillors have been elected from 18 wards.
Blaby District Council elections are held every four years. Blaby District Council is the local authority for the non-metropolitan district of Blaby in Leicestershire, England. Since the last boundary changes in 2023 the council has comprised 36 councillors representing 17 wards, with each ward electing one, two or three councillors.
Fenland District Council in Cambridgeshire, England is elected every four years. Since the last boundary changes in 2023, the council has comprised 43 councillors representing 18 wards, with each ward electing one, two or three councillors.
Warwick District Council elections are held every four years. Warwick District Council is the local authority for the non-metropolitan district of Warwick in Warwickshire, England. Since the last boundary changes in 2019, 44 councillors have been elected from 17 wards.

West Lancashire Borough Council elections are generally held three years out of every four, with a third of the council elected each time. West Lancashire Borough Council is the local authority for the non-metropolitan district of West Lancashire in Lancashire, England. Since the last boundary changes in 2023 the council has comprised 45 councillors representing 15 wards, with each ward electing three councillors.
Norfolk County Council in England is elected every four years. Since the last boundary changes in 2005, 84 councillors have been elected from 84 wards.
North Norfolk District Council in Norfolk, England is elected every four years.
Plymouth City Council is the local authority for the a unitary authority of Plymouth in Devon, England. Until 1 April 1998 it was a non-metropolitan district.
King's Lynn and West Norfolk District Council in Norfolk, England is elected every four years. Since the last boundary changes in 2019, 55 councillors have been elected from 35 wards.
Dover District Council is the local authority for the Dover District in Kent, England. The council is elected every four years.

Horsham District Council in West Sussex, England, is elected every four years.
Gravesham Borough Council elections are held every four years to elect Gravesham Borough Council in Kent, England. Since the last boundary changes in 2023, the council has comprised 39 councillors, representing 17 wards.
Stoke-on-Trent City Council elections are held every four years. Stoke-on-Trent City Council is the local authority for the unitary authority of Stoke-on-Trent in the ceremonial county of Staffordshire, England. Since the last boundary changes in 2023, 44 councillors have been elected from 34 wards.