2008 Norwich City Council election

Last updated

2008 Norwich City Council election
  2007 1 May 2008 2010  

13 of 39 seats (One Third) to Norwich City Council
20 seats needed for a majority
 First partySecond party
 
Party Labour Green
Seats before1510
Seats won45
Seats after1513
Seat changeSteady2.svgIncrease2.svg3
Popular vote8,73810,140
Percentage24.9%28.9%
SwingDecrease2.svg2.2%Increase2.svg11.6%

 Third partyFourth party
 
Party Liberal Democrats Conservative
Seats before113
Seats won22
Seats after65
Seat changeDecrease2.svg5Increase2.svg2
Popular vote7,5098,076
Percentage21.4%23.0%
SwingDecrease2.svg11.0%Increase2.svg5.2%

Norwich wards 2008.png
Map showing the 2008 local election results in Norwich.

Council control before election

No Overall Control

Council control after election

No Overall Control

The 2008 Norwich City Council election took place on 1 May 2008 to elect members of Norwich City Council in England. One third of seats were up for election. [1] This was on the same day as other local elections.

Contents

The Green Party won the most votes across Norwich for the first time, and won a plurality of the seats up for election. This marked the first time that the Greens had won a plurality of the votes and seats in a local authority election. It is also, as of 2024, the last time that the Greens won the most seats or votes in a Norwich City Council election.

However, as only 13 of 39 council seats were up for election, Labour remained the largest party.

As of 2024, the 2008 election is the last election to see any member of the Conservative Party elected to Norwich City Council.

All changes in vote share are calculated with reference to the 2004 election, the last time these seats were contested.

Election result

Norwich Council Election Result 2008 [1]
PartySeatsGainsLossesNet gain/lossSeats %Votes %Votes+/−
  Green 530+338.528.910,140+11.6
  Labour 422±030.824.98,738-2.2
  Conservative 220+215.423.08,076+5.2
  Liberal Democrats 205–515.421.47,509-11.0
 Norwich Over The Water000±00.01.0354-0.5
  UKIP 000±00.00.7240n/a
Turnout 35.535,057

Changes in vote share are relative to the last time these seats were contested in 2004.

Council Composition

Prior to the election the composition of the council was:

1511103
LabourLib DemGreenCon

After the election, the composition of the council was:

151365
LabourGreenLib DemCon

Ward results

Bowthorpe

Bowthorpe
PartyCandidateVotes%±%
Conservative Niki George 1,268 46.0 +7.9
Labour Brenda April Ferris97935.5-2.2
Green Jennifer Susan Toms31511.4-1.8
Liberal Democrats Haydn Perrett1957.1-3.9
Majority28910.5+10.1
Turnout 2,75733.4+2.3
Conservative gain from Labour Swing Increase2.svg5.1

Catton Grove

Catton Grove
PartyCandidateVotes%±%
Conservative John Frederick Fisher 917 40.0 -2.0
Labour Julie Westmacott79734.8-1.9
Green Colin Hynson32114.0+0.9
Liberal Democrats Gordon Dean25511.1+3.0
Majority1205.2-0.1
Turnout 2,29029.2-2.1
Conservative gain from Labour Swing Decrease2.svg0.1

Crome

Crome
PartyCandidateVotes%±%
Labour David Charles Bradford 954 41.9 -2.5
Conservative Ernie Horth70430.9+3.5
Green Penelope Jane Edwards34815.3+3.2
Liberal Democrats Colin Douglas Penning27312.0-4.1
Majority25011.0-6.0
Turnout 2,27931.8-3.1
Labour hold Swing Decrease2.svg3.0

Eaton

Eaton
PartyCandidateVotes%±%
Liberal Democrats Judith Elizabeth Lubbock 1,950 46.7 +6.0
Conservative Niall Baxter1,52336.5+3.5
Green Richard Andrew Bearman3759.0-2.5
Labour Philip Martin David Taylor3247.8-4.0
Majority42710.2+2.5
Turnout 4,17257.8+3.0
Liberal Democrats hold Swing Increase2.svg1.3

Lakenham

Lakenham
PartyCandidateVotes%±%
Liberal Democrats David Angus Fairbairn 1,197 41.8 +5.6
Labour Bob Sanderson83329.1-10.4
Conservative Eileen Olive Wyatt32711.4+1.5
Green Martine Jane Beattie2689.4-0.6
UKIP Steve Emmens2408.4+4.0
Majority36412.7
Turnout 2,86540.2-0.2
Liberal Democrats hold Swing Increase2.svg8.0

Mancroft

Mancroft
PartyCandidateVotes%±%
Green Adrian St. John Holmes 1,099 43.1 +3.5
Labour David Fullman59823.5-3.0
Conservative Andrew Wiltshire49119.3+4.0
Liberal Democrats Simon Richard Nobbs36014.1-4.4
Majority50119.7+6.6
Turnout 2,54834.0+1.6
Green gain from Liberal Democrats Swing Increase2.svg3.3

Mile Cross

Mile Cross
PartyCandidateVotes%±%
Labour Deborah Giwahi 778 39.2 -4.4
Conservative Clive George Smith44322.3+9.2
Liberal Democrats Chris Thomas43922.1-8.3
Green Christine Patricia Way32516.4+3.6
Majority33516.9+3.7
Turnout 1,98526.6-5.0
Labour gain from Liberal Democrats Swing Decrease2.svg6.8

Nelson

Nelson
PartyCandidateVotes%±%
Green Bob Gledhill 1,906 65.3 +3.7
Labour Peter William Bartram35912.3-0.6
Liberal Democrats Gavin Andrew Holmes35612.2-4.6
Conservative Malcom Andrew Chamberlin2839.7+0.9
Majority1,54753.0+8.2
Turnout 2,91939.7-2.3
Green hold Swing Increase2.svg2.2

Sewell

Sewell
PartyCandidateVotes%±%
Labour Michael John Banham 687 29.4 -9.6
Green Penelope Mary Killingbeck57924.8+0.8
Conservative David John Mackie42518.2-0.8
Norwich Over The WaterPaul Scruton35415.2N/A
Liberal Democrats Ian Robert Williams29012.4-5.5
Majority1084.6-10.4
Turnout 2,33531.1-0.8
Labour hold Swing Decrease2.svg5.2

Thorpe Hamlet

Thorpe Hamlet
PartyCandidateVotes%±%
Green Peter Offord 1,360 46.1 +11.6
Liberal Democrats Jacky Sutton85929.1-5.4
Conservative Matthew Simon Davison42514.4-1.1
Labour Eamonn Burgess30510.3-5.2
Majority50117.0
Turnout 2,94937.0+1.6
Green gain from Liberal Democrats Swing Increase2.svg8.5

Town Close

Town Close
PartyCandidateVotes%±%
Green Samir Abbas Jeraj 1,317 41.9 -2.4
Liberal Democrats David John Munday75023.9+1.8
Conservative Tak-Man Li59118.8+0.2
Labour Andreas Kevin Paterson48315.4+0.5
Majority56718.1-4.1
Turnout 3,14138.5-2.6
Green gain from Liberal Democrats Swing Decrease2.svg2.1

University

University
PartyCandidateVotes%±%
Labour Brenda Arthur 1,052 43.4 -6.8
Green Armandine Jacqueline Blanche Stone70829.2+13.2
Conservative Paul Anthony George Wells33313.7+3.8
Liberal Democrats Andrew Norris Wright33213.7-6.8
Majority34414.2-15.5
Turnout 2,42533.2+0.1
Labour gain from Liberal Democrats Swing Decrease2.svg10.0

Wensum

Wensum
PartyCandidateVotes%±%
Green Ruth Alexandra Makoff 1,219 50.6 +1.5
Labour Stephanie Bridget Clark58924.5-0.2
Conservative Mike Gillespie34614.4+3.3
Liberal Democrats Brian Ralph Clark25310.5-4.5
Majority63026.2+1.8
Turnout 2,40730.5+0.7
Green hold Swing Increase2.svg0.9

Related Research Articles

<span class="mw-page-title-main">Politics of Scotland</span>

The politics of Scotland operate within the constitution of the United Kingdom, of which Scotland is a country. Scotland is a democracy, being represented in both the Scottish Parliament and the Parliament of the United Kingdom since the Scotland Act 1998. Most executive power is exercised by the Scottish Government, led by the First Minister of Scotland, the head of government in a multi-party system. The judiciary of Scotland, dealing with Scots law, is independent of the legislature and the Scottish Government. Scots law is primarily determined by the Scottish Parliament. The Scottish Government shares some executive powers with the Scotland Office, a British government department led by the Secretary of State for Scotland.

<span class="mw-page-title-main">NT Greens</span> Political party in Australia

The Northern Territory Greens are a green party in the Northern Territory, a member of the federation of the Australian Greens party. It is the only branch of the Australian Greens to have never had any parliamentary representation, as well as the only one that does not run candidates in every single seat. The party is the most progressive registered party in the Northern Territory.

<span class="mw-page-title-main">Victorian Greens</span> Political party in Australia

The Victorian Greens, officially known as the Australian Greens Victoria, is the Victorian state member party of the Australian Greens, a green political party in Australia.

The Green Party of England and Wales has its roots in the PEOPLE Party started in Coventry in 1972/3 by four professional friends. It then changed its name to the more descriptive Ecology Party in 1975, and to the Green Party ten years later. In the 1990s, the Scottish and Northern Ireland wings of the Green Party in the United Kingdom decided to separate amicably from the party in England and Wales, to form the Scottish Green Party and the Green Party in Northern Ireland. The Wales Green Party became an autonomous regional party and remained within the new Green Party of England and Wales.

This article lists the election results of the Green Party of England and Wales in the UK parliamentary, European parliamentary, London Assembly, and Senedd elections.

<span class="mw-page-title-main">2008 Stroud District Council election</span>

The 2008 Stroud Council election took place on 1 May 2008 to elect members of Stroud District Council in Gloucestershire, England. One third of the council was up for election and the Conservative Party stayed in overall control of the council.

<span class="mw-page-title-main">2011 Norwich City Council election</span> 2011 city council election for Norwich, England

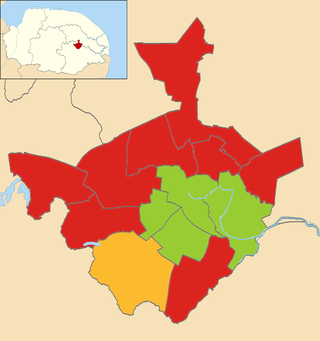
The 2011 Norwich City Council election took place on 5 May 2011 to elect members of Norwich City Council in England. One third of seats were up for election. This was on the same day as other local elections and the nationwide referendum on the Alternative Vote.

<span class="mw-page-title-main">2012 Norwich City Council election</span> 2012 city council election for Norwich, England

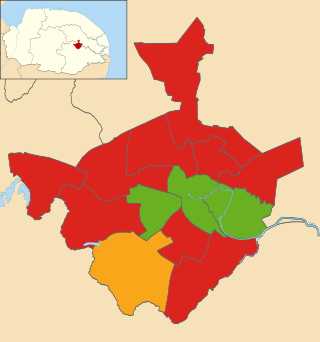
Elections to Norwich City Council took place on 3 May 2012, the same day as other 2012 United Kingdom local elections. Fifteen out of thirty-nine council seats were up for election and the Labour Party gained control of the council from No Overall Control.

<span class="mw-page-title-main">2013 United Kingdom local elections</span>

The 2013 United Kingdom local elections took place on Thursday 2 May 2013. Elections were held in 35 English councils: all 27 non-metropolitan county councils and eight unitary authorities, and in one Welsh unitary authority. Direct mayoral elections took place in Doncaster and North Tyneside. These elections last took place on the 4 June 2009 at the same time as the 2009 European Parliament Elections, except for County Durham, Northumberland and the Anglesey where elections last took place in 2008.

<span class="mw-page-title-main">2014 Norwich City Council election</span> 2014 city council election for Norwich, England

Council elections for the Norwich City Council were held on 22 May 2014 as part of the 2014 United Kingdom local elections. The elections were moved from earlier on in May to coincide with the East of England 2014 European Parliament election.

<span class="mw-page-title-main">2015 Norwich City Council election</span> 2015 city council election for Norwich, England

The 2015 Norwich City Council election took place on 7 May 2015 to elect approximately one third of the members of Norwich City Council in England. This was on the same day as other local elections and the UK general election. Thirteen seats were due to be contested, with a further two seats up for election where casual vacancies had arisen. Labour won ten of the available seats, the Green Party won four, and the Liberal Democrats one. The Conservatives gained their highest ever vote in many city wards including Town Close and Thorpe Hamlet, and across Norwich came within almost 2000 votes of the Green Party, however failed to gain any seats. Just one seat changed hands - Wensum - which Labour gained from the Greens. Labour retained overall control of the council with 22 seats out of 39, the Greens continue to form the main opposition with 14 seats, and the Liberal Democrats have 3.

<span class="mw-page-title-main">2016 Norwich City Council election</span> 2016 city council election for Norwich, England

The 2016 Norwich City Council election took place on 5 May 2016 to elect members of Norwich City Council in England. This was on the same day as other local elections. The Labour Party increased their majority at the expense of the Green Party, capturing 4 previously Green-held seats; the Greens retained only Thorpe Hamlet ward, by a margin of 31 votes.

<span class="mw-page-title-main">2010 Norwich City Council election</span> 2010 city council election for Norwich, England

The 2010 Norwich City Council election took place on 9 September 2010 to elect members of Norwich City Council in England. One third of seats were up for election. The elections took place later in the year than other local elections. Norwich had previously been granted permission to become a unitary authority, with local elections postponed until 2011. When the Coalition Government won the general election earlier that year, Norwich's permission to form a unitary authority was overturned. Because of this, the High Court ruled that those councillors who had stayed on beyond their four-year term were no longer constitutionally elected, and would need to seek re-election. This resulted in there being an election in every ward in September to renew the mandate for the wards.

<span class="mw-page-title-main">2018 Norwich City Council election</span> 2018 city council election for Norwich, England

The 2018 Norwich City Council election took on 3 May 2018 to elect members of Norwich City Council in England. This was on the same day as other local elections. 13 of 39 seats (one-third) were up for election.

<span class="mw-page-title-main">2018 Cannock Chase District Council election</span>

Elections to Cannock Chase District Council took place on 3 May 2018 on the same day as other local elections in England. A third of the council was up for election, meaning a total of 13 councillors were elected from all but two of the council's wards.

<span class="mw-page-title-main">2018 Great Yarmouth Borough Council election</span>

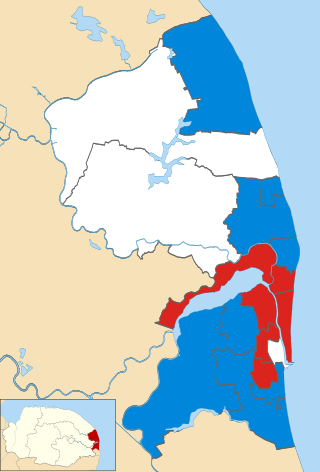
The 2018 Great Yarmouth Borough Council election took place on 4 May 2018 to elect members of Great Yarmouth Borough Council in England. This was on the same day as other local elections in England. The Conservatives gained control of the council with UKIP which had previously won 10 seats being wiped out. Part of the Conservative success was attributed to former UKIP councillors defecting to them.

<span class="mw-page-title-main">2019 Norwich City Council election</span> Elections in Norwhich

Elections to Norwich City Council were held on 2 May 2019. Following boundary changes, all 39 seats were put up for election, with three councillors being elected per ward using the block vote system. The election saw the Green Party reclaim five seats from the Labour Party, while losing one to Labour in Town Close. The Labour Party retained its majority on the council.

2019 Sunderland City Council election

The 2019 Sunderland City Council election took place on 2 May 2019 to elect members of Sunderland City Council in England. The election took place on the same day as other local elections.

<span class="mw-page-title-main">2021 Norwich City Council election</span>

The 2021 Norwich City Council election took place on 6 May 2021 to elect members of Norwich City Council in England. This was on the same day as other local elections. 13 of 39 seats (one-third) were up for election.

Elections to The Highland Council were held on 5 May 2022, the same day as the 31 other Scottish local government elections. As with other Scottish council elections, it was held using single transferable vote (STV) – a form of proportional representation – in which multiple candidates are elected in each ward and voters rank candidates in order of preference.

References

  1. 1 2 "Local Election Results 2008 - Norwich". Local Elections Archive Project. Retrieved 3 May 2016.