2008 Sunderland City Council election

Last updated

2008 Sunderland City Council election
Flag of England.svg
  2007 1 May 2008 2010  

One third of 75 seats on Sunderland City Council
38 seats needed for a majority
 First partySecond partyThird party
 
Party Labour Conservative Independent
Seats before53174
Seats won1492
Seats after48224
Seat changeDecrease2.svg5Increase2.svg5Steady2.svg0

 Fourth party
 
Party Liberal Democrats
Seats before1
Seats won0
Seats after1
Seat changeSteady2.svg0

Sunderland 2008 election map.png
Map of the 2008 Sunderland City Council election results. Labour in red, Conservatives in blue, Lib Dems in yellow and Independents in white.

Majority party before election

Labour

Majority party after election

Labour

The 2008 Sunderland Council election took place on 1 May 2008 to elect members of Sunderland Metropolitan Borough Council in Tyne and Wear, England. One third of the council was up for election and the Labour Party stayed in overall control of the council. [1] [2]

Contents

Background

Before the election the council had 53 Labour, 17 Conservative, 4 independents and 1 Liberal Democrat councillors. 25 seats were contested in the election with a record 70,828 voters being registered to vote by post, a third of all registered voters. [3]

In the period since the previous local elections, the Conservatives had won a seat from Labour in a by-election in September 2007 in Washington East. [4] Two Labour councillors who had left the party in November 2006 to sit as Independents, George Blyth in Doxford and Bryn Sidaway in Hendon, retired at this election.

Election result

The results saw Labour remain in control of the council, but with a reduced majority after the Conservative Party gained 5 seats, [5] including 4 from Labour. [6] The Conservatives gained 2 seats from Labour in Washington and a seat each in Ryhope and St Chads, while also taking a seat from an independent, formerly Labour, councillor in Doxford. [7] The Conservative gains took the party to 22 seats, compared to 48 for Labour. [8] Labour also lost 2 seats to independents in Copt Hill and Houghton wards, but did take one seat back in Hendon which had been held by an independent. [7] [8] This meant there were 4 independents on the council, while the Liberal Democrats remained on 1 seat. [8] Overall turnout in the election was 34.9%. [9]

The leader of the Conservatives on the council, Lee Martin, put the Labour losses partly down to national issues such as the abolition of the 10 pence income tax rate and partly down to local issues. [10] The Labour leader of the council described the results as "mid-term blues", while the defeat of the Labour cabinet member Joseph Lawson in Houghton ward to an independent was put down to plans to shut a quarry in the area. [11]

Sunderland Local Election Result 2008 [12] [13]
PartySeatsGainsLossesNet gain/lossSeats %Votes %Votes+/−
  Labour 1316Decrease2.svg55239.629,109Decrease2.svg3.7
  Conservative 950Increase2.svg5363223,547Increase2.svg3.9
  Liberal Democrats 100Steady2.svg0411.68,543Increase2.svg2.9
  BNP 000Steady2.svg0010.27,540Decrease2.svg0.4
  Independent 222Steady2.svg086.44,710Decrease2.svg1.9
 The Left Party000Steady2.svg000.190Increase2.svg0.1
  UKIP 000Steady2.svg000.140Steady2.svg0

This resulted in the following composition of the Council:

PartyPrevious CouncilNew Council
Labour5348
Conservatives1722
Independent44
Liberal Democrats11
Total7575
Working majority 31  21 

Ward results

Barnes [12] [14]
PartyCandidateVotes%±%
Conservative Anthony Morrissey1,71251.6-2.1
Labour Philip Routledge80924.4+1.7
Liberal Democrats Gulya Dixon48914.7-0.2
BNP Robert Fletcher3089.3+0.6
Majority90327.2-3.8
Turnout 3,31838.0+0.3
Conservative hold Swing
Castle [12] [14]
PartyCandidateVotes%±%
Labour Tommy Foster1,37652.8-13.2
BNP John Humble35013.4-2.2
Conservative Clair Hall34313.2+5.7
Independent Ronald McQuillan26410.1-0.8
Liberal Democrats Jon Dewart1827.0+7.0
The Left PartyGary Duncan903.5+3.5
Majority1,02639.4-11.1
Turnout 2,60530.5+0.5
Labour hold Swing
Copt Hill [12] [14]
PartyCandidateVotes%±%
Independent Derrick Smith1,48745.6+2.7
Labour Joan Carthy1,12334.5-1.1
Conservative George Brown45113.8+2.7
BNP Terence Woolford1976.0+0.5
Majority36411.2+3.9
Turnout 3,25836.7+0.7
Independent gain from Labour Swing
Doxford [12] [14]
PartyCandidateVotes%±%
Conservative Richard Vardy1,17841.6+17.5
Labour Linda Mitchell99135.0-0.8
Liberal Democrats Lewis Green37113.1+13.1
BNP Peter Swain29210.3+1.9
Majority1876.6
Turnout 2,83235.7-0.5
Conservative gain from Labour Swing

The incumbent Labour councillor, George Blyth, had been elected in 2004 as a Labour candidate, but subsequently left the party to sit as an Independent councillor, and retired at this election.

Fulwell [12] [14]
PartyCandidateVotes%±%
Conservative Bob Francis2,09253.2-0.7
Labour Bob Price1,03226.2+1.1
Liberal Democrats Geoffrey Pryke45911.7-1.4
BNP Frederick Donkin3528.9+1.0
Majority1,06026.9-1.9
Turnout 3,93543.5+0.8
Conservative hold Swing
Hendon [12] [14]
PartyCandidateVotes%±%
Labour Michael Mordey87436.4-6.6
Independent Sammy Doran55723.2+4.6
Conservative Deborah Lorraine51721.5+3.3
BNP Ian Sayers2349.7-5.2
Liberal Democrats Nathan Hazlett2199.1+9.1
Majority31713.2-11.2
Turnout 2,40129.5-0.7
Labour gain from Independent Swing

The incumbent Labour councillor, Bryn Sidaway, had been elected in 2004 as a Labour candidate, but subsequently left the party to sit as an Independent councillor, and retired at this election.

Hetton [12] [14]
PartyCandidateVotes%±%
Labour Jim Blackburn1,84369.2+13.9
Conservative Douglas Middlemiss82130.8+18.8
Majority1,02238.4+1.1
Turnout 2,66430.6-0.7
Labour hold Swing
Houghton [12] [14]
PartyCandidateVotes%±%
Independent Sheila Ellis1,41544.8+26.4
Labour Joe Lawson1,16837.0-13.7
Conservative Edward Allen35511.2-0.3
BNP Kevin Robe2196.9-1.4
Majority2477.8
Turnout 3,15735.8+2.0
Independent gain from Labour Swing
Millfield [12] [14]
PartyCandidateVotes%±%
Liberal Democrats Paul Dixon1,05946.0+15.5
Labour Bob Bowman55824.3-8.6
Conservative Gwennyth Gibson34615.0+1.6
BNP Christopher Lathan1797.8-0.9
Independent Margaret Snaith843.7-3.6
UKIP Pauline Featonby-Warren401.7-1.4
Independent Gary Hollern351.5+1.5
Majority50121.8
Turnout 2,30132.3+0.5
Liberal Democrats hold Swing
Pallion [12] [14]
PartyCandidateVotes%±%
Labour Amy Wilson1,05544.3-0.4
Conservative Michael Leadbitter64527.1+8.4
BNP Paul Humble37715.8+4.1
Liberal Democrats Sham Vedhara30512.8+1.1
Majority41017.2-8.7
Turnout 2,38231.6+1.1
Labour hold Swing
Redhill [12] [14]
PartyCandidateVotes%±%
Labour Bryan Charlton1,31549.5-6.6
BNP John Martin51719.5-3.5
Independent Ian Leadbitter35913.5+6.6
Conservative Martin Anderson27910.5-0.3
Liberal Democrats Rob Boyce1857.0+7.0
Majority79830.1-3.0
Turnout 2,65531.0+1.1
Labour hold Swing
Ryhope [12] [14]
PartyCandidateVotes%±%
Conservative Christopher Fairs1,01233.7+3.5
Labour Ronald Bainbridge98332.7-8.6
Independent Patrick Lavelle50916.9+1.6
BNP Wayne Watts2919.7-3.5
Liberal Democrats David Slone2097.0+7.0
Majority291.0
Turnout 3,00437.3+1.2
Conservative gain from Labour Swing
Sandhill [12] [14]
PartyCandidateVotes%±%
Labour Jim Scott1,19647.0-9.8
Conservative Paula Wilkinson66226.0-0.9
BNP Carl Donkin35814.1-2.2
Liberal Democrats Robert Peel32712.9+12.9
Majority53421.0-8.8
Turnout 2,54330.7+0.3
Labour hold Swing
Shiney Row [12] [14]
PartyCandidateVotes%±%
Labour Anne Hall1,57148.4-5.8
Conservative Joyce Wake90027.7+3.5
Liberal Democrats Carol Attewell42413.1+13.1
BNP Ian Baillie35010.8+0.7
Majority67120.7-9.3
Turnout 3,24533.4+1.7
Labour hold Swing
Silksworth [12] [14]
PartyCandidateVotes%±%
Labour Pat Smith1,50349.3-6.0
Conservative Patricia Francis86628.4-3.0
BNP Anthony James40613.3+0.0
Liberal Democrats Alf Fowler2759.0+9.0
Majority63720.9-3.0
Turnout 3,05036.7+1.1
Labour hold Swing
Southwick [12] [14]
PartyCandidateVotes%±%
Labour Rosalind Copeland1,15143.5-1.3
Conservative Terence Docherty70226.5+6.2
BNP Alan Brettwood53020.0+2.6
Liberal Democrats Anne Griffin2639.9-0.5
Majority44917.0-7.5
Turnout 2,64632.7-0.2
Labour hold Swing
St Annes [12] [14]
PartyCandidateVotes%±%
Labour Susan Watson1,08945.3-5.1
Conservative Shaun Cudworth52822.0+4.8
BNP Julie Potter41517.3+6.1
Liberal Democrats Simon Dawes37115.4+5.2
Majority56123.3-9.9
Turnout 2,40329.5+0.5
Labour hold Swing
St Chads [12] [14]
PartyCandidateVotes%±%
Conservative Alan Wright1,66050.3+3.4
Labour Darryl Dixon1,20636.5-3.9
BNP Lynne Hudson2497.5+0.1
Liberal Democrats Diana Lambton1855.6+5.6
Majority45413.8+7.4
Turnout 3,30041.7-0.9
Conservative gain from Labour Swing
St Michaels [12] [14]
PartyCandidateVotes%±%
Conservative Margaret Forbes2,04660.2+0.8
Labour Lewis Atkinson79723.4-2.1
Liberal Democrats Les Wascoe34210.1+10.1
BNP Joanne Cruickshanks2166.4+0.4
Majority1,24936.7+2.8
Turnout 3,40140.8+1.5
Conservative hold Swing
St Peters [12] [14]
PartyCandidateVotes%±%
Conservative Lilian Walton1,50147.8+4.0
Labour Stephen Bonallie84026.7-4.5
Liberal Democrats Diana Matthew44314.1+0.7
BNP Derek Wright35811.4+2.5
Majority66121.0+8.4
Turnout 3,14237.8+0.1
Conservative hold Swing
Washington Central [12] [14]
PartyCandidateVotes%±%
Labour Dianne Snowdon1,28340.3-8.3
Conservative Hilary Johnson83326.2+3.0
Liberal Democrats John Mclelland74123.3+5.6
BNP Clive Thompson32810.3-0.2
Majority45014.1-11.3
Turnout 3,18536.3+0.6
Labour hold Swing
Washington East [12] [14]
PartyCandidateVotes%±%
Conservative Ivan Richardson1,38443.2+3.1
Labour Neville Padgett1,29140.3+1.0
Liberal Democrats Malcolm Bannister40112.5-1.7
BNP Paul Masters1304.1-2.2
Majority932.9+2.1
Turnout 3,20637.1+1.2
Conservative gain from Labour Swing
Washington North [12] [14]
PartyCandidateVotes%±%
Labour John Kelly1,49053.0-5.0
Conservative Kathleen Irvine62522.2+5.9
Liberal Democrats Steve Thomas36513.0-3.3
BNP Lynne Baillie32911.7+2.3
Majority86530.8-10.9
Turnout 2,80932.3+1.0
Labour hold Swing
Washington South [12] [14]
PartyCandidateVotes%±%
Conservative Eddie Wake1,32642.5+5.4
Labour Linda Williams1,17337.6+2.2
Liberal Democrats David Griffin39012.5-2.9
BNP Mildred Smart2297.3-0.4
Majority1534.9+3.3
Turnout 3,11837.5+2.7
Conservative gain from Labour Swing
Washington West [12] [14]
PartyCandidateVotes%±%
Labour Bernard Scaplehorn1,39246.1-6.8
Conservative Olwyn Bird76325.3+7.8
Liberal Democrats Irene Bannister53817.8-0.4
BNP Doreen Smart32610.8+2.6
Majority62920.8-13.9
Turnout 3,01933.9+0.8
Labour hold Swing

Related Research Articles

The 2003 West Lancashire District Council election took place on 1 May 2003 to elect members of West Lancashire District Council in Lancashire, England. One third of the council was up for election and the Conservative Party stayed in overall control of the council.

<span class="mw-page-title-main">2007 St Helens Metropolitan Borough Council election</span> Council election in Merseyside, England

The 2007 St Helens Metropolitan Borough Council election took place on 3 May 2007 to elect members of St Helens Metropolitan Borough Council in Merseyside, England. One third of the council was up for election and the council stayed under no overall control.

<span class="mw-page-title-main">2010 Barnet London Borough Council election</span> 2010 local election in England

The 2010 Barnet Council election took place on 6 May 2010 to elect members of Barnet London Borough Council in London, England. The whole council was up for election and the Conservative party stayed in overall control of the council.

<span class="mw-page-title-main">2004 Solihull Metropolitan Borough Council election</span> 2004 UK local government election

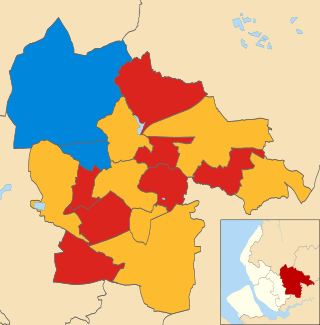
The 2004 Solihull Metropolitan Borough Council election took place on 10 June 2004 to elect members of Solihull Metropolitan Borough Council in the West Midlands, England. The whole council was up for election with boundary changes since the last election in 2003. The Conservative Party stayed in overall control of the council.

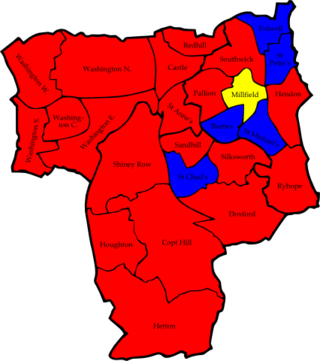
The 1999 Sunderland Council election took place on 6 May 1999 to elect members of Sunderland Metropolitan Borough Council in Tyne and Wear, England. One third of the council was up for election and the Labour Party stayed in overall control of the council.

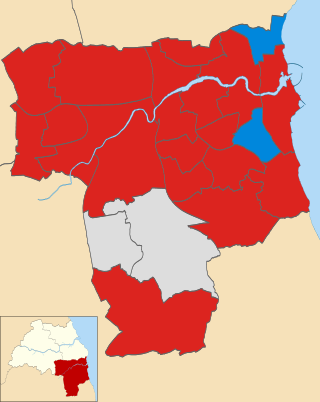
The 2002 Sunderland Council election took place on 2 May 2002 to elect members of Sunderland Metropolitan Borough Council in Tyne and Wear, England. One third of the council was up for election and the Labour Party stayed in overall control of the council.

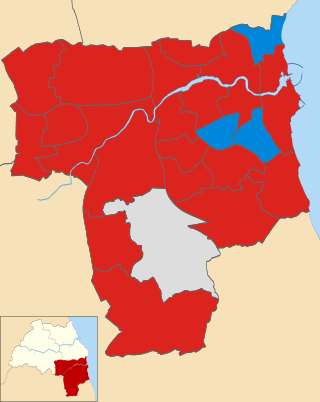
The 2003 Sunderland Council election took place on 1 May 2003 to elect members of Sunderland Metropolitan Borough Council in Tyne and Wear, England. One third of the council was up for election and the Labour Party stayed in overall control of the council.

<span class="mw-page-title-main">2006 Sunderland City Council election</span> 2016 local election in Sunderland

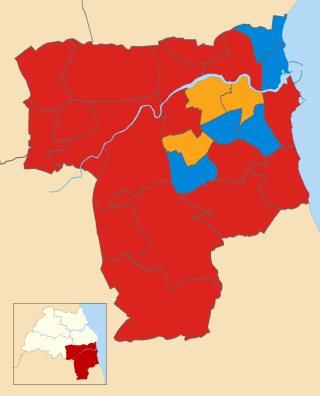
The 2006 Sunderland Council election took place on 4 May 2006 to elect members of Sunderland City Council in Tyne and Wear, England. One third of the Council was up for election and the Labour Party stayed in overall control.

<span class="mw-page-title-main">2007 Sunderland City Council election</span> 2007 UK local government election

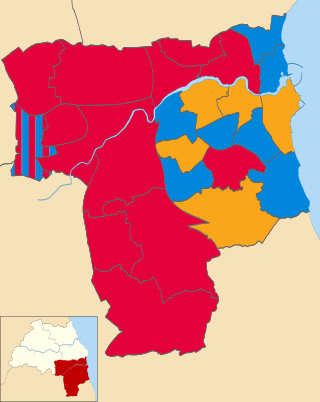
The 2007 Sunderland Council election took place on 3 May 2007 to elect members of Sunderland Metropolitan Borough Council in Tyne and Wear, England. One third of the council was up for election and the Labour Party stayed in overall control of the council.

<span class="mw-page-title-main">2010 Sunderland City Council election</span> Sunderland City Council election

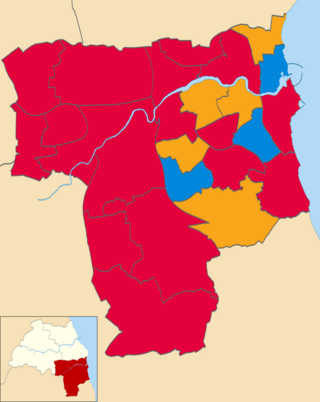
The 2010 Sunderland Council election took place on 6 May 2010 to elect members of Sunderland Metropolitan Borough Council in Tyne and Wear, England. One third of the council was up for election and the Labour Party stayed in overall control of the council. The election took place on the same day as the 2010 General Election.

<span class="mw-page-title-main">2008 Stroud District Council election</span> 2008 UK local government election

The 2008 Stroud Council election took place on 1 May 2008 to elect members of Stroud District Council in Gloucestershire, England. One third of the council was up for election and the Conservative Party stayed in overall control of the council.

<span class="mw-page-title-main">2011 Sunderland City Council election</span> 2011 UK local government election

The 2011 Sunderland Council election took place on 5 May 2011 to elect members of Sunderland Metropolitan Borough Council in Tyne and Wear, England. One third of the council was up for election and the Labour Party stayed in overall control of the council.

<span class="mw-page-title-main">2012 Sunderland City Council election</span> 2012 UK local government election

The 2012 Sunderland Council election took place on 3 May 2012 to elect members of Sunderland City Council in England. It was held on the same day as other 2012 United Kingdom local elections.

<span class="mw-page-title-main">2008 Colchester Borough Council election</span> 2008 UK local government election

The 2008 Colchester Borough Council election took place on 1 May 2008 to elect members of Colchester Borough Council in Essex, England. One third of the council was up for election and the Conservative party lost overall control of the council to no overall control.

<span class="mw-page-title-main">2011 Torridge District Council election</span> 2011 UK local government election

The 2011 Torridge District Council election took place on 5 May 2011 to elect members of Torridge District Council in Devon, England. The whole council was up for election and the council stayed under no overall control.

<span class="mw-page-title-main">2016 Sunderland City Council election</span> 2016 UK local government election

The 2016 Sunderland City Council election took place on 5 May 2016 to elect one-third of the members of Sunderland City Council in England. This was on the same day as other local elections held across the United Kingdom.

<span class="mw-page-title-main">2018 Sunderland City Council election</span> 2018 UK local government election

The 2018 Sunderland City Council election took place on 3 May 2018 to elect members of Sunderland City Council in England. The election took place on the same day as other local elections.

2021 Sunderland City Council election 2021 UK local government election

The 2021 Sunderland City Council election took place on 6 May 2021 to elect members of Sunderland City Council in England on the same day as other elections across the United Kingdom.

<span class="mw-page-title-main">2022 Sunderland City Council election</span> 2022 UK local government election

The 2022 Sunderland City Council election took place on 5 May 2022 to elect members of Sunderland City Council. This is on the same day as other elections across the United Kingdom.

<span class="mw-page-title-main">2023 Sunderland City Council election</span> 2023 UK local government election

The 2023 Sunderland City Council election took place on 4 May 2023 to elect members of Sunderland City Council. There were 25 of the 75 seats of the council up for election, being the usual third of the council. The election took place at the same time as other local elections across England.

References

  1. "Sunderland". BBC News Online . Retrieved 29 December 2010.
  2. "National: Full election results". The Guardian . 3 May 2008. p. 45.
  3. "Postal voting hits record high in polls". Sunderland Echo. 5 April 2008. Retrieved 30 December 2010.[ dead link ]
  4. "Tory victory in by-election" . Retrieved 2 July 2018.
  5. Webster, Philip (2 May 2008). "Labour endures worst poll night for 30 years". The Times . p. 2.
  6. "Labour to control unitary council". BBC News Online . 2 May 2008. Retrieved 30 December 2010.
  7. 1 2 "Tory leader: We can go on to win Sunderland". Sunderland Echo. 2 May 2008. Retrieved 30 December 2010.[ dead link ]
  8. 1 2 3 Young, Peter (2 May 2008). "Labour takes a real hammering". Evening Chronicle . p. 8.
  9. "All the results from Tyneside and Wearside's local councils". Evening Chronicle . 8 May 2010. p. 2.
  10. Pearson, Adrian (2 May 2008). "Even loyal areas punish Labour for national ills". The Journal. p. 5.
  11. "Sunderland Tories celebrate; local elections 2008". The Journal. 2 May 2008. Retrieved 30 December 2010.[ dead link ]
  12. 1 2 3 4 5 6 7 8 9 10 11 12 13 14 15 16 17 18 19 20 21 22 23 24 25 26 "Results of Poll". Sunderland City Council. Archived from the original on 7 August 2011. Retrieved 29 December 2010.
  13. "Results". The Times . 3 May 2008. p. 14.
  14. 1 2 3 4 5 6 7 8 9 10 11 12 13 14 15 16 17 18 19 20 21 22 23 24 25 "Labour down five seats + video". Sunderland Echo. 2 May 2008. Retrieved 30 December 2010.[ dead link ]
Preceded by
2007 Sunderland City Council election
Sunderland City Council elections Succeeded by
2010 Sunderland City Council election