2015 North Tyneside Metropolitan Borough Council election

Last updated

The 2015 North Tyneside Metropolitan Borough Council election took place on 7 May 2015 to one third of the members of North Tyneside Metropolitan Borough Council in England. This was on the same day as other local elections and the 2015 UK General Election.

Contents

All of the seats being contested were last contested in 2011, and these results are compared to the results of 2014.

Result

North Tyneside Council Election Result 2015
PartySeatsGainsLossesNet gain/lossSeats %Votes %Votes+/−
  Labour 4950+581.651.851,475+4.9%
  Conservative 903-31527.427,212+2.3%
  UKIP 0000015.715,642-5.4%
  Liberal Democrats 202-23.42.92,880-1.5%
  Green 000001.91,845+1.7%
  TUSC 000000.1261-0.3%
  National Front 000000.1102+0.1%

Council Composition

Prior to the election the composition of the council was:

44124
LabourConservativeLib
Dem

After the election the composition of the council was:

4992
LabourConservativeLib
Dem

Candidates by party

20 / 20
20 / 20
3 / 20
1 / 20
20 / 20
5 / 20
3 / 20

There are a total of 72 candidates standing across the 20 seats - an average of 3.6 in each ward. The Labour Party, Conservative Party and UK Independence Party are all fielding a full slate of 20 candidates. The Green Party are fielding 5 candidates, whilst there are 3 candidates representing the Liberal Democrats and the Trade Unionist and Socialist Coalition respectively. 1 candidate is representing the National Front.

Since the last local election in 2014, the number of candidates representing Labour, the Conservatives, UKIP and the TUSC was unchanged. The Green Party had an increase of 4 candidates, the National Front an increase of 1 candidate, whilst the Liberal Democrats had a decrease of 4 candidates.

Results by ward

The electoral division results listed below [1] are based on the changes from the 2014 elections, [2] not taking into account any mid-term by-elections or party defections.

Battle Hill

Battle Hill
PartyCandidateVotes%±%
Labour Lesley Spillard3,03360.4+17.3
UKIP Chris Croft1,25825.1+5.7
Conservative Lewis Austin72714.5+6.7
Majority1,77535.4+22.1
Turnout 5,01860.5+27.9
Labour hold Swing +5.8

Benton

Benton
PartyCandidateVotes%±%
Labour Janet Hunter2,95055.3+0.4
Conservative Linda Arkley 1,44027.0+1.9
UKIP Maureen Gallon5199.7-7.7
Green Mary Laver3496.5+6.5
TUSC Tim Wall791.5-1.1
Majority1,51028.3-1.5
Turnout 5,33767.8+38.3
Labour hold Swing -0.8

Camperdown

Camperdown
PartyCandidateVotes%±%
Labour Ray Glindon2,91564.1+5.0
UKIP Stew Hayes84218.5-11.1
Conservative Ian Wallace79017.4+6.0
Majority2,03744.8+15.3
Turnout 4,54757.2+27.7
Labour hold Swing +8.1

Chirton

Chirton
PartyCandidateVotes%±%
Labour Norman Percy2,65863.9+8.2
UKIP Norman Morse90021.6-4.8
Conservative Carol Ayre60114.5+4.0
Majority1,75842.3+13.0
Turnout 4,15949.6+22.6
Labour hold Swing +6.5

Collingwood

Collingwood
PartyCandidateVotes%±%
Labour Martin Rankin2,57548.8+1.2
Conservative Barbara Stevens1,55129.4+6.6
UKIP Katrina Harte1,04919.9-3.2
TUSC Dave Taws1011.9-1.6
Majority1,02419.4-6.1
Turnout 5,27662.3+26.5
Labour hold Swing -2.7

Cullercoats

Cullercoats
PartyCandidateVotes%±%
Labour David McMeekan2,24239.7+1.7
Conservative George Westwater2,21839.3-3.4
UKIP Phyl Masters73613.0-6.3
Green Mark Adamson3716.7+6.7
TUSC John Hoare811.4+1.4
Majority240.4-4.3
Turnout 5,64873.7+28.7
Labour gain from Conservative Swing +2.6

Howdon

Howdon
PartyCandidateVotes%±%
Labour John Harrison 2,89067.3+7.3
UKIP Stephen Borlos87120.3-9.9
Conservative David Griffith-Owen43310.1+4.5
National Front Bob Batten1022.4+2.4
Majority2,01947.0+17.2
Turnout 4,29652.8+25.2
Labour hold Swing +8.6

Killingworth

Killingworth
PartyCandidateVotes%±%
Labour Alison Waggott-Fairley2,94757.6+2.4
Conservative Karen Johnston1,39627.0+6.0
UKIP Brian Needham79415.4-8.4
Majority1,57830.6+9.2
Turnout 5,16461.9+28.5
Labour hold Swing -1.8

Longbenton

Longbenton
PartyCandidateVotes%±%
Labour Karen Clark2,97862.1-0.4
Conservative Robin Underwood76515.9+3.5
UKIP Carl Dunn73315.3-9.8
Green Steve Manchee3216.7+6.7
Majority2,21346.1+8.7
Turnout 4,79758.3+26.8
Labour hold Swing -2.0

Monkseaton North

Monkseaton North
PartyCandidateVotes%±%
Conservative Paul Mason2,27442.7+0.8
Labour William Samuel1,86535.0-0.7
UKIP Steve Symington4588.6-7.4
Green Richard Clarke4378.2+8.2
Liberal Democrats David Nisbet2905.4-1.0
Majority4097.7+1.5
Turnout 5,32475.8+33.6
Conservative hold Swing +0.8

Monkseaton South

Monkseaton South
PartyCandidateVotes%±%
Labour Davey Drummond2,28542.0-3.4
Conservative Sean Brockbank1,96536.1+0.1
UKIP Gary Legg82415.1-3.6
Green Peter White3676.7+6.7
Majority3205.9-3.5
Turnout 5,44171.2+28.4
Labour hold Swing -1.8

Northumberland

Northumberland
PartyCandidateVotes%±%
Labour Andy Newman1,80445.1+8.7
Liberal Democrats David Ord1,20130.0-7.3
UKIP Marcus Kitson68417.1-5.6
Conservative Miriam Smith3137.8+4.2
Majority60315.1+14.2
Turnout 4,00259.0+34.0
Labour gain from Liberal Democrats Swing +8.0

Preston

Preston
PartyCandidateVotes%±%
Labour Pamela Brooks-Osborne2,31548.4+5.1
Conservative David Sarin1,82238.1+1.6
UKIP Peter Martin64913.6-6.5
Majority49310.3+3.5
Turnout 4,78669.5+30.6
Labour gain from Conservative Swing +3.4

Riverside

Riverside
PartyCandidateVotes%±%
Labour Wendy Lott2,74163.3+4.5
UKIP Bob Sword89320.6-7.4
Conservative Maureen Jeffrey68715.9+5.8
Majority1,84842.7+11.9
Turnout 4,33151.6+22
Labour hold Swing +6.0

St. Mary's

St. Mary's
PartyCandidateVotes%±%
Conservative Ed Hodson3,20558.4-3.4
Labour Graham Siddle1,59629.1+9.5
UKIP William Jackson68512.5+1.2
Majority1,60929.3-12.8
Turnout 5,48679.3+37.2
Conservative hold Swing -6.5

Tynemouth

Tynemouth
PartyCandidateVotes%±%
Labour Karen Bolger2,88447.0+2.7
Conservative Jean McLaughlin2,59742.3-0.9
UKIP Henry Marshall66110.7-1.8
Majority2874.7+3.7
Turnout 6,14271.8+37.8
Labour gain from Conservative Swing +1.8

Valley

Valley
PartyCandidateVotes%±%
Labour Carole Burdis3,06159.7+3.1
Conservative Joseph Furness1,13322.1+7.0
UKIP Peter Bayliss93718.3-10.0
Majority1,92837.6+9.3
Turnout 5,13159.3+29.8
Labour hold Swing -2.1

Wallsend

Wallsend
PartyCandidateVotes%±%
Labour Matthew Thirlaway2,13848.1+10.5
Liberal Democrats Margaret Finlay1,38931.3-4.0
UKIP Mark Bickerton60413.6-4.5
Conservative Claire Griffith-Owen3127.0+3.5
Majority74916.9+14.6
Turnout 4,44357.2+25.9
Labour gain from Liberal Democrats Swing +7.3

Weetslade

Weetslade
PartyCandidateVotes%±%
Labour Muriel Green2,72753.7+5.3
Conservative Andrew Elliott1,31625.9+3.8
UKIP Irene Davidson1,03620.4-7.7
Majority1,41117.8+2.5
Turnout 5,07964.7+25.2
Labour hold Swing +0.8

Whitley Bay

Whitley Bay
PartyCandidateVotes%±%
Labour John O'Shea2,87156.9+4.7
Conservative Frank Austin1,66733.0+4.5
UKIP Dave Cory50910.1-2.6
Majority1,20423.9+1.2
Turnout 5,04768.2+27.5
Labour hold Swing +0.1
Preceded by
2014 North Tyneside Council election
North Tyneside local elections Succeeded by
2016 North Tyneside Metropolitan Borough Council election

Related Research Articles

<span class="mw-page-title-main">Metropolitan Borough of Wirral</span> Metropolitan borough in England

The Metropolitan Borough of Wirral is a metropolitan borough of Merseyside, in North West England. It has a population of 322,453 (2022), and encompasses 62 square miles (161 km2) of the northern part of the Wirral Peninsula. Major settlements include Birkenhead, Wallasey, Bebington, Heswall, Hoylake and West Kirby. Wirral is England's westernmost metropolitan borough, faced by the city of Liverpool to the northeast over the River Mersey.

<span class="mw-page-title-main">Stockport Metropolitan Borough Council</span> Local government body in England

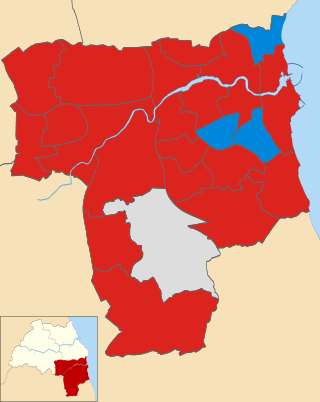
Stockport Metropolitan Borough Council (SMBC) is the local authority for the Metropolitan Borough of Stockport, Greater Manchester, England. The council is currently run by a Liberal Democrat minority administration. At the 2023 local elections, the Liberal Democrats gained two more seats, increasing their lead over the Labour Party to six seats, and retaining minority control. This lead is now five seats after one of the Liberal Democrats’ councillors resigned the whip, days after being re-elected. The Liberal Democrats currently have 29 seats, Labour 24, and Greens and the Edgeley Community Association each hold 3. There are 4 independents, three of whom are sponsored by the Heald Green Ratepayers (not formally a political party).

<span class="mw-page-title-main">2008 Solihull Metropolitan Borough Council election</span>

The 2008 Solihull Metropolitan Borough Council election took place on 1 May 2008 to elect members of Solihull Metropolitan Borough Council in the West Midlands, England. One third of the council was up for election and the Conservative Party gained overall control of the council from no overall control.

The 2002 South Tyneside Metropolitan Borough Council election took place on 2 May 2002 to elect members of South Tyneside Metropolitan Borough Council in Tyne and Wear, England. One third of the council was up for election and the Labour Party kept overall control of the council.

The 2003 South Tyneside Metropolitan Borough Council election took place on 1 May 2003 to elect members of South Tyneside Metropolitan Borough Council in Tyne and Wear, England. One third of the council was up for election and the Labour Party kept overall control of the council.

The 2004 South Tyneside Metropolitan Borough Council election took place on 10 June 2004 to elect members of South Tyneside Metropolitan Borough Council in Tyne and Wear, England. The whole council was up for election with boundary changes since the last election in 2003 reducing the number of seats by 6. The Labour Party stayed in overall control of the council.

The 2006 South Tyneside Metropolitan Borough Council election took place on 4 May 2006 to elect members of South Tyneside Metropolitan Borough Council in Tyne and Wear, England. One third of the council was up for election and the Labour Party stayed in overall control of the council.

<span class="mw-page-title-main">2010 Sunderland City Council election</span> Sunderland City Council election

The 2010 Sunderland Council election took place on 6 May 2010 to elect members of Sunderland Metropolitan Borough Council in Tyne and Wear, England. One third of the council was up for election and the Labour Party stayed in overall control of the council. The election took place on the same day as the 2010 General Election.

The 1999 Sandwell Metropolitan Borough Council election took place on 6 May 1999 to elect members of Sandwell Metropolitan Borough Council in the West Midlands, England. One third of the council was up for election and the Labour party stayed in overall control of the council.

<span class="mw-page-title-main">2011 Bolton Metropolitan Borough Council election</span> 2011 UK local government election

Elections to Bolton Metropolitan Borough Council were held on 5 May 2011, along with the 2011 United Kingdom Alternative Vote referendum. One third of the council was up for election, with each successful candidate to serve a four-year term of office, expiring in 2015.

<span class="mw-page-title-main">2011 Sunderland City Council election</span> 2011 UK local government election

The 2011 Sunderland Council election took place on 5 May 2011 to elect members of Sunderland Metropolitan Borough Council in Tyne and Wear, England. One third of the council was up for election and the Labour Party stayed in overall control of the council.

<span class="mw-page-title-main">2012 Bolton Metropolitan Borough Council election</span> 2012 UK local government election

Elections to Bolton Metropolitan Borough Council were held on 3 May 2012. One third of the council was up for election, with each successful candidate to serve a four-year term of office, expiring in 2016.

<span class="mw-page-title-main">2013 United Kingdom local elections</span>

The 2013 United Kingdom local elections took place on Thursday 2 May 2013. Elections were held in 35 English councils: all 27 non-metropolitan county councils and eight unitary authorities, and in one Welsh unitary authority. Direct mayoral elections took place in Doncaster and North Tyneside. These elections last took place on the 4 June 2009 at the same time as the 2009 European Parliament Elections, except for County Durham, Northumberland and the Anglesey where elections last took place in 2008.

Elections to North Tyneside Metropolitan Council took place on 22 May 2014. They coincided with other local elections happening in the UK that day, as well as the 2014 election to the European Parliament.

<span class="mw-page-title-main">2014 Calderdale Metropolitan Borough Council election</span> 2014 UK local government election

The 2014 Calderdale Metropolitan Borough Council election took place on 22 May 2014 to elect members of Calderdale Metropolitan Borough Council in England. This was on the same day as local elections across the United Kingdom and a European election. One councillor was elected in each of the 17 wards for a four-year term. There are three councillors representing each ward elected on a staggered basis so one third of the councillor seats were up for re-election. The seats had previously been contested in 2010 which was held in conjunction with a general election. The turnout was significantly lower in 2014 than in 2010 which is not unusual when comparing local elections that coincide with general elections to ones that do not. Prior to the election Labour was the largest party in the council with 21 out of 51 seats, 5 seats short of an overall majority. After the election there was no overall control of the council. Labour had 25 seats, only one short of a majority and so Labour continued to operate a minority administration.

<span class="mw-page-title-main">2008 Havant Borough Council election</span>

The 2008 Havant Borough Council election took place on 1 May 2008 to elect members of Havant Borough Council in Hampshire, England. One third of the council was up for election and the Conservative Party stayed in overall control of the council.

<span class="mw-page-title-main">2011 St Helens Metropolitan Borough Council election</span> 2011 local election in England

The 2011 St Helens Metropolitan Borough Council election took place on 5 May 2011 to elect members of St Helens Metropolitan Borough Council in Merseyside, England. One third of the council was up for election and the Labour Party stayed in overall control of the council.

<span class="mw-page-title-main">2014 St Helens Metropolitan Borough Council election</span> 2014 UK local government election

The 2014 St Helens Metropolitan Borough Council election took place on 22 May 2014 to elect members of St Helens Metropolitan Borough Council in Merseyside, England. One third of the council was up for election and the Labour Party stayed in overall control of the council.

The 2016 North Tyneside Metropolitan Borough Council election took place on 5 May 2016 to elect members of North Tyneside Metropolitan Borough Council in England. This was on the same day as other local elections.

<span class="mw-page-title-main">2022 North Tyneside Metropolitan Borough Council election</span> 2022 local election in North Tyneside

The 2022 North Tyneside Metropolitan Borough Council election took place on 5 May 2022. One third of councillors—20 out of 60—on North Tyneside Metropolitan Borough Council were elected. The election took place alongside other local elections across the United Kingdom.

References

  1. "2015 local election results". North Tyneside Metropolitan Borough Council . Retrieved 8 August 2016.
  2. "2014 local election results". North Tyneside Metropolitan Borough Council . Retrieved 8 August 2016.