2015 South Oxfordshire District Council election

Last updated

2015 South Oxfordshire District Council election
  2011 7 May 2015 2019  
 
Party Conservative Labour Liberal Democrats
Popular vote65,86121,29617,865
Percentage50.65%16.38%13.74%

 
Party Henley Residents Independent
Popular vote3,3704,863
Percentage2.59%3.74%

South Oxfordshire UK ward map 2015 results.png
Wards of South Oxfordshire District Council

The 2015 South Oxfordshire District Council election was held on 7 May 2015 to elect members of South Oxfordshire District Council in England. This was on the same day as other local elections. [1]

Contents

Elections were held for all seats on the council. After the 2011 South Oxfordshire District Council election the Boundary Commission for England had revised South Oxfordshire's district ward boundaries and reduced the number of seats from 48 to 36. the 2015 elections were the first to be held for the new revised wards.

A total of 96,644 votes were cast at polling stations and 13,527 postal votes were received. This amounted to a 66.5% turnout. [2]

The Conservative Party won 33 of the 36 new seats. The Labour Party, Liberal Democrats and Henley Residents Group each won one seat. No other party or independent candidate won any seats. The Conservative Party kept overall control of the council, [3] with its majority increased to 30. [4]

Summary of results

South Oxfordshire District Council elections result 2015 [4]
PartySeatsGainsLossesNet gain/lossSeats %Votes %Votes+/−
  Conservative 3300091.6750.6565,861-
  Labour 103-32.7816.3821,296+
  Liberal Democrats 103-32.7813.7417,865-
  Henley Residents 102-22.782.593,370-
  UKIP 000006.488,423+
  Green 000006.438,361+
  Independent 005-503.744,863-

The Conservative Party's share of votes fell from 53.53% in 2011 to 50.65% in 2015. However, as a result of the new boundaries the Conservatives still won 33 seats in 2015, [4] the same number as in 2011. And as the Boundary Commission had reduced the number of seats, this represents an increase in the share of seats from almost 69% in 2011 to nearly 92% in 2015.

The Labour Party increased its share of votes from 14.92% in 2011 to 16.70% in 2015, overtaking the Liberal Democrats as the party with the second largest number of votes in the district. But as a result of the new ward boundaries and reduced number of wards the number of Labour members on the district council was reduced from four to one. [4]

The Liberal Democrats' share of votes fell from 15.89% in 2011 to 11.93% in 2015. Combined with the new ward boundaries and reduced number of wards, Liberal Democrat members on the district council were reduced from four to one. [4]

In 2011 five independent candidates were elected to the district council. In 2015 four of them did not seek re-election. One, Mark Gray, was a candidate again in 2015 but was not re-elected.

The boundary revision reduced Henley-on-Thames from two wards which each elected two members in 2011, to one ward which elected three members in 2015. Henley Residents Group's share of votes in Henley fell from an average of 37.17% across the two wards in 2011 to 20.43% in the one new ward in 2015. These factors combined to reduce the number of HRG members on the district council from three to one. [4]

Pie charts showing share of total votes (left) and number of seats won (right) SODC 2015 PieCharts.png
Pie charts showing share of total votes (left) and number of seats won (right)

In 2011 there was one UK Independence Party candidate, who contested a ward in Didcot. He won 5.09% of the votes in that ward. In 2015 there were 13 UKIP candidates in eight wards. They won an average of 10.91% of votes in the wards that they contested, and 6.48% of the total votes cast in the district, but no seats. [4]

In 2011 there were Green Party candidates in four of the district's 29 wards. They won an average of 16.64% of votes in the wards that they contested, and 3.43% of total votes cast in South Oxfordshire District. In 2015 there were Green Party candidates in 13 of the district's 21 new wards, including three Green candidates in the one new Henley ward. They won an average of 10.21% of votes in the wards that they contested, and 6.43% of total votes cast in the district, but no seats. [4]

The 2015 election increased the Conservative Party majority on the district council from 18 to 30. Opposition was reduced from 15 in 2011 to three in 2015. [4]

Ward results

Benson and Crowmarsh

Benson and Crowmarsh 2015 [5]
PartyCandidateVotes%±%
Conservative Felix Bloomfield2,24729.22
Conservative Richard Pullen1,77023.01
Liberal Democrats Sue Cooper1,45718.94
Liberal Democrats George Francis Daniel Levy6188.04
Green Andrea Jane Powell6067.88
Labour Jim Merritt5136.67
Labour Adam Wood4806.24
Turnout
Majority313
Conservative win (new seat)

Berinsfield

Berinsfield 2015 [6]
PartyCandidateVotes%±%
Conservative John Cotton96851.38
Labour Maggie Winters40021.23
Green Mark Stevenson37019.64
Liberal Democrats Jane Mary Jackson1467.75
Turnout
Majority568
Conservative win (new seat)

Chalgrove

Chalgrove 2015 [7]
PartyCandidateVotes%±%
Liberal Democrats David Graham Turner1,06054.03
Conservative Ann Pritchard76939.19
Labour Simon Stone1336.78
Turnout
Majority291
Liberal Democrats win (new seat)

Chinnor

Chinnor 2015 [8]
PartyCandidateVotes%±%
Conservative Lynn Lloyd3,16339.81
Conservative Ian White2,78934.66
Liberal Democrats Liz Barker82710.28
Labour John Henry Cooper7028.72
Liberal Democrats Pete Barker5657.02
Turnout
Majority1,962
Conservative win (new seat)

Cholsey

Cholsey 2015 [9]
PartyCandidateVotes%±%
Conservative Pat Dawe2,15124.35
Conservative Jane Murphy1,74619.77
Independent Mark Stuart Gray1,32314.98
Liberal Democrats Adrian Lee Cull8109.17
Labour Ginnie Herbert6837.73
Green Sam Casey-Rerhaye5676.42
UKIP Steve Beatty5596.33
Labour Barbara Tompsett5396.10
UKIP Bob Nielsen4555.15
Turnout
Majority423
Conservative win (new seat)

Didcot North East

Didcot North East 2015 [10]
PartyCandidateVotes%±%
Conservative Tony Harbour1,72314.77
Conservative Steve Connel1,64314.08
Conservative Bill Service1,59113.64
Independent Neville Frank Harris1,44112.35
Labour Nick Hards1,0278.80
Labour Alison Joy Lane9187.87
Labour James Joseph Reeve6995.99
Liberal Democrats Les Hopper6565.62
UKIP Laura Jade Bayliss6285.38
UKIP Toby Gordon Pilling4964.25
Liberal Democrats Tony Worgan4744.06
UKIP David Sidney Weaver3703.17
Turnout
Majority150
Conservative win (new seat)

Didcot South

Didcot South 2015 [11]
PartyCandidateVotes%±%
Conservative Anthony Dearlove1,49812.87
Conservative Anthony Nash1,48012.72
Labour Margaret L Davies1,43612.34
Conservative Charlie Robertson1,37111.78
Labour Eleanor Hards1,30912.34
Labour Bernard Douglas Cooper1,29512.34
UKIP Peter Ernest Elliot9378.05
UKIP Waine Anthony Wilkins8367.18
Liberal Democrats David Rouane7566.50
Liberal Democrats James Robert Loder7206.19
Turnout
Majority65

Didcot West

Didcot West 2015 [11]
PartyCandidateVotes%±%
Conservative Alan Thompson1,39024.75
Conservative Margaret Turner1,29923.13
Labour Denise Ann Macdonald94116.75
Labour Pamela Ann Siggers82314.65
UKIP David Roberts60410.75
Liberal Democrats Andrew Peter Jones5609.97
Turnout
Majority358
Conservative win (new seat)

Forest Hill and Holton

Forest Hill and Holton 2015 [12]
PartyCandidateVotes%±%
Conservative John Walsh90244.00
Liberal Democrats Anne Purse79338.68
Labour Paddy Bullard35517.32
Turnout
Majority109
Conservative win (new seat)

Garsington and Horspath

Garsington and Horspath 2015 [13]
PartyCandidateVotes%±%
Conservative Elizabeth Gillespie1,21258.98
Labour Jacob Robert Chapman43321.07
Green Robin Francis Bennett22611.00
Liberal Democrats David Stanley Mancey1848.95
Turnout
Majority779
Conservative win (new seat)

Goring

Goring 2015 [14]
PartyCandidateVotes%±%
Conservative Kevin Bulmer1,26456.73
Liberal Democrats Caroline Shirley Wardle40318.09
Labour Fran Wright31614.18
Green James Welch Norman24511.00
Turnout
Majority861
Conservative win (new seat)

Haseley Brook

Haseley Brook 2015 [15]
PartyCandidateVotes%±%
Conservative Stephen Harrod1,53766.80
Liberal Democrats Sarah Elizabeth Gray386
Labour Emma Lara Maclean37816.43
Turnout
Majority1,151
Conservative win (new seat)

Henley-on-Thames

Henley-on-Thames 2015 [16]
PartyCandidateVotes%±%
Conservative Lorraine Hillier2,44514.82
Conservative Joan Bland2,23413.54
Henley Residents Stefan John Gawrysiak2,13912.97
Conservative William Arthur Henry Hall2,05012.43
Henley Residents Simon Charles Narracott1,2317.46
Independent Elizabeth Hodgkin1,1757.12
UKIP Ken Arlett9395.69
Independent Jeni Wood7304.42
Green Elisabeth Marjorie Geake6714.07
Green Ian Petrie5953.61
Liberal Democrats Neill James Robert Hendry5023.04
Labour Cornelius Kavanagh4993.02
UKIP Chris Jones4672.83
Liberal Democrats David John Thomas4512.73
Green Richard Michael Rule3702.24
Turnout
Majority89

Kidmore End and Whitchurch

Kidmore End and Whitchurch 2015 [17]
PartyCandidateVotes%±%
Conservative Rob Simister1,07348.60
Green Peter Dragonetti55124.95
Labour Amanda Holland2059.28
Independent Keith John Brooks1948.79
Liberal Democrats Harry Butterworth1858.38
Turnout
Majority868
Conservative win (new seat)

Sandford and the Wittenhams

Sandford and the Wittenhams 2015 [18]
PartyCandidateVotes%±%
Conservative Jon Woodley-Shead1,03047.14
Liberal Democrats Simon Geoffrey Davenport Thompson44520.37
Labour Will Atkinson36716.80
Green David John Scott34315.70
Turnout
Majority585
Conservative win (new seat)

Sonning Common

Sonning Common 2015 [19]
PartyCandidateVotes%±%
Conservative Paul Harrison2,44432.98
Conservative Martin Akehurst2,43232.82
Labour David George Winchester6518.78
Green Alison Jean Smart5197.00
Labour Chris Wright5106.88
Liberal Democrats Andy Davies4315.82
Liberal Democrats Jill Elizabeth Davies4245.72
Turnout
Majority585
Conservative win (new seat)

Thame

Thame 2015 [20]
PartyCandidateVotes%±%
Conservative David Dodds3,04118.37
Conservative Nigel Champken-Woods2,70416.34
Conservative Jeanette Matelot Green2,48715.03
Labour Mary Honora Stiles1,5959.64
Liberal Democrats David William Bretherton1,4668.86
Liberal Democrats Susan Bennett1,1847.15
UKIP Peter William Butler1,1296.82
Labour Tristram Maclean1,1076.69
Green Robert Guy Hughes9235.58
Liberal Democrats David Arthur Laver9155.53
Turnout
Majority892
Conservative win (new seat)

Wallingford

Wallingford 2015 [21]
PartyCandidateVotes%±%
Conservative Imran Lokhon1,63924.30
Conservative Elaine Hornsby1,60823.84
Green Sue Roberts1,13516.83
Labour Liz Neighbour87913.03
Labour George William Kneeshaw74511.05
UKIP Lee Mark Upcraft73910.96
Turnout
Majority473
Conservative win (new seat)

Watlington

Watlington 2015 [22]
PartyCandidateVotes%±%
Conservative Anna Badcock1,46265.97
Green Tom Bindoff35215.88
Labour Tony Winters2169.75
Liberal Democrats Catherine Mary Hughes1868.39
Turnout
Majority1,110
Conservative win (new seat)

Wheatley

Wheatley 2015 [23]
PartyCandidateVotes%±%
Conservative Toby Newman1,00345.82
Labour Andrew John Walkey50823.21
Liberal Democrats Roger Thomas Bell41418.91
UKIP Alex Ashmore26412.06
Turnout
Majority595
Conservative win (new seat)

Woodcote and Rotherfield

Woodcote and Rotherfield 2015 [24]
PartyCandidateVotes%±%
Conservative Charles Bailey2,98637.02
Conservative David Nimmo-Smith2,71033.60
Green Andrew James Wallis88811.01
Liberal Democrats James David Cooper84710.50
Labour Veronica Treacher6347.86
Turnout
Majority1,822
Conservative win (new seat)

Related Research Articles

<span class="mw-page-title-main">South Oxfordshire</span> Non-metropolitan district in England

South Oxfordshire is a local government district in the ceremonial county of Oxfordshire, England. Its council is temporarily based outside the district at Abingdon-on-Thames pending a planned move to Didcot, the district's largest town. The areas located south of the River Thames are within the historic county of Berkshire.

<span class="mw-page-title-main">Oxford East (UK Parliament constituency)</span> Parliamentary constituency in the United Kingdom since 1983

Oxford East is a constituency represented in the House of Commons of the UK Parliament by Anneliese Dodds of the Labour Party, who also serves as party chair.

<span class="mw-page-title-main">Oxford West and Abingdon (UK Parliament constituency)</span> Parliamentary constituency in the United Kingdom since 1983

Oxford West and Abingdon is a constituency represented in the House of Commons of the UK Parliament since 2017 by Layla Moran, a Liberal Democrat.

<span class="mw-page-title-main">Newbury (UK Parliament constituency)</span> Parliamentary constituency in the United Kingdom since 1885

Newbury is a constituency represented in the House of Commons of the UK Parliament from 2019 by Laura Farris, a Conservative. It was created by the Redistribution of Seats Act 1885 and has been in continual existence since then.

<span class="mw-page-title-main">Wantage (UK Parliament constituency)</span> Constituency in Oxfordshire, England

Wantage is a constituency in Oxfordshire represented in the House of Commons of the Parliament of the United Kingdom by Conservative MP David Johnston.

<span class="mw-page-title-main">Henley (UK Parliament constituency)</span> Parliamentary constituency in the United Kingdom, 1885 onwards

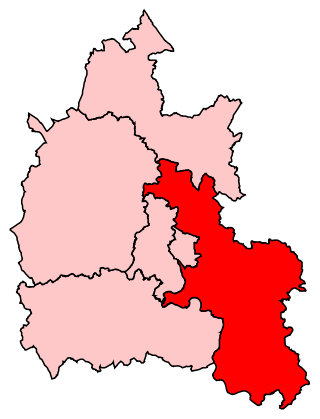
Henley is a constituency in Oxfordshire represented in the House of Commons of the UK Parliament since 2008 by John Howell, a Member of Parliament from the Conservative Party.

<span class="mw-page-title-main">Banbury (UK Parliament constituency)</span> Parliamentary constituency in the United Kingdom, 1801 onwards

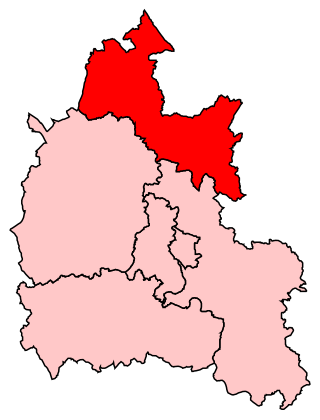
Banbury is a constituency in Oxfordshire created in 1553 and represented in the House of Commons of the UK Parliament since 2015 by Victoria Prentis of the Conservative Party. She currently serves as Attorney General for England and Wales.

<span class="mw-page-title-main">Witney (UK Parliament constituency)</span> Parliamentary constituency in the United Kingdom since 1983

Witney is a county constituency in Oxfordshire represented in the House of Commons of the Parliament of the United Kingdom since 2016 by Robert Courts of the Conservative Party. It elects one Member of Parliament by the first-past-the-post system of election, and was created for the 1983 general election.

South Oxfordshire District Council, a non-metropolitan district council in Oxfordshire, England is elected every four years.

The 2003 South Oxfordshire District Council election took place on 1 May 2003 to elect members of South Oxfordshire District Council, a non-metropolitan district council in Oxfordshire, England. This was part of the wider 2003 UK local elections. The whole council was up for election with boundary changes since the last election in 1999 reducing the number of seats by 2. The Conservative Party gained overall control of the council from no overall control.

<span class="mw-page-title-main">2015 Cotswold District Council election</span> 2015 UK local government election

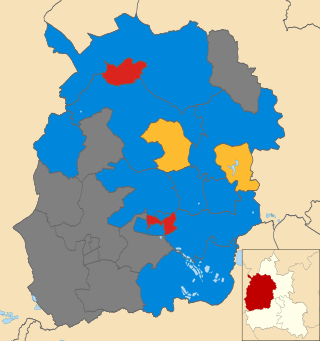
The 2015 Cotswold District Council election took place on 7 May 2015 to elect all members of Cotswold District Council in England. The whole council was up for election. Turnout was substantially up across the district due to the election being held on the same day as the general election and other local elections in England.

<span class="mw-page-title-main">Vale of White Horse District Council</span>

Vale of White Horse District Council is the local authority for the Vale of White Horse, a non-metropolitan district in the south-west of Oxfordshire, England, that was created on 1 April 1974.

<span class="mw-page-title-main">2015 South Kesteven District Council election</span>

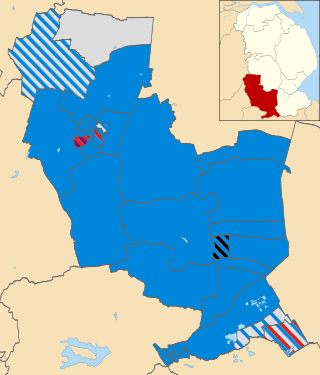
The 2015 South Kesteven District Council election took place on 7 May 2015 to elect members of South Kesteven District Council in Lincolnshire, England. The whole council was up for election after boundary changes reduced the number of seats by two. The Conservative party stayed in overall control of the council.

<span class="mw-page-title-main">2015 East Dorset District Council election</span>

The 2015 East Dorset District Council election took place on 7 May 2015 in order to elect members of the East Dorset District Council in Dorset, England. The whole council was up for election after boundary changes reduced the number of seats by seven. The Conservative Party stayed in overall control of the council.

<span class="mw-page-title-main">2007 West Oxfordshire District Council election</span>

The 2007 West Oxfordshire District Council election took place on 3 May 2007 to elect members of West Oxfordshire District Council in Oxfordshire, England. One third of the council was up for election and the Conservative Party stayed in overall control of the council.

<span class="mw-page-title-main">2008 West Oxfordshire District Council election</span>

The 2008 West Oxfordshire District Council election took place on 1 May 2008 to elect members of West Oxfordshire District Council in Oxfordshire, England. One third of the council was up for election and the Conservative Party stayed in overall control of the council.

<span class="mw-page-title-main">2012 West Oxfordshire District Council election</span>

The 2012 West Oxfordshire District Council election took place on 3 May 2012 to elect members of West Oxfordshire District Council in Oxfordshire, England. One third of the council was up for election and the Conservative Party stayed in overall control of the council.

<span class="mw-page-title-main">2016 Exeter City Council election</span>

The 2016 Exeter City Council election took place on 5 May 2016, to elect members of Exeter City Council in England. Following boundary changes, the entire council was up for election, and all 13 wards were contested, each electing three councillors. The election was held concurrently with other local elections held in England on the 5 May.

<span class="mw-page-title-main">2011 South Oxfordshire District Council election</span>

The 2011 South Oxfordshire District Council election was held on 5 May 2011 to elect members of South Oxfordshire District Council in England. This was on the same day as other local elections.

References

  1. "Have you voted yet?". Henley Standard . 7 May 2015. Retrieved 29 May 2018.
  2. "Election statistics 2015". South Oxfordshire District Council. 2015. Retrieved 29 May 2018.
  3. "Tories triumph across the board". Henley Standard . 15 May 2015. Retrieved 29 May 2018.
  4. 1 2 3 4 5 6 7 8 9 "Election Results by Political Party". South Oxfordshire District Council. 2015. Retrieved 29 May 2018.
  5. "Election Results for Benson and Crowmarsh". South Oxfordshire District Council. 2015. Retrieved 29 May 2018.
  6. "Election Results for Berinsfield". South Oxfordshire District Council. 2015. Retrieved 29 May 2018.
  7. "Election Results for Chalgrove". South Oxfordshire District Council. 2015. Retrieved 29 May 2018.
  8. "Election Results for Chinnor". South Oxfordshire District Council. 2015. Retrieved 29 May 2018.
  9. "Election Results for Cholsey". South Oxfordshire District Council. 2015. Retrieved 29 May 2018.
  10. "Election Results for Didcot North East". South Oxfordshire District Council. 2015. Retrieved 29 May 2018.
  11. 1 2 "Election Results for Didcot South". South Oxfordshire District Council. 2015. Retrieved 29 May 2018.
  12. "Election Results for Forest Hill and Holton". South Oxfordshire District Council. 2015. Retrieved 29 May 2018.
  13. "Election Results for Garsington and Horspath". South Oxfordshire District Council. 2015. Retrieved 29 May 2018.
  14. "Election Results for Goring". South Oxfordshire District Council. 2015. Retrieved 29 May 2018.
  15. "Election Results for Haseley Brook". South Oxfordshire District Council. 2015. Retrieved 29 May 2018.
  16. "Election Results for Henley-on-Thames". South Oxfordshire District Council. 2015. Retrieved 29 May 2018.
  17. "Election Results for Kidmore End and Whitchurch". South Oxfordshire District Council. 2015. Retrieved 29 May 2018.
  18. "Election Results for Sandford and the Wittenhams". South Oxfordshire District Council. 2015. Retrieved 29 May 2018.
  19. "Election Results for Sonning Common". South Oxfordshire District Council. 2015. Retrieved 29 May 2018.
  20. "Election Results for Thame". South Oxfordshire District Council. 2015. Retrieved 29 May 2018.
  21. "Election Results for Wallingford". South Oxfordshire District Council. 2015. Retrieved 29 May 2018.
  22. "Election Results for Watlington". South Oxfordshire District Council. 2015. Retrieved 29 May 2018.
  23. "Election Results for Wheatley". South Oxfordshire District Council. 2015. Retrieved 29 May 2018.
  24. "Election Results for Woodcote and Rotherfield". South Oxfordshire District Council. 2015. Retrieved 29 May 2018.