2015 South Gloucestershire Council election

Last updated

2015 South Gloucestershire Council election
  2011 7 May 2015 2019  

All 70 seats on the South Gloucestershire Council
36 seats needed for a majority
 First partySecond party
 
Con
LD
Party Conservative Liberal Democrats
Last election34 seats, 42.0%21 seats, 25.5%
Seats won4016
Seat changeIncrease2.svg 6Decrease2.svg 5
Popular vote62,01932,725
Percentage41.5%21.9%
SwingDecrease2.svg 0.5ppDecrease2.svg 3.6pp

 Third partyFourth party
 
Lab
UKIP
Party Labour UKIP
Last election15 seats, 29.8%0 seats, 0.6%
Seats won140
Seat changeDecrease2.svg 1Steady2.svg 0
Popular vote35,91415,245
Percentage24.0%10.2
SwingDecrease2.svg 5.8ppIncrease2.svg 9.6pp

SGlos local election map 2015.png
Map showing the results of the election in each ward. Colours denote the winning party as shown in the main table of results.

Council control before election

NOC

Council control after election

Conservative

The 2015 South Gloucestershire Council election took place on 7 May 2015 to elect members of South Gloucestershire Council in England as part of nationwide local elections. [1]

Contents

For the first time since the creation of South Gloucestershire, the Conservatives took an overall majority with 40 of the 70 seats. [2] This was the second one-party majority in the history of South Gloucestershire, after the Lib Dems' 1999-2003 control.

Election result

South Gloucestershire Council election, 2015 [2]
PartySeatsGainsLossesNet gain/lossSeats %Votes %Votes+/−
  Conservative 4060Increase2.svg 657.141.562,019Decrease2.svg 0.5
  Liberal Democrats 1605Decrease2.svg 522.821.932,725Decrease2.svg 3.6
  Labour 1401Decrease2.svg 120.024.035,914Decrease2.svg 5.8
  UKIP 000±00.010.215,245Increase2.svg 9.6
  Independent 000±00.01.11,601Decrease2.svg 0.4
  Green 000±00.01.01,568Increase2.svg 0.1
  TUSC 000±00.00.2372

Ward results

Almondsbury (1 seats) [2]
PartyCandidateVotes%±%
Conservative Keith Burchell142559.4-8.3
Liberal Democrats Andrew Lewis Charles Tubb64827.0+9.0
UKIP Caroline Sullivan32413.5
Conservative hold Swing
Bitton (1 seats) [2]
PartyCandidateVotes%±%
Conservative Erica Williams114455.7+10.0
Labour John William Graham59228.8+8.8
Liberal Democrats Issabell Alyce Scudamore Chitson31915.5-18.7
Conservative hold Swing
Boyd Valley (2 seats) [2]
PartyCandidateVotes%±%
Conservative Steve Reade217525.6+4.0
Conservative Ben Stokes212925.1+5.0
Liberal Democrats Karen Margaret Wilkinson143816.9+0.6
Liberal Democrats Christine Jean Moore140916.6+0.5
Labour Nigel Goldsmith7438.7+0.7
Labour Roger Frederick Jahans-price6007.1+0.8
Conservative hold Swing
Bradley Stoke Central and Stoke Lodge (2 seats) [2]
PartyCandidateVotes%±%
Conservative Brian Hopkinson183826.3+0.9
Conservative Sarah Lynn Pomfret145220.8-3.0
Labour Anne Fiona Addison102214.6-0.3
UKIP Stephen Barr71110.2
Liberal Democrats Sarah Elizabeth Drake6248.9-0.4
UKIP Natasha Thwaites5417.8
Liberal Democrats Jon Williams4596.6-0.4
Independent Rebecca Genevieve Strong3324.8-2.6
Conservative hold Swing
Bradley Stoke North (1 seats) [2]
PartyCandidateVotes%±%
Conservative Paul Hardwick83241.4-2.2
UKIP Ben Walker47923.8
Labour Philip Michael Edwards45522.6-0.9
Liberal Democrats Dawn Jean Clode24312.1-20.7
Conservative hold Swing
Bradley Stoke South (2 seats) [2]
PartyCandidateVotes%±%
Conservative John Ashe191223.5-1.3
Conservative Roger Avenin179922.1-1.9
Labour David Michael Addison112413.8-0.6
Labour Anthony Harris Blake86610.7-0.7
UKIP Tom Crawley7969.8
UKIP Derrick Powell6417.9
Liberal Democrats Andrew Terence White5847.2-5.8
Liberal Democrats Christine Joan Willmore4085.0-7.2
Conservative hold Swing
Charfield (1 seats) [2]
PartyCandidateVotes%±%
Liberal Democrats John O`neill142660.7+5.6
Conservative John Dudley Buxton92539.3+5.3
Liberal Democrats hold Swing
Chipping Sodbury (2 seats) [2]
PartyCandidateVotes%±%
Liberal Democrats Linda Ann Boon186224.1-3.3
Conservative Rob Creer173622.5+2.1
Conservative Callum Jake Warren163021.1+2.9
Liberal Democrats Adrian Samuel Rush161420.9-3.5
Labour Kathleen Langley4485.8+1.1
Labour David Michael Channon4295.6+1.3
Liberal Democrats hold Swing
Conservative gain from Liberal Democrats Swing
Cotswold Edge (1 seats) [2]
PartyCandidateVotes%±%
Liberal Democrats Sue Hope107750.4-2.2
Conservative Martyn John Radnedge94244.1+2.0
Labour Ruth Mary Jahans-price1195.6-10.6
Liberal Democrats hold Swing
Dodington (2 seats) [2]
PartyCandidateVotes%±%
Liberal Democrats Tony Davis159225.0-7.5
Liberal Democrats Gloria Elsie Stephen137521.6-10.5
UKIP Russ Martin92014.4
Conservative Phil Jones87913.8+2.8
Conservative Jon Shaw73411.5+1.1
Labour Ann Fletcher4987.8+0.7
Labour David Ward3715.8+1.1
Liberal Democrats hold Swing
Downend (3 seats) [2]
PartyCandidateVotes%±%
Conservative Janet Biggin348819.1-0.5
Conservative Jon Hunt342118.7-0.3
Conservative Katherine Morris294516.1-1.0
Labour Julie Mary Snelling212611.6+0.5
Labour Bill Bowrey208411.4+1.2
Labour Wendy Sheila Bowrey204411.2+1.5
Liberal Democrats Howard John Alan Gawler7944.3-0.7
Liberal Democrats Anthony Richard Wallis7183.9-0.5
Liberal Democrats Paul Aidan Hulbert6783.7-0.2
Conservative hold Swing
Emersons Green (3 seats) [2]
PartyCandidateVotes%±%
Conservative Rachael Hunt340319.4-0.5
Conservative Colin Hunt329918.8-0.1
Conservative Dave Kearns291316.6-1.4
Labour Caroline Elizabeth Johnson181710.3-0.8
Labour Martin Neil Baker16559.4-0.4
Labour Gordon Richards15348.7-1.0
UKIP Matt Pitts11276.4
Liberal Democrats Andrew Paul Riches7464.2-1.5
Liberal Democrats Teresa Constance Lawrance5553.2-1.0
Liberal Democrats Alan Sidney Lawrance5353.0-1.1
Conservative hold Swing
Filton (3 seats) [2]
PartyCandidateVotes%±%
Labour Roger Malcolm Hutchinson167511.7-2.2
Labour Adam Paul Monk160811.2-2.5
Labour Ian Keith Mark Scott154610.8-2.7
Conservative Maria Silveira143610.0-3.0
Conservative John Tucker13399.3-3.3
Conservative Benjamin Randles13089.1-3.5
UKIP Keith Briffett12228.5
UKIP Alan Tink9976.9
UKIP David Crowley8926.2
Green Kyrie Tereza Roberts6824.7-0.3
Green Lance Jon Finney6774.7
Liberal Democrats Helen Margaret Harrison4313.0±0.0
Liberal Democrats Mary Katherine Perks3212.2-0.8
Liberal Democrats Marc Daniel Scawen2391.7-0.7
Labour hold Swing
Labour hold Swing
Labour hold Swing
Frampton Cotterell (2 seats) [2]
PartyCandidateVotes%±%
Liberal Democrats Dave Hockey209025.1-2.8
Liberal Democrats Pat Hockey185222.2-3.1
Conservative George Georgiou167820.1+2.6
Conservative Matt Wells157218.9+2.6
Labour Susan Mary Keel6087.3+0.5
Labour Terry Trollope5336.4-0.2
Liberal Democrats hold Swing
Frenchay and Stoke Park (2 seats) [2]
PartyCandidateVotes%±%
Conservative Trevor Jones154526.2-3.0
Conservative Bob Pullin131222.3-6.2
Labour David Baksa86214.6-0.7
Labour Thomas Michael Renhard78313.3-1.3
Liberal Democrats Hilary Kitchen5449.2-0.4
UKIP James Fraser4387.4
Liberal Democrats Tristan Adam Sutton Clark4107.0±0.0
Conservative hold Swing
Hanham (3 seats) [2]
PartyCandidateVotes%±%
Conservative June Patricia Bamford293716.8-3.0
Conservative John Goddard291316.7-3.6
Conservative Heather Goddard282216.1-2.9
Labour Gerry Mcallister185510.6-2.1
Labour Carl James Lander177710.2-1.7
Labour Mike Newman16939.7-1.3
UKIP Paul Harsant12467.1
UKIP Granville Brynley John Jenkins11236.4
Liberal Democrats Howard Joseph Patrick Finnegan3822.2-0.8
Liberal Democrats Vanessa Helen Scawen3742.1+0.3
Liberal Democrats Marilyn Clare Palmer3672.1+0.4
Conservative hold Swing
Kings Chase (3 seats) [2]
PartyCandidateVotes%±%
Labour April Janet Lilian Clare Begley208316.0-1.3
Labour Martin Philip Farmer187814.4-2.8
Labour Kim Jeremy Paul Scudamore184414.1-2.4
Conservative Bernadette Lake163912.6-1.3
Conservative Dave Lake158612.1-1.5
Conservative Kris Murphy151611.6-1.8
UKIP Peter Clampitt-dix145211.1
Liberal Democrats Joan Bates Reeves3963.0-0.2
Liberal Democrats Colin Peter Fender2812.2-0.5
Liberal Democrats Christine Dianne Thomas2642.0-0.2
TUSC Jack Cran1150.9
Labour hold Swing
Labour hold Swing
Labour hold Swing
Ladden Brook (1 seats) [2]
PartyCandidateVotes%±%
Conservative Marian Joy Lewis113248.0+24.3
Liberal Democrats Duncan Stuart Goodland97441.3-12.9
Labour Robert John Lomas25310.7-11.3
Conservative gain from Liberal Democrats Swing
Longwell Green (2 seats) [2]
PartyCandidateVotes%±%
Conservative Christine Price240531.1-2.4
Conservative Toby Savage174522.6-6.4
Labour Tim Crook113614.7+1.3
Labour Helen Tina Farmer100113.0+0.1
UKIP Carole Annette Hunt88011.4
Liberal Democrats Martin William Monk3184.1-1.7
Liberal Democrats Guy William Rawlinson2433.1-2.1
Conservative hold Swing
Oldland Common (2 seats) [2]
PartyCandidateVotes%±%
Conservative Paul Hughes173922.8+7.1
Conservative Samuel Bromiley159520.9+6.0
Labour Roger William Coales125016.4+0.5
Labour Pat Apps117915.5+0.1
Liberal Democrats Karen Jane Ross105913.9-6.5
Liberal Democrats Andrew James Thomas79210.4-7.5
Conservative gain from Liberal Democrats Swing
Parkwall (2 seats) [2]
PartyCandidateVotes%±%
Conservative Nick Barrett193825.8+1.9
Conservative Kaye Barrett184324.5+1.0
Labour Ron Hardie167622.3+1.0
Labour Rikki Michael Teml125916.7+4.2
Liberal Democrats Grace Miriam Boddy4075.4+0.3
Liberal Democrats Lois Barbara Nicks3975.3+0.5
Conservative hold Swing
Patchway (3 seats) [2]
PartyCandidateVotes%±%
Labour Eve Orpen157512.9-2.4
Labour Keith Walker145311.9-2.7
Conservative Kenneth Richard Dando143611.7+1.5
Labour Sam William Scott136511.2-2.8
Conservative Patsy Coleman126810.4+0.3
Conservative Rosaleen Geraldine Messenger123210.1+1.1
UKIP Jon Butler11629.5
UKIP Joe Jackson8406.9
UKIP Ed Rose6795.6
Liberal Democrats Alan John Garland5154.2-4.1
Liberal Democrats Jane Alison Allinson3923.2-4.4
Liberal Democrats Peter Eaton Heaney3172.6-4.8
Labour hold Swing
Labour hold Swing
Conservative gain from Labour Swing
Pilning and Severn Beach (1 seats) [2]
PartyCandidateVotes%±%
Conservative Robert Griffin130071.3+25.3
Liberal Democrats John Harris52328.7-10.8
Conservative hold Swing
Rodway (3 seats) [2]
PartyCandidateVotes%±%
Conservative John Sullivan248916.4+1.2
Labour Michael Richard Bell244416.1±0.0
Conservative Judy Adams239215.7+0.6
Conservative Rich Nichols231415.2+1.6
Labour Sandie Davis218114.4-0.4
Labour Eric Hargrave207613.7-0.2
Liberal Democrats John Paul Ford5433.6+1.2
Liberal Democrats Wulstan John Newton Perks4192.8+0.6
Liberal Democrats Peter Laurence Tyzack3342.2+0.1
Conservative hold Swing
Labour hold Swing
Conservative hold Swing
Severn (1 seats) [2]
PartyCandidateVotes%±%
Conservative Matthew Robert Riddle188377.3+3.5
Liberal Democrats Alan Dallas Moller38315.7-3.1
Labour Gillian Foxton1717.0-0.4
Conservative hold Swing
Siston (1 seats) [2]
PartyCandidateVotes%±%
Conservative Ian Adams149360.3+9.3
Liberal Democrats Edward Roger Allinson72629.3+16.7
Labour Peter Jeffrey Goodman25710.4-25.0
Conservative hold Swing
Staple Hill (2 seats) [2]
PartyCandidateVotes%±%
Labour Ian Michael Boulton340932.5+0.9
Labour Shirley Diana Potts321430.7+0.3
Conservative Elizabeth Shepherd190118.1+2.3
Conservative Elaine Hardwick115311.0-3.7
Liberal Democrats Kenton James Boon4434.2+0.1
Liberal Democrats Richard Clive Parkinson3593.4+0.1
Labour hold Swing
Labour hold Swing
Stoke Gifford (3 seats) [2]
PartyCandidateVotes%±%
Conservative Brian Allinson274316.3-2.0
Conservative Ernie Brown248014.8-1.8
Conservative Keith Cranney227213.5-1.6
Labour Ben Scott15329.1-2.3
Labour Andrew John Chubb13247.9-3.0
Labour Dayley Patrick Gerald Lawrence13247.9-2.0
UKIP Louis Crawley12457.4
UKIP Ginge Dangerfield10966.5
Green Richard William Burton8865.3+0.5
Liberal Democrats Becky Williams8284.9±0.0
Liberal Democrats Benjamin Peter Campbell5923.5-0.9
Liberal Democrats Laurence Bruce Walker4802.9-0.7
Conservative hold Swing
Thornbury North (2 seats) [2]
PartyCandidateVotes%±%
Liberal Democrats Clare Mary Fardell177020.6-0.3
Conservative David Chubb167719.5+5.6
Liberal Democrats Benj Richard Emmerson157218.3-1.2
Conservative Quentin Killey117513.7+1.5
Independent Vincent Francis Costello8519.9-2.4
UKIP David Crowle5536.4
Labour Sonia Charlotte Jackson5125.9+1.1
Labour Robert William Hall4965.8+1.0
Liberal Democrats hold Swing
Conservative gain from Liberal Democrats Swing
Thornbury South and Alveston (2 seats) [2]
PartyCandidateVotes%±%
Liberal Democrats Maggie Tyrrell197924.0-2.7
Liberal Democrats Shirley Anne Holloway193323.4-3.0
Conservative Karen Lesley Blick173521.0+3.1
Conservative Steve Blick162419.7+3.7
Labour Linda Jean Harris5186.3-0.7
Labour Gary Michael Shane Pepworth4595.6-0.5
Liberal Democrats hold Swing
Westerleigh (1 seats) [2]
PartyCandidateVotes%±%
Liberal Democrats Claire Louise Young117548.5-11.5
Conservative Michaela Sydney Crumpton103142.6+12.0
Labour Jonathan Terence Trollope2179.0-0.4
Liberal Democrats hold Swing
Winterbourne (2 seats) [2]
PartyCandidateVotes%±%
Conservative Tim Bowles 230228.2-3.1
Conservative Martin Manning195424.0-5.9
Liberal Democrats Pete Bruce109913.5+4.9
UKIP Jeanette Hayter8119.9
Labour Jo Cranney7549.2-2.4
Labour Gareth Keel6838.4-1.9
Liberal Democrats Annette Maria Elizabeth Parsons5546.8-1.5
Conservative hold Swing
Woodstock (3 seats) [2]
PartyCandidateVotes%±%
Labour Andy Perkins250617.1-4.8
Labour Pat Rooney247616.9-4.5
Labour Gareth Thomas Manson232815.9-4.8
Conservative Philip Staples205914.0+3.6
Conservative Richard Pope200013.6+3.5
Conservative Bips Nathwani179912.3+3.9
Liberal Democrats James Pringle Corrigan6414.4+1.0
Liberal Democrats Patrick John Eagar Thoyts3082.1+0.2
Liberal Democrats Penelope Ruth Thoyts2942.0+0.1
TUSC Richard Worth2571.8
Labour hold Swing
Labour hold Swing
Labour hold Swing
Yate Central (2 seats) [2]
PartyCandidateVotes%±%
Liberal Democrats Sue Walker196226.3-7.8
Liberal Democrats Ruth Brenda Davis179824.1-8.0
Conservative Roy Garner98213.1+2.8
Conservative Fred Watts88411.8+2.2
UKIP Adrian Sutton83111.1
Labour Michael Paul Mcgrath5327.1-0.6
Labour Peter David Abraham4816.4-0.1
Liberal Democrats hold Swing
Yate North (3 seats) [2]
PartyCandidateVotes%±%
Liberal Democrats Mike Drew265316.8-4.3
Liberal Democrats Ian William Johnston Blair246615.6-4.8
Liberal Democrats John Anthony Davis233014.7-5.5
Conservative David Penry Williams184011.6+3.4
Conservative Sonia Williams172510.9+3.0
Conservative Kion Kevan Northam15669.9+2.7
UKIP Steven Ring10486.6
Labour Brian Fletcher6764.3-1.0
Labour Fred Simpson5523.5-1.5
Labour Alan William Maggs5343.4-1.2
Independent Mike Dollin4182.6
Liberal Democrats hold Swing

Related Research Articles

<span class="mw-page-title-main">Gloucestershire</span> County of England

Gloucestershire is a ceremonial county in South West England. It is bordered by Herefordshire to the north-west, Worcestershire to the north, Warwickshire to the north-east, Oxfordshire to the east, Wiltshire to the south, Bristol and Somerset to the south-west, and the Welsh county of Monmouthshire to the west. The city of Gloucester is the largest settlement and the county town.

<span class="mw-page-title-main">South Gloucestershire</span> Local government district in Gloucestershire, England

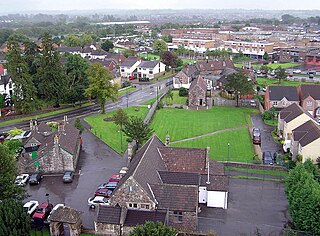
South Gloucestershire is a unitary authority area in the ceremonial county of Gloucestershire, South West England. Towns in the area include Yate, Chipping Sodbury, Kingswood, Thornbury, Filton, Patchway and Bradley Stoke. The southern part of its area falls within the Greater Bristol urban area surrounding the city of Bristol.

<span class="mw-page-title-main">Cotswold District</span> Non-metropolitan district in England

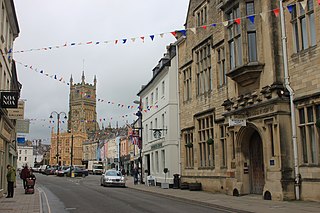
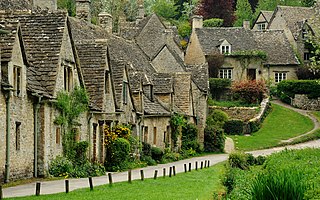
Cotswold is a local government district in Gloucestershire, England. It is named after the wider Cotswolds region and range of hills. The council is based in the district's largest town of Cirencester. The district also includes the towns of Chipping Campden, Fairford, Lechlade, Moreton-in-Marsh, Northleach, Stow-on-the-Wold and Tetbury, along with numerous villages and surrounding rural areas.

<span class="mw-page-title-main">The Cotswolds (UK Parliament constituency)</span> Parliamentary constituency in the United Kingdom, 1997 onwards

The Cotswolds is a constituency in Gloucestershire represented in the House of Commons of the UK Parliament by Sir Geoffrey Clifton-Brown, a Conservative, since its 1997 creation.

Half of Cheltenham Borough Council is the local authority for Cheltenham in Gloucestershire, England. Half the council is elected every two years, while before 2002 the council was elected by thirds. Since the last boundary changes in 2002, 40 councillors have been elected from 20 wards.

<span class="mw-page-title-main">Filton and Bradley Stoke (UK Parliament constituency)</span>

Filton and Bradley Stoke is a constituency represented in the House of Commons of the UK Parliament since 2010 by Jack Lopresti, a Conservative.

<span class="mw-page-title-main">Thornbury and Yate (UK Parliament constituency)</span>

Thornbury and Yate is a constituency represented in the House of Commons of the UK Parliament since the 2015 election by Luke Hall, a member of the Conservative Party. Encompassing an area to the north-east of Bristol, it is one of three constituencies that make up the South Gloucestershire Unitary Authority Area, along with Filton and Bradley Stoke and Kingswood.

<span class="mw-page-title-main">Politics of Bristol</span> Overview of the politics of Bristol

The city of Bristol, England, is a unitary authority, represented by four MPs representing seats wholly within the city boundaries. As well as these, Filton and Bradley Stoke covers the northern urban fringe in South Gloucestershire and the north eastern urban fringe is in the Kingswood constituency. The overall trend of both local and national representation became left of centre during the latter 20th century, but there was a shift to the right in the 2010 general election. The city has a tradition of local activism, with environmental issues and sustainable transport being prominent issues in the city.

South Gloucestershire Council is the local authority for the a unitary authority of South Gloucestershire, England. It was created on 1 April 1996, covering the area of the abolished Kingswood and Northavon districts, and also taking on the services previously provided by the former Avon County Council in the area.

The 1999 South Gloucestershire Council election took place on 6 May 1999 to elect members of South Gloucestershire unitary authority in England. All 70 seats in the council were up for election and the Liberal Democrats gained overall control of the council from no overall control.

<span class="mw-page-title-main">2010 Cheltenham Borough Council election</span>

The 2010 Cheltenham Council election took place on 6 May 2010 to elect members of Cheltenham Borough Council in Gloucestershire, England. Half of the council was up for election and the Liberal Democrats stayed in overall control of the council.

The 2003 South Gloucestershire Council election took place on 1 May 2003 to elect members of South Gloucestershire unitary authority in England. All 70 seats in the council were up for election. The Liberal Democrats once again gained a plurality of seats but lost overall control of the council as the Conservatives won the most votes and therefore made large gains at the expense of the Lib Dems and Labour.

The 2000 Cheltenham Council election took place on 4 May 2000 to elect members of Cheltenham Borough Council in Gloucestershire, England. One third of the council was up for election and the Conservative Party stayed in overall control of the council.

<span class="mw-page-title-main">South Gloucestershire Council</span>

South Gloucestershire Council is the local authority of South Gloucestershire, England, covering an area to the north of the city of Bristol. As a unitary authority it has the powers of a non-metropolitan county and district council combined. It is administratively separate from the county of Gloucestershire.

<span class="mw-page-title-main">2006 Stroud District Council election</span>

The 2006 Stroud Council election took place on 4 May 2006 to elect members of Stroud District Council in Gloucestershire, England. One third of the council was up for election and the Conservative Party stayed in overall control of the council.

<span class="mw-page-title-main">2007 Stroud District Council election</span>

The 2007 Stroud Council election took place on 3 May 2007 to elect members of Stroud District Council in Gloucestershire, England. One third of the council was up for election and the Conservative Party stayed in overall control of the council.

The 2011 South Gloucestershire Council election took place on 5 May 2011 to elect members of South Gloucestershire unitary authority in England.

<span class="mw-page-title-main">2013 Gloucestershire County Council election</span>

Elections to Gloucestershire County Council took place on 2 May 2013 as part of the 2013 United Kingdom local elections. 53 electoral divisions elected one county councillor each by first-past-the-post voting for a four-year term of office. No elections were held in South Gloucestershire, which is a unitary authority outside the area covered by the County Council.

<span class="mw-page-title-main">2019 South Gloucestershire Council election</span> 2019 UK local government election

The 2019 South Gloucestershire Council election took place on 2 May 2019 to elect members of South Gloucestershire Council in England as part of nationwide local elections.

<span class="mw-page-title-main">2021 Gloucestershire County Council election</span> Gloucestershire County Council election

The 2021 Gloucestershire County Council election took place on 6 May 2021 alongside other local elections. All 53 seats to Gloucestershire County Council were up for election. The Conservatives retained their majority, albeit a smaller one than in 2017.

References

  1. "Upcoming elections & referendums". The Electoral Commission. Archived from the original on 15 March 2015. Retrieved 3 April 2015.
  2. 1 2 3 4 5 6 7 8 9 10 11 12 13 14 15 16 17 18 19 20 21 22 23 24 25 26 27 28 29 30 31 32 33 34 35 36 37 "2015 district election results". South Gloucestershire Council. Archived from the original on 13 May 2015. Retrieved 23 January 2017.