2015 Test Valley Borough Council election

Last updated
2015 Test Valley Borough Council election
  2011 7 May 2015 2019  

All 48 seats to Test Valley Borough Council
24 seats needed for a majority
 First partySecond partyThird party
 
Party Conservative Liberal Democrats Independent
Last election36120
Seats won3891
Seat changeIncrease2.svg2Decrease2.svg3Increase2.svg1
Popular vote31,77515,9333,317
Percentage44.30%22.21%4.62%

Test Valley UK Local Election 2015.svg

Council control before election

Conservatives

Council control after election

Conservatives

The 2015 Test Valley Borough Council election took place on 7 May 2015 to elect members of the Test Valley Borough Council in England. [1] [2] It was held on the same day as other local elections.

Contents

Results

Test Valley Borough Council Election, 2015
PartySeatsGainsLossesNet gain/lossSeats %Votes %Votes+/−
  Conservative 3831Increase2.svg279.1644.3031,775Decrease2.svg12.02
  Liberal Democrats 903Decrease2.svg318.7537.0715,933Decrease2.svg10.54
  UKIP 0Steady2.svgSteady2.svgSteady2.svg015.4911,114Increase2.svg12.19
  Labour 0Steady2.svgSteady2.svgSteady2.svg08.956,426Increase2.svg3.57
  Independent 10Decrease2.svg2Decrease2.svg22.084.623,317Increase2.svg3.23
  Green 00Steady2.svgSteady2.svg04.403,161Increase2.svg3.6
Total4834536

Ward results

Abbey

Note that in the previous election, Liberal Democrat candidate Sally Lamb stood as an Independent, receiving 27.20% of the vote share.

Abbey (2)
PartyCandidateVotes%±%
Conservative Ian Richards 1,195 39.12 Decrease2.svg2.99
Conservative Clive Collier 1,076
Liberal Democrats Sally Lamb86528.32Increase2.svg12.20
Liberal Democrats John Critchley716
UKIP Paul Welch33510.96Increase2.svg10.96
Labour Stuart Bannerman33410.93Decrease2.svg3.62
Green Lucy Best32510.64Increase2.svg10.64
Turnout
Conservative hold Swing

Alamein

Alamein (3)
PartyCandidateVotes%±%
Conservative Phil North 1,960 40.96 Decrease2.svg6.33
Conservative Alexander Brook 1,677
Conservative Tracey Preston 1,570
UKIP Connor Docherty86519.66Increase2.svg19.66
Liberal Democrats Len Gates76816.05Decrease2.svg20.53
Liberal Democrats Robin Hughes688
Liberal Democrats Amy Bower686
Labour Andy Fitchet64813.54Decrease2.svg2.57
Labour Ben Kinross569
Labour Michael Mumford504
Green Adam Timby4689.78Increase2.svg9.78
Green Joshua Cussen418
Turnout
Conservative hold Swing

Ampfield and Braishfield

Ampfield and Braishfield
PartyCandidateVotes%±%
Conservative Martin Hatley 1,052 69.94 Decrease2.svg1.45
Liberal Democrats Clive Anderson31420.87Increase2.svg3.34
Labour Arthur Stevens1389.17Decrease2.svg1.90
Turnout
Conservative hold Swing

Amport

Note that Ben Few Brown had been the Conservative incumbent in the previous election

Amport
PartyCandidateVotes%±%
Independent Ben Few Brown 851 64.17
UKIP Christine Forrester47535.82Increase2.svg35.82
Independent gain from Conservative Swing

Anna

Anna (2)
PartyCandidateVotes%±%
Conservative Maureen Flood 1,527 71.96 Increase2.svg8.32
Conservative Graham Stallard 1,256
UKIP Timothy Rolt29914.09Decrease2.svg3.56
Liberal Democrats Josie Msonthi29613.94Decrease2.svg4.75
Turnout
Conservative hold Swing

Blackwater

Blackwater (2)
PartyCandidateVotes%±%
Conservative Gordon Bailey 1,865 54.54 Decrease2.svg14.89
Conservative Nick Adams-King 1,653
UKIP Kim Bigwood52115.23Increase2.svg15.23
Liberal Democrats Phil Green48614.21Decrease2.svg8.64
Liberal Democrats Nik Daas445
Green Gill Tunney3419.97Increase2.svg9.97
Labour Peter Sowerby2066.02Decrease2.svg1.69
Turnout
Conservative hold Swing

Bourne Valley

Bourne Valley
PartyCandidateVotes%±%
Conservative Peter Giddings 905 70.75 n/a
Liberal Democrats Linda Gates20415.94n/a
UKIP William McCabe17013.29
Turnout
Conservative hold Swing

Broughton and Stockbridge

Broughton and Stockbridge (2)
PartyCandidateVotes%±%
Conservative Peter Boulton 1,799 49.00 Decrease2.svg18.62
Conservative Daniel Busk 1,291
Independent Harry Paul1,03128.08Increase2.svg28.08
Liberal Democrats Ed Treadwell84122.90Increase2.svg13.00
Turnout
Conservative hold Swing

Charlton

Charlton
PartyCandidateVotes%±%
Conservative Ian Carr 670 57.41 Increase2.svg1.21
UKIP Norman Woods29325.10Decrease2.svg0.53
Independent Richard Kidd20417.48Increase2.svg17.48
Turnout
Conservative hold Swing

Chilworth, Nursling and Rownhams

Chilworth, Nursling and Rownhams (3)
PartyCandidateVotes%±%
Conservative Phil Bundy 2,190 49.96 Decrease2.svg12.86
Conservative Nigel Anderdon 2,074
Conservative Alison Finlay 1,931
Liberal Democrats Brian Richards89520.41Increase2.svg0.22
UKIP Iain Bell81218.52Increase2.svg18.52
Liberal Democrats Michael Ward517
Labour Gerald Whitaker48611.08Decrease2.svg5.89
Liberal Democrats Richard Rowles462
Turnout
Conservative hold Swing

Cupernham

Cupernham (2)
PartyCandidateVotes%±%
Liberal Democrats Dorothy Baverstock 1,367 46.68 Decrease2.svg0.02
Conservative John Ray 1,183 40.40 Increase2.svg0.16
Conservative Teresa Hibberd1,148
Liberal Democrats Janet Burnage1,121
Labour Stuart Copping37812.90Decrease2.svg0.15
Turnout
Liberal Democrats hold Swing
Conservative gain from Liberal Democrats Swing

Dun Valley

Dun Valley
PartyCandidateVotes%±%
Conservative Ian Jeffrey 905 67.38 Increase2.svg0.12
Liberal Democrats Maureen Treadwell43832.61Decrease2.svg0.12
Turnout
Conservative hold Swing

Harewood

Harewood
PartyCandidateVotes%±%
Conservative David Drew 1,086 80.20 Increase2.svg13.07
Liberal Democrats Anthony McCabe26819.79Decrease2.svg13.07
Turnout
Conservative hold Swing

Harroway

Harroway (3)
PartyCandidateVotes%±%
Conservative Carl Borg-Neal 1,903 42.30 Decrease2.svg6.03
Conservative Karen Hamilton 1,761
Conservative Brian Page 1,545
UKIP Simon Hession1,06623.69Increase2.svg4.18
Labour Madeleine Fairweather86919.31Decrease2.svg0.20
Green Laura Marriner66014.67Increase2.svg14.67
Green Barbara Mitchell513
Green Lance Mitchell377
Turnout
Conservative hold Swing

Kings Somborne and Michelmersh

Kings Somborne and Michelmersh
PartyCandidateVotes%±%
Conservative Tony Ward 1,093 65.17 Decrease2.svg6.07
Liberal Democrats Sandra Cosier38422.89Decrease2.svg5.86
UKIP Richard Scott20011.92Increase2.svg11.92
Turnout
Conservative hold Swing

Millway

Millway (3)
PartyCandidateVotes%±%
Conservative Zilliah Brooks 2,080 41.68 Decrease2.svg14.05
Conservative Sandra Hawke 1,812
Conservative Jim Neal 1,545
UKIP Mo Cleary87717.57Increase2.svg4.52
Liberal Democrats Christopher Ecclestone63812.78Decrease2.svg3.94
Green Carol Bartholomew60212.06Increase2.svg12.06
Labour Jeffrey Davey58611.74Decrease2.svg2.73
Green Dean Marriner490
Liberal Democrats Ross Fifield569382
Independent Tony Hooke2074.14Increase2.svg4.14
Independent Alex Gillies205
Independent Steve McKellar195
Turnout
Conservative hold Swing

North Baddesley

North Baddesley (3)
PartyCandidateVotes%±%
Liberal Democrats Ann Tupper 1,584 37.40 Decrease2.svg17.29
Liberal Democrats Stephen Cosier 1,534
Liberal Democrats Celia Dowden 1,522
Conservative Andrew Milligan1,38232.63Increase2.svg2.10
Conservative Harmeet Brar1,005
Conservative Phil Williams973
UKIP Paul Cadier81619.26Increase2.svg19.26
Turnout
Liberal Democrats hold Swing

Over Wallop

Over Wallop [3]
PartyCandidateVotes%±%
Conservative Tony HopeUnopposed
Conservative hold Swing

Penton Bellinger

Penton Bellinger (2)
PartyCandidateVotes%±%
Conservative Phil Lashbrook 1,734 58.38 Decrease2.svg17.56
Conservative Pam Mutton 1,254
UKIP Barry Hodgson69323.33Increase2.svg23.33
Liberal Democrats Barbara Carpenter54318.28Increase2.svg18.28
Turnout
Conservative hold Swing

Romsey Extra

Romsey Extra (2)
PartyCandidateVotes%±%
Conservative Ian Hibberd 1,123 38.06 Decrease2.svg16.80
Conservative Alison Johnston 1,053
Liberal Democrats Karen Dunleavey60920.64Decrease2.svg13.76
Liberal Democrats John Parker520
UKIP Alex Briggs35912.16Increase2.svg12.16
Green Ian Callaghan33011.18Increase2.svg11.18
Independent Richard Buss30210.23Increase2.svg10.23
Labour Barney Jones2277.69Decrease2.svg3.03
Turnout
Conservative hold Swing

St Mary's

St Mary's (3)
PartyCandidateVotes%±%
Conservative Iris Andersen 1,638 35.27 Increase2.svg5.63
Conservative John Cockaday 1,289
Conservative David Denny 1,245
UKIP Daniel Emmerson92219.85Increase2.svg5.39
UKIP Peter Mather855
Liberal Democrats Katherine Bird80617.35Decrease2.svg10.31
UKIP Vincent McGarry794
Liberal Democrats Nigel Long724
Labour Alan Cotter68414.72Decrease2.svg3.34
Labour Nicole Gentleman635
Liberal Democrats Sheryl Scott-Clarke536
Labour Alan Wright504
Green Catherine Hosen4359.36Increase2.svg9.36
Independent Russell Tarrant1593.42Increase2.svg3.42
Turnout
Conservative hold Swing
Conservative gain from Liberal Democrats Swing

Tadburn

Tadburn (2)
PartyCandidateVotes%±%
Liberal Democrats Mark Cooper 1,737 48.06 Decrease2.svg4.40
Liberal Democrats Peter Hurst 1,371
Conservative Nick Michell1,00727.86Decrease2.svg8.91
Conservative Matthew Southey781
UKIP Roy Bishop47713.19Increase2.svg13.19
Labour Carolyn Nixson39310.87Increase2.svg0.10
Turnout
Liberal Democrats hold Swing

Valley Park

Valley Park (3)
PartyCandidateVotes%±%
Liberal Democrats Alan Dowden 2,238 53.52 Decrease2.svg7.63
Liberal Democrats Andrew Beesley 1,966
Liberal Democrats Kath Tilling 1,803
Conservative Tim England1,48335.46Decrease2.svg3.38
Conservative Anne Winstanley1,388
Conservative Ryan Sutton1,116
UKIP Sarah Morgan46011.00Increase2.svg11.00
Turnout
Liberal Democrats hold Swing

Winton

Winton (3)
PartyCandidateVotes%±%
Conservative Chris Lynn 1,995 35.42 Decrease2.svg7.74
Conservative Jan Lovell 1,899
Conservative Jan Budzynski 1,653
UKIP Marley Spicer1,13020.06Decrease2.svg0.21
Labour Adam Jones1,02418.18Increase2.svg3.72
Liberal Democrats Sid Dajani92016.33Decrease2.svg5.76
Independent Nick Thirsk5639.99Increase2.svg9.99
Turnout
Conservative hold Swing

Related Research Articles

<span class="mw-page-title-main">Test Valley</span> Borough and non-metropolitan district in England

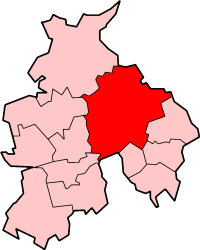
Test Valley is a local government district with borough status in Hampshire, England, named after the valley of the River Test. The council is based in the borough's largest town of Andover. The borough also contains the town of Romsey and numerous villages and surrounding rural areas. A small part of the borough at its southern end lies within the New Forest National Park, and part of the borough north of Andover lies within the North Wessex Downs, a designated Area of Outstanding Natural Beauty.

<span class="mw-page-title-main">Epsom and Ewell (UK Parliament constituency)</span> UK Parliament constituency since 1974

Epsom and Ewell is a constituency in Surrey represented in the House of Commons of the UK Parliament since 2001 by Chris Grayling, a Conservative.

<span class="mw-page-title-main">North West Hampshire (UK Parliament constituency)</span> Parliamentary constituency in the United Kingdom, 1983 onwards

North West Hampshire is a constituency represented in the House of Commons of the UK Parliament since 2015 by Conservative Kit Malthouse, who served as Education Secretary in 2022.

<span class="mw-page-title-main">Ribble Valley (UK Parliament constituency)</span> Parliamentary constituency in the United Kingdom, 1983 onwards

Ribble Valley is a constituency in Lancashire represented in the House of Commons of the UK Parliament since 1992 by Nigel Evans, a Conservative. Evans has served as a Deputy Speaker of the House of Commons and Second Deputy Chairman of Ways and Means since January 2020; he previously served as First Deputy Chairman of Ways and Means from 2010 to 2013.

<span class="mw-page-title-main">Eastleigh (UK Parliament constituency)</span> UK Parliament constituency since 1955

Eastleigh is a constituency represented in the House of Commons of the UK Parliament since 2019 by Paul Holmes, a Conservative.

Test Valley Borough Council is elected every four years.

Dacorum Borough Council in Hertfordshire, England is elected every four years. Since the last boundary changes in 2007, 51 councillors have been elected from 25 wards.

<span class="mw-page-title-main">Croydon London Borough Council elections</span> Class of UK elections

Elections for the Croydon London Borough Council are held every four years to elect 70 councillors. The last ward boundary changes came into force at the 2018 local elections.

Bournemouth Borough Council was the local authority for Bournemouth in Dorset, England between 1974 and 2019. Prior to 1974 Bournemouth had been a county borough within Hampshire. Under the Local Government Act 1972 Bournemouth became a non-metropolitan district within Dorset on 1 April 1974, with the same boundaries as the former county borough. On 1 April 1997 it became a unitary authority, taking over the functions previously provided for the area by Dorset County Council. In 2019 the council was abolished, merging with Christchurch and Poole to form Bournemouth, Christchurch and Poole.

Darlington Borough Council elections are held every four years. Darlington Borough Council is the local authority for the unitary authority of Darlington in County Durham, England. Until 1 April 1997 it was a non-metropolitan district.

Scarborough Borough Council in North Yorkshire, England was established in 1974 and abolished in 2023. It was elected once every four years.

<span class="mw-page-title-main">Hounslow London Borough Council elections</span> Local elections held every four years

Hounslow Council in London, England is elected every four years. 60 councillors are elected from 20 wards, with by-elections held to fill any vacancies between elections.

<span class="mw-page-title-main">Cheshire West and Chester</span> Borough in England

Cheshire West and Chester is a unitary authority area with borough status in Cheshire, England. It was established on 1 April 2009 as part of the 2009 local government changes, by virtue of an order under the Local Government and Public Involvement in Health Act 2007. It superseded the boroughs of Ellesmere Port and Neston, Vale Royal and the City of Chester; its council assumed the functions and responsibilities of the former Cheshire County Council within its area. The remainder of ceremonial Cheshire is composed of Cheshire East, Halton and Warrington. Cheshire West and Chester has three key urban areas: Chester, Ellesmere Port and Northwich/Winsford.

<span class="mw-page-title-main">Ribble Valley Borough Council elections</span>

Ribble Valley Borough Council elections are held every four years. Ribble Valley Borough Council is the local authority for the non-metropolitan district of Ribble Valley in Lancashire, England. Since the last boundary changes in 2019, 40 councillors have been elected from 26 wards.

Milton Keynes City Council is the local authority for the City of Milton Keynes, a unitary authority in Buckinghamshire, England. Until 1 April 1997 it was a non-metropolitan district.

<span class="mw-page-title-main">2011 Test Valley Borough Council election</span> 2011 UK local government election

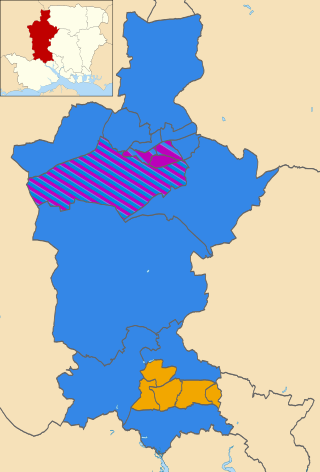
Elections to Test Valley Borough Council were held on 5 May 2011, the same day as the 2011 United Kingdom Alternative Vote referendum. The Conservatives maintained control of the council, with an increased majority.

<span class="mw-page-title-main">Islington London Borough Council elections</span> UK local government elections

Islington London Borough Council in London, England is elected every four years. Since the last boundary changes in 2022, 51 councillors have been elected from 17 wards.

<span class="mw-page-title-main">2019 Test Valley Borough Council election</span> 2019 UK local government election

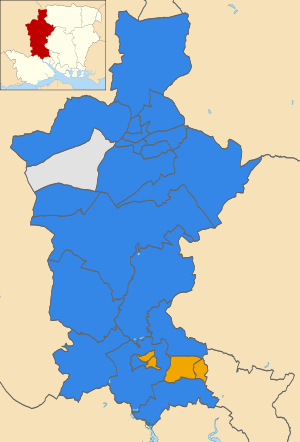
The 2019 Test Valley Borough Council election took place on 2 May 2019 to elect members of Test Valley Borough Council in England. This was on the same day as other local elections. The whole council was up for election on new boundaries, with the number of seats reduced from 48 across 24 wards to 43 across 20.

<span class="mw-page-title-main">2003 Test Valley Borough Council election</span>

The 2003 Test Valley Borough Council election took place on the 1 May 2003. With new ward boundaries, all 48 seats were up for election. 24 seats were needed for a majority, with the Conservatives winning 30; the Liberal Democrats won 16 seats, and Independents won 2.

<span class="mw-page-title-main">2007 Test Valley Borough Council election</span> 2007 UK local government election

The 2007 Test Valley Borough Council election took place on the 3 May 2007. All 48 seats were up for election. 24 seats were needed for a majority, with the Conservatives increasing their majority by three seats. Both independents lost their seats, one to the Conservatives and one to the Liberal Democrats, who in turn lost a seat to the Conservatives.

References

  1. "Upcoming elections & referendums". The Electoral Commission. Archived from the original on 15 March 2015. Retrieved 26 April 2015.
  2. "Local Elections Archive Project - 2015 - Test Valley". www.andrewteale.me.uk. Retrieved 11 January 2021.
  3. "Election of a Borough Councillor / Over Wallop Ward" (PDF). www.testvalley.gov.uk. Archived from the original (PDF) on 22 July 2011.