2003 New Forest District Council election

Last updated

2003 New Forest District Council election
Flag of England.svg
  1999 1 May 2003 2007  

All 60 seats to New Forest District Council
31 seats needed for a majority
 First partySecond partyThird party
 
Party Conservative Liberal Democrats Independent
Seats before29263
Seats won32271
Seat changeIncrease2.svg3Increase2.svg1Decrease2.svg2
Popular vote23,80318,7122,723

New Forest UK local election 2003 map.svg
Results by Ward

Council control before election

Conservative

Council control after election

Conservative

The 2003 New Forest District Council election took place on 1 May 2003 to elect members to the New Forest District Council, on the same day as other local elections. The 2003 election saw new ward boundaries used which increased the number of seats by 2 to 60. [1] [2] The election saw the Conservatives win 32 seats out of the 31 required for a majority, with the Liberal Democrats winning 27 seats and one independent win. [3] [4] [5]

Contents

Election Summary

New ward boundaries came into effect for the election, which increased the number of seats by two. Prior to the election, a by-election took place in Pennington, which saw the Liberal Democrats gaining the seat from the Conservatives, meaning that prior to the election the Conservatives held 29 seats (50.00%), the Liberal Democrats held 36 seats (44.82%) and three independents held seats (5.17%). After the election, the Conservatives held 32 seats (53.33%) and the Liberal Democrats held 27 (45.00%), with only one independent hold (1.66%)

The Liberal Democrats performed best in the East of the district, as well as the North West, taking eight out of ten Totton seats, all six Hythe and Dibden seats, and all four seats in the Fawley, Blackfield and Holbury area. [4] The Conservatives meanwhile performed well across the rest of the district.

The table below only tallies the votes of the highest polling candidate for each party within each ward. This is known as the top candidate method and is often used for multi-member plurality elections.

New Forest local election result 2003
PartySeatsGainsLossesNet gain/lossSeats %Votes %Votes+/−
  Conservative 32171Increase2.svg353.3351.4923,803
  Liberal Democrats 27220Increase2.svg145.0040.4818,712
  Independent 102Decrease2.svg21.665.892,723
  Labour 000Steady2.svg01.61745
  Green 000Steady2.svg00.26124
  UKIP 000Steady2.svg00.25117

Ward Results

Ashurst, Copythorne South and Netley Marsh

Ashurst, Copythorne South and Netley Marsh (2)
PartyCandidateVotes%±%
Conservative Derek Tipp 829 45.64
Conservative Leslie Puttock 827
Liberal Democrats Anthony Gray42123.18
Liberal Democrats Peter Keeley412
Labour Peter Sopowski29015.96
Independent Jeannette Brownsea27615.19
Majority40822.46
Turnout 1,816
Conservative win (new seat)

Barton

Barton (2)
PartyCandidateVotes%±%
Conservative Kenneth Austin 1,261 73.61
Conservative John Hutchins 1,255
Liberal Democrats Paul Chatfield45226.38
Liberal Democrats Nicholas McGeorge378
Majority80947.22
Turnout 1,713
Conservative win (new seat)

Bashley

Bashley
PartyCandidateVotes%±%
Conservative Alan Rice 710 79.32
Liberal Democrats Anne Jenks12013.40
Independent Ken Duffy657.26
Majority59065.92
Turnout 895
Conservative win (new seat)

Becton

Becton (2)
PartyCandidateVotes%±%
Conservative Godfrey Beck 922 72.31
Conservative Paul Woods 894
Liberal Democrats John Burton35327.68
Liberal Democrats Margaret Newlands344
Majority56944.62
Turnout 1,275
Conservative win (new seat)

Boldre and Sway

Boldre and Sway (2)
PartyCandidateVotes%±%
Conservative Barry Rickman 1,343 71.81
Conservative Colin Wise 1,154
Liberal Democrats Susan Lewis38820.74
Liberal Democrats Freda Angelou276
Labour Peter Dance1397.43
Majority95551.06
Turnout 1,870
Conservative win (new seat)

Bramshaw, Copythorne North and Minstead

Bramshaw, Copythorne North and Minstead
PartyCandidateVotes%±%
Conservative David Scott 579 73.10
Liberal Democrats Judith Baker21326.89
Majority36646.21
Turnout 792
Conservative win (new seat)

Bransgore and Burley

Bransgore and Burley (2)
PartyCandidateVotes%±%
Conservative John Penwarden 961 38.15
Conservative Peter Greenfield 886
Independent Sally Owen88034.93
Liberal Democrats Gwenneth Rickus67826.91
Majority813.21
Turnout 2,519
Conservative win (new seat)

Brockenhurst and Forest South East

Brockenhurst and Forest South East (2)
PartyCandidateVotes%±%
Conservative Maureen Holding 1,262 73.80
Conservative Roger Neath 1,155
Liberal Democrats Rachel Kalis44826.19
Liberal Democrats Frank Jenks330
Majority81447.60
Turnout 1,710
Conservative win (new seat)

Buckland

Buckland
PartyCandidateVotes%±%
Liberal Democrats Brenda Vincent 360 48.45
Conservative Michael Beggs26635.80
UKIP Alexander Neill11715.74
Majority9412.65
Turnout 743
Liberal Democrats win (new seat)

Butts Ash and Dibden Purlieu

Butts Ash and Dibden Purlieu (2)
PartyCandidateVotes%±%
Liberal Democrats Brenda Smith 1,081 64.61
Liberal Democrats Malcolm Wade 1,012
Conservative Brian Uglow59235.38
Majority48929.22
Turnout 1,673
Liberal Democrats win (new seat)

Dibden and Hythe East

Dibden and Hythe East (2)
PartyCandidateVotes%±%
Liberal Democrats Christopher Harrison 898 68.03
Liberal Democrats Stanley Wade 893
Conservative Beverley Thorne42231.96
Conservative Penelope Rose410
Majority47636.06
Turnout 1,320
Liberal Democrats win (new seat)

Downlands and Forest

Downlands and Forest
PartyCandidateVotes%±%
Liberal Democrats Miranda Whitehead 560 47.29
Conservative Kathy Heron50042.22
Green Janet Richards12410.47
Majority605.06
Turnout 1,184
Liberal Democrats win (new seat)

Fawley, Blackfield and Langley

Fawley, Blackfield and Langley (2)
PartyCandidateVotes%±%
Liberal Democrats Barbara Maynard 1,011 59.78
Liberal Democrats Malcolm Fidler 921
Conservative Alexis McEvoy68040.21
Conservative Barry Brooks584
Majority33119.57
Turnout 1,691
Liberal Democrats win (new seat)

Fernhill

Fernhill (2)
PartyCandidateVotes%±%
Conservative Jill Cleary 802 64.52
Conservative Sheila Snowden 752
Liberal Democrats Beverly Scott-Johns44135.47
Liberal Democrats Wendy Hedge411
Majority81429.04
Turnout 1,243
Conservative win (new seat)

Fordingbridge

Fordingbridge (2)
PartyCandidateVotes%±%
Liberal Democrats Robert Hale 1,481 68.12
Liberal Democrats Michael Shand 1,376
Conservative Roger Kernan69331.87
Majority78836.24
Turnout 2,174
Liberal Democrats win (new seat)

Forest North West

Forest North West
PartyCandidateVotes%±%
Conservative Bill Dow 565 60.75
Liberal Democrats John Stokes36539.24
Majority20021.50
Turnout 930
Conservative win (new seat)

Furzedown and Hardley

Furzedown and Hardley
PartyCandidateVotes%±%
Liberal Democrats Graham Parkes 565 72.30
Conservative Michael Curry16727.69
Majority26944.61
Turnout 603
Liberal Democrats win (new seat)

Holbury and North Blackfield

Holbury and North Blackfield (2)
PartyCandidateVotes%±%
Liberal Democrats John Coles 802 71.67
Liberal Democrats Colin Baker 754
Conservative Olivia Foster31728.32
Conservative Robert Wappet295
Majority33119.57
Turnout 1,691
Liberal Democrats win (new seat)

Hordle

Hordle (2)
PartyCandidateVotes%±%
Conservative John Hoy 953 50.18
Conservative Andrew Tinsley 699
Independent Ernest Bowring68536.07
Liberal Democrats Penelope Senior26113.74
Liberal Democrats Jacqueline Szwaczka203
Majority26814.11
Turnout 1,899
Conservative win (new seat)

Hythe West and Langdown

Hythe West and Langdown (2)
PartyCandidateVotes%±%
Liberal Democrats Maureen McLean 1,173 71.52
Liberal Democrats Maureen Robinson 1,172
Conservative John Hall-Say46728.47
Conservative Martin Wood443
Majority70643.04
Turnout 1,640
Liberal Democrats win (new seat)

Lymington Town

Lymington Town (2)
PartyCandidateVotes%±%
Conservative Kevin Ault 1,264 70.85
Conservative Thomas Russell 1,153
Liberal Democrats Sally May52029.14
Liberal Democrats Edward Jearrad480
Majority74441.70
Turnout 1,784
Conservative win (new seat)

Lyndhurst

Lyndhurst
PartyCandidateVotes%±%
Conservative Patricia Wyeth 630 70.62
Liberal Democrats William Croydon15917.82
Labour Kenneth Kershaw10311.54
Majority47152.80
Turnout 892
Conservative win (new seat)

Marchwood

Marchwood (2)
PartyCandidateVotes%±%
Liberal Democrats Graham Walmsley 701 58.07
Liberal Democrats Linda Snashall 586
Conservative Frakn Vickers50641.92
Conservative Alan Shotter502
Majority19516.15
Turnout 1,207
Liberal Democrats win (new seat)

Milford

Milford (2)
PartyCandidateVotes%±%
Conservative Melville Kendal 1,371 75.91
Conservative Brian Pemberton 1,274
Liberal Democrats Roger Hedge43524.08
Liberal Democrats Clifford Lewis354
Majority93651.82
Turnout 1,806
Conservative win (new seat)

Milton

Milton (2)
PartyCandidateVotes%±%
Conservative Ben Rule 1,073 63.52
Conservative John Ward 1,033
Liberal Democrats Benjamin Earwicker61636.47
Liberal Democrats Wynford Davies570
Majority46727.64
Turnout 1,689
Conservative win (new seat)

Pennington

Pennington (2)
PartyCandidateVotes%±%
Liberal Democrats Paul Hickman 848 52.34
Liberal Democrats Martina Humber 814
Conservative Penelope Beasley50931.41
Conservative Jacci Rhodes-Jury378
Independent Michael Thorp26316.23
Majority33920.92
Turnout 1,620
Liberal Democrats win (new seat)

Ringwood East and Sopley

Ringwood East and Sopley
PartyCandidateVotes%±%
Conservative Patricia Drake 472 76.00
Liberal Democrats Peter Newlands14923.99
Majority32352.01
Turnout 621
Conservative win (new seat)

Ringwood North

Ringwood North (2)
PartyCandidateVotes%±%
Conservative Michael Thierry 602 62.38
Conservative Lorna Ford 600
Liberal Democrats Malcolm Connolly36337.61
Liberal Democrats Peter Kinnison341
Majority23924.76
Turnout 965
Conservative win (new seat)

Ringwood South

Ringwood South (2)
PartyCandidateVotes%±%
Conservative Jeremy Heron 615 44.11
Independent Daniel Cracknell 554 39.74
Independent Belinda Charlton356
Liberal Democrats Peter Chambers22516.14
Liberal Democrats Veronica Sullivan218
Majority40822.46
Turnout 1,816
Conservative win (new seat)
Independent win (new seat)

Totton Central

Totton Central (2)
PartyCandidateVotes%±%
Liberal Democrats Stephen Shepherd 497 43.52
Liberal Democrats George Dart 492
Conservative Ronnie Belfitt43237.82
Conservative Christopher Lagdon428
Labour Alan Goodfellow21318.65
Majority655.69
Turnout 1,142
Liberal Democrats win (new seat)

Totton East

Totton East (2)
PartyCandidateVotes%±%
Liberal Democrats Frank Harrison 657 51.04
Liberal Democrats Graham Abbott 643
Conservative Frank Bright63048.95
Conservative Diana Brooks602
Majority272.09
Turnout 1,287
Liberal Democrats win (new seat)

Totton North

Totton North (2)
PartyCandidateVotes%±%
Liberal Democrats Neal Scott 424 51.14
Conservative Melvyn Molyneux 405 48.85
Conservative Marion Emery377
Liberal Democrats Pauline Watkins377
Turnout 829
Liberal Democrats win (new seat)
Conservative win (new seat)

Totton South

Totton South (2)
PartyCandidateVotes%±%
Liberal Democrats David Harrison 759 58.11
Liberal Democrats Alan Weeks 678
Conservative William Catt54741.88
Conservative George Kilford511
Majority21216.23
Turnout 1306,
Liberal Democrats win (new seat)

Totton West

Totton West (2)
PartyCandidateVotes%±%
Conservative David Hibbert 456 52.23
Liberal Democrats David Russell 417 47.76
Liberal Democrats Leonard Harris41447.42
Conservative Christopher Webb403
Turnout 873
Conservative win (new seat)
Liberal Democrats win (new seat)

Related Research Articles

<span class="mw-page-title-main">2003 Arun District Council election</span> 2003 UK local government election

The 2003 Arun District Council election took place on 1 May 2003 to elect members of Arun District Council in West Sussex, England. The whole council was up for election with boundary changes since the last election in 1999. The Conservative Party stayed in overall control of the council.

Thanet District Council elections are held every four years to elect Thanet District Council in Kent, England. Since the last boundary changes in 2003 the council has comprised 56 councillors representing 23 wards.

<span class="mw-page-title-main">2004 Wyre Forest District Council election</span> Election in Worcestershire, England

The 2004 Wyre Forest District Council election took place on 10 June 2004 to elect members of Wyre Forest District Council in Worcestershire, England. The whole council was up for election with boundary changes since the last election in 2003. The council stayed under no overall control, but with the Conservatives taking over as the largest party on the council from the Health Concern party.

The 2004 Halton Borough Council election took place on 10 June 2004 to elect members of Halton Unitary Council in Cheshire, England. The whole council was up for election with boundary changes since the last election in 2002. The Labour Party stayed in overall control of the council.

<span class="mw-page-title-main">2011 South Norfolk District Council election</span> 2011 UK local government election

The elections to South Norfolk District Council were held on Thursday 5 May 2011 along with various other local elections around England, elections to the Scottish Parliament, National Assembly of Wales and Northern Ireland Assembly, and a referendum on whether to adopt the Alternative Vote electoral system for elections to the House of Commons. All 46 council seats were up for election. The previous council was controlled by the Conservatives, with the Liberal Democrats being the only opposition.

The 2003 elections for Guildford Borough Council were the first, and as of 2011 the only, full election for Guildford Borough Council conducted by an all postal ballot. The result saw the Conservatives win a majority of seats on Guildford Borough Council for the first time since losing their majority in the 1991 election.

<span class="mw-page-title-main">2003 Wealden District Council election</span> 2003 UK local government election

The 2003 Wealden District Council election took place on 1 May 2003 to elect members of Wealden District Council in East Sussex, England. The whole council was up for election with boundary changes since the last election in 1999 reducing the number of seats by 3. The Conservative Party stayed in overall control of the council.

<span class="mw-page-title-main">2003 Rother District Council election</span>

The 2003 Rother District Council election took place on 1 May 2003 to elect members of Rother District Council in East Sussex, England. The whole council was up for election after boundary changes reduced the number of seats by 7. The Conservative Party stayed in overall control of the council.

<span class="mw-page-title-main">2015 Breckland District Council election</span> 2015 UK local government election

The 2015 Breckland District Council election took place on 7 May 2015 to elect members of Breckland District Council in England. This was on the same day as other local elections.

<span class="mw-page-title-main">2015 Hart District Council election</span> 2015 UK local government election

The 2015 Hart District Council election took place on 7 May 2015 to elect members of the Hart District Council in England. It was held on the same day as other local elections. Prior to this elections, the Conservatives held a plurality with 14 seats but did not hold a majority, whilst the Liberal Democrats and Community Campaign (Hart) both had 8 seats. The remaining seat was held by an independent.

<span class="mw-page-title-main">2015 South Oxfordshire District Council election</span> 2015 UK local government election

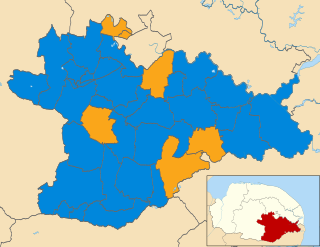
The 2015 South Oxfordshire District Council election was held on 7 May 2015 to elect members of South Oxfordshire District Council in England. This was on the same day as other local elections.

<span class="mw-page-title-main">2003 Wychavon District Council election</span>

The 2003 Wychavon District Council election took place on 1 May 2003 to elect members of Wychavon District Council in Worcestershire, England. The whole council was up for election with boundary changes since the last election in 1999 reducing the number of seats by four. The Conservative party stayed in overall control of the council.

<span class="mw-page-title-main">2011 South Oxfordshire District Council election</span> 2011 UK local government election

The 2011 South Oxfordshire District Council election was held on 5 May 2011 to elect members of South Oxfordshire District Council in England. This was on the same day as other local elections.

<span class="mw-page-title-main">2019 Guildford Borough Council election</span> Local election in Surrey, England

The 2019 Guildford Borough Council election were held on 2 May 2019, to elect all 48 seats to the Guildford Borough Council in Surrey, England as part of the 2019 local elections.

<span class="mw-page-title-main">2011 New Forest District Council election</span> 2011 UK local government election

The 2011 New Forest District Council election took place on 5 May 2011 to elect members to the New Forest District Council, on the same day as other local elections. The election saw the Conservatives gain eight seats from the Liberal Democrats, increasing their majority.

<span class="mw-page-title-main">2022 Camden London Borough Council election</span> 2022 local election in Camden

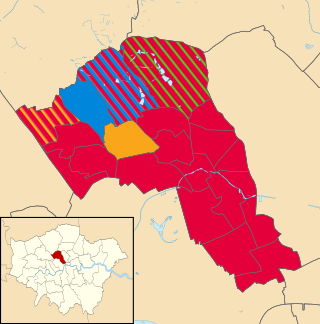
The 2022 Camden London Borough Council election took place on 5 May 2022. All 55 members of Camden London Borough Council were elected. The elections took place alongside local elections in the other London boroughs and elections to local authorities across the United Kingdom.

<span class="mw-page-title-main">2022 Cardiff Council election</span> Local election in Wales

The 2022 Cardiff Council election took place on 5 May 2022 to elect 79 members to Cardiff Council. On the same day, elections were held to the other 21 local authorities and to community councils in Wales as part of the 2022 Welsh local elections.

<span class="mw-page-title-main">2022 Manchester City Council election</span> 2022 local election in Manchester


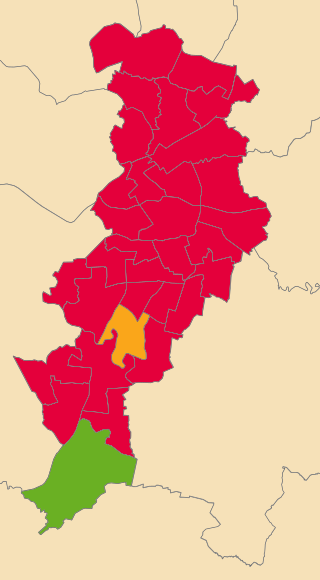
The 2022 Manchester City Council election took place on 5 May 2022. One third of councillors on Manchester City Council were elected. This election was a part of the other local elections across the United Kingdom.

Elections to The Highland Council were held on 5 May 2022, the same day as the 31 other Scottish local government elections. As with other Scottish council elections, it was held using single transferable vote (STV) – a form of proportional representation – in which multiple candidates are elected in each ward and voters rank candidates in order of preference.

<span class="mw-page-title-main">2023 United Kingdom local elections</span> Elections to local councils and mayoralties

The 2023 United Kingdom local elections were held on Thursday, 4 May 2023 in England and on Thursday 18 May 2023 in Northern Ireland. These included district councils, unitary authorities, and directly elected mayors in England, and included all local councils in Northern Ireland. Notably, these elections were the first to be held under the Elections Act 2022, a new voter identification law that required voters to show photo ID when attending a polling station, and was a cause for controversy.

References

  1. "BBC NEWS | VOTE 2003 | New Forest". news.bbc.co.uk. Retrieved 28 September 2020.
  2. "The District of New Forest (Parishes and Electoral Changes) Order 2001".
  3. "Local Elections Archive Project - 2003 - New Forest". www.andrewteale.me.uk. Retrieved 27 September 2020.
  4. 1 2 "Local Elections: How New Forest voted". Daily Echo. Retrieved 27 September 2020.
  5. Rallings, Collin; Thrasher, Michael. "New Forest District Council Election Results 1973-2011" (PDF). Plymouth University.