| |||||||||||||||||||||||||||||||||||||||||||||||||||||||||||||||||||||||||||||
14 out of 45 seats to Winchester City Council 23 seats needed for a majority | |||||||||||||||||||||||||||||||||||||||||||||||||||||||||||||||||||||||||||||
---|---|---|---|---|---|---|---|---|---|---|---|---|---|---|---|---|---|---|---|---|---|---|---|---|---|---|---|---|---|---|---|---|---|---|---|---|---|---|---|---|---|---|---|---|---|---|---|---|---|---|---|---|---|---|---|---|---|---|---|---|---|---|---|---|---|---|---|---|---|---|---|---|---|---|---|---|---|
Turnout | 41.4% [1] | ||||||||||||||||||||||||||||||||||||||||||||||||||||||||||||||||||||||||||||
| |||||||||||||||||||||||||||||||||||||||||||||||||||||||||||||||||||||||||||||
Ward map of Winchester, 2024 | |||||||||||||||||||||||||||||||||||||||||||||||||||||||||||||||||||||||||||||
|
The 2024 Winchester City Council election took place on 2 May 2024 to elect members of Winchester City Council in Hampshire, England. [2] This was on the same day as other local elections across England, and Hampshire's and the Isle of Wight's Constabulary Police and Crime Commissioner election.
As is typical for Winchester's local elections, fourteen seats of the forty-five total were contested. Not all wards had a seat open for election: the two wards Upper Meon Valley and Colden Common & Twyford will next be contested in 2026. The council was already under Liberal Democrat majority control; their majority increased at this election.
2024 Winchester City Council election [3] | ||||||||||
---|---|---|---|---|---|---|---|---|---|---|
Party | This election | Full council | This election | |||||||
Seats | Net | Seats % | Other | Total | Total % | Votes | Votes % | +/− | ||
Liberal Democrats | 11 | 4 | 78.6% | 22 | 33 | 73.3% | 17,258 | 47.7% | -2.3% | |
Conservative | 2 | 5 | 14.3% | 6 | 8 | 17.8% | 11,301 | 31.3% | -0.9% | |
Green | 1 | 1 | 7.1% | 2 | 3 | 6.7% | 5,198 | 14.4% | +1.7% | |
Independent | 0 | 0.0% | 1 | 1 | 2.2% | 552 | 1.5% | +1.5% | ||
Labour | 0 | 0.0% | 0 | 0 | 0.0% | 1,853 | 5.1% | +0.2% | ||
The Statements of Persons Nominated was released by Winchester City Council on 8 April 2024 following the close of nominations. [4] Sitting councillors standing for re-election are marked with an asterisk (*).
Party | Candidate | Votes | % | ±% | |
---|---|---|---|---|---|
Liberal Democrats | Clare Pinniger | 1,768 | 53.9 | -4.9 | |
Conservative | Fiona Isaacs* | 1283 | 39.1 | +4.8 | |
Green | Dane Westley | 148 | 4.5 | -0.2 | |
Labour | Tessa Valentine | 79 | 2.4 | +0.3 | |
Majority | 485 | 14.7 | |||
Turnout | 3297 | 47.5 | |||
Liberal Democrats gain from Conservative | Swing | ||||
Party | Candidate | Votes | % | ±% | |
---|---|---|---|---|---|
Conservative | Jan Warwick* | 1,618 | 47.5 | +8.8 | |
Liberal Democrats | Anne Forder | 1408 | 41.4 | -9.3 | |
Green | Max Priesemann | 250 | 7.4 | +1.9 | |
Labour | Adrian Field | 125 | 3.7 | +0.9 | |
Majority | 210 | 6.2 | |||
Turnout | 3413 | 54.0 | |||
Conservative hold | Swing | ||||
Party | Candidate | Votes | % | ±% | |
---|---|---|---|---|---|
Liberal Democrats | Ritchie Latham | 1,617 | 57.4 | +3.2 | |
Conservative | Henry Laferla | 700 | 24.9 | -9.3 | |
Independent | Alex Coles | 202 | 7.2 | N/A | |
Green | Richard Cannon | 172 | 6.1 | -1.7 | |
Labour | Steve Haines | 125 | 4.4 | +0.6 | |
Majority | 917 | 32.5 | |||
Turnout | 2816 | 41.9 | |||
Liberal Democrats gain from Conservative | Swing | ||||
Party | Candidate | Votes | % | ±% | |
---|---|---|---|---|---|
Green | Suzanne White | 1,717 | 51.5 | -11.6 | |
Conservative | Linda Gemmell | 960 | 28.8 | +2.9 | |
Liberal Democrats | Eric Bodger | 579 | 17.4 | +8.3 | |
Labour | Oliver Hirsch | 80 | 2.4 | +0.5 | |
Majority | 757 | 22.7 | |||
Turnout | 3336 | 44.4 | |||
Green gain from Conservative | Swing | ||||
Party | Candidate | Votes | % | ±% | |
---|---|---|---|---|---|
Liberal Democrats | Michael Bennett | 1,006 | 44.2 | +2.8 | |
Conservative | Mike Read* | 986 | 43.3 | -1.6 | |
Labour | Andrew Kirby | 147 | 6.5 | ±0.0 | |
Green | Elizabeth Riley | 136 | 6.0 | -1.3 | |
Majority | 20 | 0.9 | |||
Turnout | 2275 | 33.2 | |||
Liberal Democrats gain from Conservative | Swing | 25.0 | |||
Party | Candidate | Votes | % | ±% | |
---|---|---|---|---|---|
Liberal Democrats | Angela Clear* | 1,053 | 61.9 | +6.5 | |
Conservative | Denise Searle | 387 | 22.7 | -8.4 | |
Labour | Paul Sony | 137 | 8.0 | +3.8 | |
Green | Beata Parry | 125 | 7.3 | -2.0 | |
Majority | 666 | 39.2 | |||
Turnout | 1702 | 30.9 | |||
Liberal Democrats hold | Swing | ||||
Party | Candidate | Votes | % | ±% | |
---|---|---|---|---|---|
Liberal Democrats | Kelsie Learney* | 1,632 | 53.5 | -5.2 | |
Conservative | Antonia Cox | 891 | 29.2 | +2.3 | |
Green | Charlotte Harley | 365 | 12.0 | +3.4 | |
Labour | Lucy Sims | 164 | 5.4 | -0.4 | |
Majority | 741 | 24.3 | |||
Turnout | 3052 | 45.6 | |||
Liberal Democrats hold | Swing | ||||
Party | Candidate | Votes | % | ±% | |
---|---|---|---|---|---|
Liberal Democrats | John Tippett-Cooper* | 1,237 | 50.4 | -6.2 | |
Green | Lorraine Estelle | 589 | 24.0 | +12.1 | |
Conservative | Philip Hutchinson | 426 | 17.3 | -4.0 | |
Labour | Patrick Davies | 204 | 8.3 | -2.0 | |
Majority | 648 | 26.4 | |||
Turnout | 2456 | 38.9 | |||
Liberal Democrats hold | Swing | ||||
Party | Candidate | Votes | % | ±% | |
---|---|---|---|---|---|
Liberal Democrats | Jamie Scott* | 618 | 57.8 | +2.5 | |
Conservative | Ian Tait | 212 | 19.8 | -6.3 | |
Labour | Alison Cochrane | 142 | 13.3 | -0.2 | |
Green | Michael Perrott | 97 | 9.1 | +4.0 | |
Majority | 406 | 38.0 | |||
Turnout | 1069 | 28.5 | |||
Liberal Democrats gain from Conservative | Swing | ||||
Party | Candidate | Votes | % | ±% | |
---|---|---|---|---|---|
Liberal Democrats | Rachel Aron | 1,416 | 53.7 | -1.8 | |
Conservative | Leo Keay | 697 | 22.6 | -6.2 | |
Green | Richard Needham | 347 | 13.1 | +3.7 | |
Labour | Peter Marsh | 179 | 6.8 | +0.5 | |
Majority | 719 | 31.1 | |||
Turnout | 2639 | 41.9 | |||
Liberal Democrats hold | Swing | ||||
Party | Candidate | Votes | % | ±% | |
---|---|---|---|---|---|
Liberal Democrats | Chris Westwood* | 1,315 | 49.5 | -9.0 | |
Green | Giles Gooding | 699 | 26.3 | +12.6 | |
Conservative | Steve Russell | 453 | 17.0 | -2.4 | |
Labour | Stephen Turner | 191 | 7.2 | -1.2 | |
Majority | 616 | 23.2 | |||
Turnout | 2658 | 40.3 | |||
Liberal Democrats hold | Swing | ||||
Party | Candidate | Votes | % | ±% | |
---|---|---|---|---|---|
Liberal Democrats | Steve Cramoysan* | 1,275 | 55.3 | -3.3 | |
Conservative | Signe Biddle | 785 | 34.0 | +3.1 | |
Green | Andrew Pogson | 127 | 5.5 | +1.1 | |
Labour | Cameron Hodgkinson | 120 | 5.2 | -0.9 | |
Majority | 490 | 21.2 | |||
Turnout | 2307 | 43.2 | |||
Liberal Democrats hold | Swing | ||||
Party | Candidate | Votes | % | ±% | |
---|---|---|---|---|---|
Liberal Democrats | Vivian Achwal* | 1,112 | 48.2 | -15.9 | |
Conservative | Marcus Garth | 480 | 20.8 | -5.9 | |
Independent | Sean Whelan | 350 | 15.2 | N/A | |
Green | Kate Needham | 269 | 11.7 | +6.9 | |
Labour | Rosalind O`Shaughnessy | 94 | 4.1 | -0.3 | |
Majority | 632 | 27.4 | |||
Turnout | 2305 | 34.1 | |||
Liberal Democrats hold | Swing | ||||
Party | Candidate | Votes | % | ±% | |
---|---|---|---|---|---|
Conservative | Stephen Godfrey* | 1,423 | 49.6 | -2.8 | |
Liberal Democrats | Richard Murphy | 1222 | 42.6 | +4.3 | |
Green | Dee Wright | 157 | 5.5 | -1.0 | |
Labour | Antony de Peyer | 66 | 2.3 | -0.6 | |
Majority | 201 | 7.0 | |||
Turnout | 2868 | 49.2 | |||
Conservative hold | Swing | ||||
Winchester is a constituency in Hampshire represented in the House of Commons of the UK Parliament since 2010 by Steve Brine, a Conservative.
Winchester City Council is responsible for the local government of the City of Winchester in Hampshire, England. Despite its name, the City of Winchester is a local government district that stretches far beyond the urban area of Winchester, covering urban, suburban and rural areas.
The 2010 Winchester Council election took place on 6 May 2010 to elect members of Winchester District Council in Hampshire, England. One third of the council was up for election and the Liberal Democrats gained overall control of the council from the Conservative Party.
The 2003 Woking Council election took place on 1 May 2003 to elect members of Woking Borough Council in Surrey, England. One third of the council was up for election and the council stayed under no overall control.
The 2000 Winchester Council election took place on 4 May 2000 to elect members of Winchester District Council in Hampshire, England. One third of the council was up for election and the Liberal Democrats stayed in overall control of the council.
The 2002 Winchester Council election took place on 2 May 2002 to elect members of Winchester District Council in Hampshire, England.
The 2003 Winchester Council election took place on 1 May 2003 to elect members of Winchester District Council in Hampshire, England. One third of the council was up for election and the Liberal Democrats stayed in overall control of the council.
The 2007 Winchester Council election took place on 3 May 2007 to elect members of Winchester District Council in Hampshire, England. One third of the council was up for election and the Conservative Party stayed in overall control of the council.
The 2008 Winchester Council election took place on 1 May 2008 to elect members of Winchester District Council in Hampshire, England. One third of the council was up for election and the Conservative Party stayed in overall control of the council.
The 2012 Southampton Council election took place on Thursday 3 May 2012 to elect members of Southampton City Council in Hampshire, England. One third of the council was scheduled for election, whilst two additional vacancies, caused by the resignation of sitting councillors, were also filled in Bitterne Park and Peartree wards, meaning a total of 18 of the city's 48 seats were elected.
The 2015 Leeds City Council election took place on Thursday 7 May 2015 to elect members of Leeds City Council in England. It was held on the same day as the 2015 general election and other local elections across the UK.
The 2017 Hampshire County Council election took place on 4 May 2017 as part of the 2017 local elections in the United Kingdom. All councillors were elected from electoral divisions by first-past-the-post voting for a four-year term of office. The electoral divisions were somewhat changed from the previous election, with some being split, merged or with boundary changes. No elections were held in Portsmouth and Southampton, which are unitary authorities and hold their elections in other years. Similarly the districts within Hampshire did also not hold elections this year.
Elections to Southampton City Council took place on Thursday 2 May 2019, alongside other local elections across the country. The Labour Party held a narrow majority of two at the last election and the seats contested in this election were last contested in 2015. Labour were defending 6 seats, the Conservatives were defending 8, whilst independent councillors, who held two seats, were not standing re-elections. Following a by-election in the Coxford ward where Labour gained the seat formerly held by an independent.
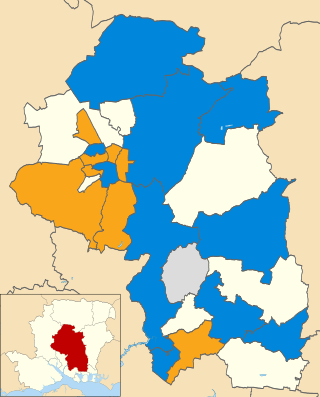
Elections to Winchester City Council took place on Thursday 2 May 2019, alongside other local elections across the country. The Conservatives Party held a narrow majority of one at the last election, with the seats contested in this election being last contested in 2016 election. The Conservatives defended 10 seats, whilst the Liberal Democrats defended 4. Town and parish councils in the city boundary were also up for election.
The 1991 Cardiff City Council election was held on Thursday 2 May 1991 to the district council of Cardiff in South Glamorgan, Wales. It took place on the same day as other district council elections in Wales and England. The Labour Party regained a majority on Cardiff City Council, after sharing government for the previous four years.
The 1966 Cardiff City Council election was held on Thursday 12 May 1966 to elect councillors to Cardiff City Council in Cardiff, Glamorgan, Wales. It took place on the same day as several other county borough elections in Wales and England.
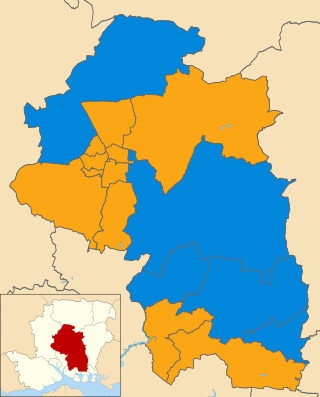
Elections to Winchester City Council took place on 6 May 2021 as part of the 2021 United Kingdom local elections. This took place at the same time as the elections for Hampshire County Council and the Hampshire Police and Crime Commissioner.
The 2022 Cardiff Council election took place on 5 May 2022 to elect 79 members to Cardiff Council. On the same day, elections were held to the other 21 local authorities and to community councils in Wales as part of the 2022 Welsh local elections.
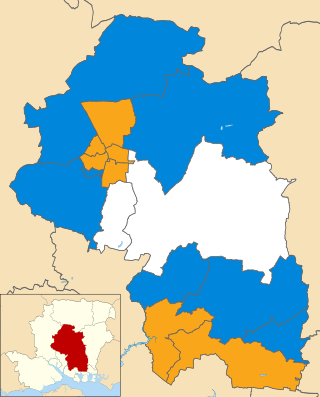
The 2023 Winchester City Council election took place on 4 May 2023 to elect members of Winchester City Council in Hampshire, England. This was on the same day as other local elections in England.
The 2024 Sefton Metropolitan Borough Council election took place on 2 May 2024 to elect members of Sefton Metropolitan Borough Council in Merseyside, England. This was on the same day as other local elections across England, Liverpool's City Region mayoral election and Merseyside's Police and Crime Commissioner election.