| |||||||||||||||||||
27 out of 78 seats to Newcastle City Council 40 seats needed for a majority | |||||||||||||||||||
---|---|---|---|---|---|---|---|---|---|---|---|---|---|---|---|---|---|---|---|
| |||||||||||||||||||
Winner of each seat at the 2024 Newcastle City Council election | |||||||||||||||||||
|
The 2024 Newcastle City Council election was held on Thursday 2 May 2024, alongside the other local elections in the United Kingdom being held on the same day. One-third of the 78 members of Newcastle City Council in Tyne and Wear were be elected, alongside a vacancy in Fawdon and West Gosforth ward. [1]
Newcastle is a strong council for the Labour Party. Labour controlled the council from its creation in 1973 until 2004, when the Liberal Democrats won a majority on the council. [2] Labour retook control in 2011, [3] and have maintained a majority at every subsequent election. In the previous election, Labour won 14 seats (down 3) with 41.9% of the vote, Liberal Democrats won 10 (up 2) with 27.8%, Newcastle Independents won 2 (up 1) with 4.7%, and independents won 1 with 4.2%.
The seats up for election in 2024 were last contested in 2021; because of the delay of all local elections due to the COVID-19 pandemic, the seats are up for election after 3 years rather than the usual 4. In that election, Labour won 18 seats (down 2) with 39.2%, Liberal Democrats won 6 with 19.5%, independents won 2 with 7.0%, and Newcastle Independents won 2 (up 2) with 6.8%.
After 2023 election | Before 2024 election [4] | After 2024 election | ||||||
---|---|---|---|---|---|---|---|---|
Party | Seats | Party | Seats | Party | Seats | |||
Labour | 48 | Labour | 46 | Labour | 45 | |||
Liberal Democrats | 23 | Liberal Democrats | 22 | Liberal Democrats | 23 | |||
Independent | 3 | Independent | 5 | Independent | 4 | |||
Newcastle Ind. | 4 | Newcastle Ind. | 3 | Newcastle Ind. | 3 | |||
Green | 0 | Green | 0 | Green | 2 | |||
Conservative | 0 | Conservative | 0 | Conservative | 1 |
Changes:
2024 Newcastle City Council election | ||||||||||
---|---|---|---|---|---|---|---|---|---|---|
Party | This election | Full council | This election | |||||||
Seats | Net | Seats % | Other | Total | Total % | Votes | Votes % | +/− | ||
Labour | 15 | 2 | 55.6 | 31 | 45 | 57.7 | ||||
Liberal Democrats | 7 | 25.9 | 16 | 23 | 29.5 | |||||
Independent | 1 | 1 | 3.7 | 3 | 4 | 5.1 | ||||
Newcastle Ind. | 1 | 3.7 | 2 | 3 | 3.8 | |||||
Communist | 0 | 0.0 | 0 | 0 | 0.0 | |||||
Conservative | 1 | 1 | 3.7 | 0 | 1 | 1.3 | ||||
Green | 2 | 2 | 7.4 | 0 | 2 | 2.6 | ||||
North East | 0 | 0.0 | 0 | 0 | 0.0 | |||||
SDP | 0 | 0.0 | 0 | 0 | 0.0 | |||||
TUSC | 0 | 0.0 | 0 | 0 | 0.0 | |||||
The Statement of Persons Nominated, which details the candidates standing in each ward, was released by Newcastle City Council following the close of nominations on 5 April 2024. [8] Sitting councillors standing for re-election are marked with an asterisk (*).
Party | Candidate | Votes | % | ±% | |
---|---|---|---|---|---|
Labour Co-op | Stephen Powers* | 819 | 50.5 | -18.6 | |
Independent | Rowshon Uddin | 396 | 24.4 | New | |
Green | Alistair Ford | 223 | 13.7 | -3.5 | |
Conservative | Maria Manco | 113 | 7.0 | -1.9 | |
Liberal Democrats | Christopher Howden | 71 | 4.4 | -0.4 | |
Rejected ballots | 18 | 1.1 | |||
Majority | 423 | 26.1 | |||
Turnout | 1,622 | 30.1 | |||
Registered electors | 5,387 | ||||
Labour Co-op hold | Swing | 20.8 | |||
Party | Candidate | Votes | % | ±% | |
---|---|---|---|---|---|
Labour | Rob Higgins* | 1,659 | 61.2 | -3.8 | |
Independent | David McGovern | 412 | 15.2 | New | |
Conservative | Ronald Thompson | 278 | 10.2 | -8.7 | |
Green | Lee Irving | 226 | 8.3 | +0.8 | |
Liberal Democrats | Hans Andersen | 138 | 5.1 | -3.5 | |
Rejected ballots | 31 | 1.1 | |||
Majority | 1,247 | 46.0 | |||
Turnout | 2,713 | 32.8 | |||
Registered electors | 8,269 | ||||
Labour hold | Swing | ||||
Party | Candidate | Votes | % | ±% | |
---|---|---|---|---|---|
Labour | Marion Williams* | 1,215 | 63.7 | +4.0 | |
Conservative | Thomas Lian-Hoare | 261 | 13.7 | +1.2 | |
Green | James Milne | 243 | 12.7 | +8.1 | |
Liberal Democrats | Bill Shepherd | 188 | 9.9 | +3.1 | |
Rejected ballots | 12 | 0.6 | |||
Majority | 954 | 50.0 | |||
Turnout | 1907 | 27.4 | |||
Registered electors | 6,955 | ||||
Labour hold | Swing | ||||
Party | Candidate | Votes | % | ±% | |
---|---|---|---|---|---|
Green | Nick Hartley | 1,291 | 56.8 | +19.1 | |
Labour | Carly Walker-Dawson | 808 | 35.6 | -13.8 | |
Conservative | Jamie Hampton | 115 | 6.8 | -0.3 | |
Liberal Democrats | Mark Ridyard | 57 | 2.5 | -3.4 | |
Rejected ballots | 30 | 1.3 | |||
Majority | 483 | 21.3 | |||
Turnout | 2,271 | 33.1 | |||
Registered electors | 6,857 | ||||
Green gain from Labour | Swing | ||||
Party | Candidate | Votes | % | ±% | |
---|---|---|---|---|---|
Labour Co-op | Linda Wright* | 1,535 | 50.8 | +9.1 | |
Conservative | Alexis Fernandes | 775 | 25.6 | +7.0 | |
Green | Idwal John | 475 | 15.7 | +3.4 | |
Liberal Democrats | Richard Morris | 239 | 7.9 | +1.4 | |
Rejected ballots | 32 | 1.1 | |||
Majority | 760 | 25.1 | |||
Turnout | 3,024 | 33.3 | |||
Registered electors | 9,093 | ||||
Labour Co-op hold | Swing | ||||
Party | Candidate | Votes | % | ±% | |
---|---|---|---|---|---|
Labour Co-op | Andrew Herridge | 1,509 | 40.3 | +3.2 | |
Liberal Democrats | Jamie Robinson | 1,422 | 37.9 | -5.3 | |
Conservative | Daniel Burnett | 463 | 12.4 | -0.4 | |
Green | Andrew Thorp | 354 | 9.4 | +2.5 | |
Rejected ballots | 37 | 1.0 | |||
Majority | 87 | 2.3 | |||
Turnout | 3,748 | 33.0 | |||
Registered electors | 11,341 | ||||
Labour Co-op gain from Liberal Democrats | Swing | ||||
Party | Candidate | Votes | % | ±% | |
---|---|---|---|---|---|
Independent | Lawrence Hunter* | 2,401 | 70.5 | -8.3 | |
Labour | Bill Purvis | 588 | 17.3 | +5.4 | |
Conservative | Ian Forster | 240 | 7.1 | +1.3 | |
Liberal Democrats | Judith Steen | 100 | 2.9 | +1.2 | |
Green | Philip Brookes | 75 | 2.2 | +0.4 | |
Rejected ballots | 19 | 0.6 | |||
Majority | 1,813 | 53.3 | |||
Turnout | 3,404 | 45.0 | |||
Registered electors | 7,565 | ||||
Independent hold | Swing | ||||
Party | Candidate | Votes | % | ±% | |
---|---|---|---|---|---|
Liberal Democrats | Karen Robinson* | 1,699 | 46.2 | -2.0 | |
Labour | Hilary Franks | 1,181 | 32.1 | -3.4 | |
Green | Laurence Taylor | 509 | 13.9 | +5.2 | |
Conservative | Gerry Langley | 285 | 7.8 | +0.2 | |
Majority | 518 | 14.1 | |||
Turnout | 3,674 | 49.9 | |||
Registered electors | 7,366 | ||||
Liberal Democrats hold | Swing | ||||
Party | Candidate | Votes | % | ±% | |
---|---|---|---|---|---|
Newcastle Ind. | Tracey Mitchell* | 1,232 | 45.7 | +0.3 | |
Labour Co-op | Vince Barry-Stanners | 1,112 | 41.2 | +0.7 | |
Conservative | Jack Luke | 166 | 6.2 | -0.7 | |
Green | William Whitaker | 102 | 3.8 | +0.7 | |
Liberal Democrats | Elizabeth Dicken | 86 | 3.2 | -0.8 | |
Rejected ballots | 12 | 0.4 | |||
Majority | 120 | 4.4 | |||
Turnout | 2,698 | 31.7 | |||
Registered electors | 8,524 | ||||
Newcastle Ind. hold | Swing | ||||
Party | Candidate | Votes | % | ±% | |
---|---|---|---|---|---|
Green | Khaled Musharraf | 1,190 | 45.4 | +31.3 | |
Labour | Nicu Ion* | 1,083 | 41.3 | -30.5 | |
Conservative | Tom Davison | 231 | 8.8 | -0.6 | |
Liberal Democrats | Hamed Aghajani | 117 | 4.5 | -0.2 | |
Rejected ballots | 27 | 1.0 | |||
Majority | 107 | 4.1 | |||
Turnout | 2,621 | 33.9 | |||
Registered electors | 7,739 | ||||
Green gain from Labour | Swing | ||||
Party | Candidate | Votes | % | ±% | |
---|---|---|---|---|---|
Liberal Democrats | John Hall | 1,604 | 30.5 | ||
Liberal Democrats | Rob Austin | 1,530 | 29.1 | ||
Labour | Gordana Franklin | 684 | 13.0 | ||
Labour | Asad Syed | 625 | 11.9 | ||
Green | Roger Whittaker | 395 | 7.5 | ||
Conservative | Alexander McMullen | 223 | 4.2 | ||
Conservative | Maria Piazza | 200 | 3.8 | ||
Rejected ballots | 23 | 0.4 | |||
Majority | 846 | 16.1 | |||
Turnout | 5,261 | ||||
Registered electors | 7,436 | ||||
Liberal Democrats hold | Swing | ||||
Party | Candidate | Votes | % | ±% | |
---|---|---|---|---|---|
Conservative | Doc Anand | 1,399 | 33.7 | +0.4 | |
Liberal Democrats | Tahir Siddique | 1,288 | 31.0 | -8.0 | |
Labour Co-op | Michael Bell | 952 | 22.9 | +1.1 | |
Green | Frances Hinton | 350 | 8.4 | +2.5 | |
North East | Brian Moore | 160 | 3.9 | New | |
Rejected ballots | 17 | 0.4 | |||
Majority | 111 | 2.7 | |||
Turnout | 4,149 | 53.8 | |||
Registered electors | 7,715 | ||||
Conservative gain from Liberal Democrats | Swing | ||||
Party | Candidate | Votes | % | ±% | |
---|---|---|---|---|---|
Labour Co-op | Clare Penny-Evans* | 1,543 | 44.5 | -4.5 | |
Green | Andrew Gray | 671 | 19.4 | -2.7 | |
Independent | Chandni Chopra | 525 | 15.1 | New | |
Liberal Democrats | Tom Appleby | 494 | 14.3 | -6.8 | |
Conservative | John Dobie | 162 | 4.7 | -0.8 | |
Communist | Steve Handford | 71 | 2.0 | -0.3 | |
Rejected ballots | 14 | 0.4 | |||
Majority | 872 | 25.2 | |||
Turnout | 3,466 | 46.2 | |||
Registered electors | 7,497 | ||||
Labour Co-op hold | Swing | ||||
Party | Candidate | Votes | % | ±% | |
---|---|---|---|---|---|
Labour | Stephen Lambert* | 1,647 | 65.3 | +10.2 | |
Liberal Democrats | Craig Austin | 332 | 13.2 | -10.0 | |
Green | Adam Jackson | 274 | 10.9 | +3.3 | |
Conservative | Zak Mudie | 192 | 7.6 | -3.5 | |
TUSC | Nick Fray | 78 | 3.1 | +0.2 | |
Rejected ballots | 28 | 1.1 | |||
Majority | 1,315 | 52.1 | |||
Turnout | 2,523 | 34.2 | |||
Registered electors | 7,382 | ||||
Labour hold | Swing | ||||
Party | Candidate | Votes | % | ±% | |
---|---|---|---|---|---|
Labour | Alexander Hay* | 1,364 | 65.0 | -1.8 | |
Conservative | Amy Laverick | 345 | 16.4 | +0.8 | |
Liberal Democrats | David Partington | 243 | 11.6 | -0.5 | |
Green | Tahir Mahmood | 147 | 7.0 | +1.5 | |
Rejected ballots | 30 | 1.4 | |||
Majority | 1,019 | 48.5 | |||
Turnout | 2,099 | 30.1 | |||
Registered electors | 6,981 | ||||
Labour hold | Swing | ||||
Party | Candidate | Votes | % | ±% | |
---|---|---|---|---|---|
Labour Co-op | Stephen Barry-Stanners | 1,018 | 45.1 | +6.0 | |
Newcastle Ind. | Zoey Saul | 800 | 35.5 | -10.4 | |
Conservative | Jack Donalson | 196 | 8.7 | +0.4 | |
Liberal Democrats | Tracy Connell | 122 | 5.4 | +2.0 | |
Green | Pat McGee | 119 | 5.3 | +2.1 | |
Rejected ballots | 14 | 0.6 | |||
Majority | 218 | 9.7 | |||
Turnout | 2,255 | 31.7 | |||
Registered electors | 7,112 | ||||
Labour gain from Newcastle Ind. | Swing | ||||
Party | Candidate | Votes | % | ±% | |
---|---|---|---|---|---|
Liberal Democrats | Greg Stone* | 1,816 | 56.4 | +2.8 | |
Labour | Bradley Aird | 836 | 26.0 | -3.3 | |
Green | Mike Rabley | 405 | 12.6 | +4.4 | |
Conservative | Antonio Manco | 161 | 5.0 | -3.9 | |
Rejected ballots | 20 | 0.6 | |||
Majority | 980 | 30.4 | |||
Turnout | 3,218 | 45.3 | |||
Registered electors | 7,101 | ||||
Liberal Democrats hold | Swing | ||||
Party | Candidate | Votes | % | ±% | |
---|---|---|---|---|---|
Labour | Nabeela Ali | 804 | 56.9 | -6.3 | |
Green | Jessica Whitaker | 343 | 24.3 | +7.3 | |
Conservative | Richard Sanderson | 141 | 10.0 | -1.2 | |
Liberal Democrats | Craig Dodd | 125 | 8.8 | +0.2 | |
Rejected ballots | 24 | 1.7 | |||
Majority | 461 | 32.6 | |||
Turnout | 1,413 | 26.9 | |||
Registered electors | 5,255 | ||||
Labour hold | Swing | ||||
Party | Candidate | Votes | % | ±% | |
---|---|---|---|---|---|
Liberal Democrats | James Coles | 995 | 48.1 | -17.0 | |
Labour Co-op | Killian McCartney | 683 | 33.0 | +5.1 | |
Green | Shehla Naqvi | 262 | 12.7 | +3.9 | |
Conservative | Stephen Dawes | 127 | 6.1 | +2.2 | |
Rejected ballots | 10 | 0.5 | |||
Majority | 312 | 15.1 | |||
Turnout | 2,067 | 46.1 | |||
Registered electors | 4,484 | ||||
Liberal Democrats gain from Labour | Swing | ||||
Party | Candidate | Votes | % | ±% | |
---|---|---|---|---|---|
Labour Co-op | Alistair Chisholm* | 1,054 | 48.4 | +10.7 | |
Liberal Democrats | Fiona Punchard | 762 | 35.0 | -14.7 | |
Green | Gabriella Leavitt | 318 | 14.6 | +4.6 | |
Conservative | Marie Summersby | 44 | 2.0 | -0.6 | |
Rejected ballots | 23 | 1.1 | |||
Majority | 292 | 13.4 | |||
Turnout | 2,178 | 40.3 | |||
Registered electors | 5,411 | ||||
Labour Co-op hold | Swing | ||||
Party | Candidate | Votes | % | ±% | |
---|---|---|---|---|---|
Liberal Democrats | Pauline Allen* | 2,207 | 53.0 | -1.2 | |
Labour Co-op | Christopher Bartlett | 999 | 24.0 | +1.4 | |
Green | Audrey MacNaughton | 548 | 13.2 | +3.6 | |
Conservative | Andrew Burnett | 409 | 9.8 | -3.8 | |
Rejected ballots | 29 | 0.7 | |||
Majority | 1208 | 29.0 | |||
Turnout | 4,163 | 46.8 | |||
Registered electors | 8,900 | ||||
Liberal Democrats hold | Swing | ||||
Party | Candidate | Votes | % | ±% | |
---|---|---|---|---|---|
Labour Co-op | Milo Barnett | 900 | 42.1 | -3.4 | |
Liberal Democrats | Aidan King | 548 | 25.6 | -0.6 | |
Green | Sarah Peters | 454 | 21.2 | +7.4 | |
Conservative | Jennifer Mills | 183 | 8.6 | -1.2 | |
SDP | Martin Evison | 52 | 2.4 | -2.3 | |
Rejected ballots | 18 | 0.8 | |||
Majority | 352 | 16.5 | |||
Turnout | 2,137 | 40.5 | |||
Registered electors | 5,271 | ||||
Labour Co-op hold | Swing | ||||
Party | Candidate | Votes | % | ±% | |
---|---|---|---|---|---|
Labour | David Wood* | 1,257 | 69.8 | -0.5 | |
Conservative | Alex Walker | 232 | 12.9 | -0.3 | |
Green | Matt Williams | 169 | 9.4 | +3.9 | |
Liberal Democrats | Stephen Psallidas | 143 | 7.9 | +2.2 | |
Rejected ballots | 21 | 1.2 | |||
Majority | 1,025 | 56.9 | |||
Turnout | 1,801 | 25.5 | |||
Registered electors | 7,064 | ||||
Labour hold | Swing | ||||
Party | Candidate | Votes | % | ±% | |
---|---|---|---|---|---|
Labour | Maureen Lowson* | 1,582 | 58.6 | -1.0 | |
Green | Margaret Montgomery | 471 | 17.4 | +11.3 | |
Conservative | Stephen Oxborough | 324 | 12.0 | -0.5 | |
Liberal Democrats | Matthew Osbourn | 323 | 12.0 | -4.4 | |
Rejected ballots | 33 | 1.2 | |||
Majority | 1,111 | 41.1 | |||
Turnout | 2,700 | 32.4 | |||
Registered electors | 8,325 | ||||
Labour hold | Swing | ||||
Party | Candidate | Votes | % | ±% | |
---|---|---|---|---|---|
Liberal Democrats | Mark Mitchell | 1,250 | 46.9 | +1.6 | |
Labour Co-op | Ian Tokell* | 908 | 34.0 | +0.7 | |
Green | Tim Dowson | 317 | 11.9 | +3.0 | |
Conservative | Syed Ahmed | 193 | 7.2 | -5.2 | |
Rejected ballots | 37 | 1.4 | |||
Majority | 342 | 12.8 | |||
Turnout | 2,668 | 36.5 | |||
Registered electors | 7,304 | ||||
Liberal Democrats gain from Labour Co-op | Swing | ||||
Party | Candidate | Votes | % | ±% | |
---|---|---|---|---|---|
Labour | Irim Ali* | 1,211 | 39.5 | -27.8 | |
Independent | Younes Mohammed | 971 | 31.7 | New | |
Green | John Pearson | 468 | 15.3 | +1.2 | |
Conservative | Jarred Riley | 223 | 7.3 | -3.3 | |
Liberal Democrats | Colin Steen | 192 | 6.3 | -1.7 | |
Rejected ballots | 26 | 0.8 | |||
Majority | 240 | 7.8 | |||
Turnout | 3,065 | 41.6 | |||
Registered electors | 7,361 | ||||
Labour hold | Swing | ||||
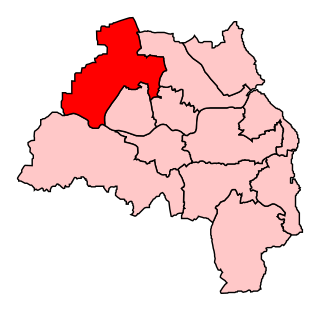
Newcastle upon Tyne North is a constituency represented in the House of Commons of the UK Parliament since 2010 by Catherine McKinnell of the Labour Party.
Newcastle City Council is the local authority for Newcastle upon Tyne, a metropolitan borough with city status in the ceremonial county of Tyne and Wear in North East England. The council consists of 78 councillors, three for each of the 26 wards in the city. It has been under Labour majority control since 2011. The council is a constituent member of the North East Mayoral Combined Authority.
(Kingston upon) Hull City Council is the governing body for the unitary authority and city of Kingston upon Hull. It was created in 1972 as the successor to the Corporation of Hull, which was also known as the Hull Corporation and founded in 1440 by royal charter.
The 2007 Sunderland Council election took place on 3 May 2007 to elect members of Sunderland Metropolitan Borough Council in Tyne and Wear, England. One third of the council was up for election and the Labour Party stayed in overall control of the council.
The 2012 Cardiff Council election took place on Thursday 3 May 2012 to elect members of Cardiff Council in Wales. This was the same day as the national 2012 Welsh local elections. It was preceded by the 2008 election and followed by the 2017 election
The North East Party (NEP) is a regionalist political party in North East England founded in 2014 by a group of 16 people including the former Labour MP; Hilton Dawson, and 7 members of the FAIR party. The party campaigns for a better deal for North East England generally and was committed to a devolved assembly in the North East with powers similar to those in Wales, Scotland and Northern Ireland, if approved by a referendum. It says bodies such as the North East Combined Authority do not have a mandate to take on new responsibilities and representatives must be directly-elected. Dawson stepped down as Chair of the party in June 2016 and was replaced by John Tait. Dawson remained active in the party taking on the role of Secretary and Nominating Officer.
The 2015 Newcastle City Council Council election took place on 7 May 2015 to elect one third of the members of Newcastle City Council in England. The elections took place on the same day as other local elections.
The 2016 Newcastle City Council Council elections took place on 5 May 2016 to elect one third of the members of Newcastle City Council in England. The elections took place on the same day as other local elections.
The 2018 Sunderland City Council election took place on 3 May 2018 to elect members of Sunderland City Council in England. The election took place on the same day as other local elections.
The 1973 Tyne and Wear County Council election was held on 12 April 1973 as part of the first elections to the new local authorities established by the Local Government Act 1972 in England and Wales. 104 councillors were elected from 95 electoral divisions across the region's five boroughs. Each division returned either one or two county councillors each by First-past-the-post voting for a four-year term of office. The election took place ahead of the elections to the area's metropolitan borough councils, which followed on 10 May 1973.
The 2022 Birmingham City Council election took place on 5 May 2022, with all 101 council seats up for election across 37 single-member and 32 two-member wards. The election was held alongside other local elections across Great Britain and town council elections in Sutton Coldfield.
The 2022 Cardiff Council election took place on 5 May 2022 to elect 79 members to Cardiff Council. On the same day, elections were held to the other 21 local authorities and to community councils in Wales as part of the 2022 Welsh local elections.
Elections to The Highland Council were held on 5 May 2022, the same day as the 31 other Scottish local government elections. As with other Scottish council elections, it was held using single transferable vote (STV) – a form of proportional representation – in which multiple candidates are elected in each ward and voters rank candidates in order of preference.
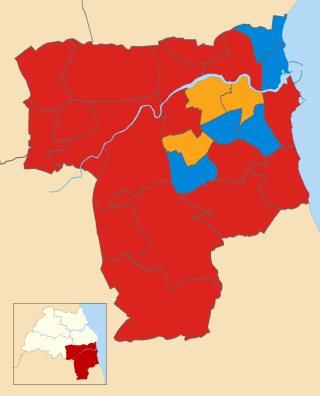
The 2022 Newcastle City Council election took place on 5 May 2022. One third of councillors — 26 out of 78 — on Newcastle City Council were elected. The election took place alongside other local elections across the United Kingdom.
Elections to Colchester Borough Council took place on 5 May 2022. Eighteen members of the council were elected: one from 16 of the 17 wards, and two councillors from New Town & Christ Church ward, following the death of incumbent councillor Nick Cope, elected in 2019 and due to serve until 2023.
Elections to Aberdeenshire Council took place on Thursday 5 May 2022 on the same day as the 31 other Scottish local government elections. As with other Scottish council elections, it was held using single transferable vote (STV) – a form of proportional representation – in which multiple candidates are elected in each ward and voters rank candidates in order of preference.
The 2024 Barnsley Metropolitan Borough Council election was held on Thursday 2 May 2024, alongside the other local elections across the United Kingdom being held on the same day.
The 2024 Blackburn with Darwen Borough Council election took place on Thursday 2 May 2024, alongside the other local elections in the United Kingdom being held on the same day, to elect one-third of the 51 members of Blackburn with Darwen Borough Council in Lancashire.
The 2024 Sheffield City Council election took place on Thursday 2 May 2024, alongside the other local elections in the United Kingdom being held on the same day. One-third of the 84 members of Sheffield City Council in South Yorkshire was elected, alongside a vacancy in Firth Park ward.