| |||||||||||||||||||||||||||||||||||||||||||||
All 39 seats to Stevenage Borough Council 20 seats needed for a majority | |||||||||||||||||||||||||||||||||||||||||||||
---|---|---|---|---|---|---|---|---|---|---|---|---|---|---|---|---|---|---|---|---|---|---|---|---|---|---|---|---|---|---|---|---|---|---|---|---|---|---|---|---|---|---|---|---|---|
| |||||||||||||||||||||||||||||||||||||||||||||
Winner of each seat at the 2024 Stevenage Borough Council election | |||||||||||||||||||||||||||||||||||||||||||||
|
The 2024 Stevenage Borough Council election was held on Thursday 2 May 2024, alongside the other local elections in the United Kingdom being held on the same day. [1] All 39 members of Stevenage Borough Council in Hertfordshire were elected following boundary changes. [2] [3]
The election saw the Conservatives nearly wiped out of the council entirely, with them only holding onto one seat in Woodfield. [4] [5] All of their other seats went to the Labour Party. The Liberal Democrats held on to all their seats, becoming the official opposition in Stevenage. [6] No other party made any notable impact or gains in the results.
Woodfield ward saw the rare outcome where two candidates drew on the number of received votes. Labour candidate Robert Boyle and incumbent Conservative councillor Margaret Notley both received 571 votes and had to draw lots to determine who won, with Robert winning. [7]
2024 Stevenage Borough Council election | ||||||||||
---|---|---|---|---|---|---|---|---|---|---|
Party | Candidates | Seats | Gains | Losses | Net gain/loss | Seats % | Votes % | Votes | +/− | |
Labour | 39 | 32 | 7 | 0 | 8 | 82.0 | 51.8 | 26,842 | +7.7 | |
Liberal Democrats | 20 | 6 | 0 | 0 | 15.4 | 17.1 | 8,862 | -1.7 | ||
Conservative | 21 | 1 | 0 | 7 | 8 | 2.6 | 19.2 | 9,949 | -9.6 | |
Green | 14 | 0 | 0 | 0 | 0.0 | 7.6 | 3,924 | +2.5 | ||
Reform UK | 7 | 0 | 0 | 0 | 0.0 | 2.8 | 1,479 | +2.5 | ||
TUSC | 9 | 0 | 0 | 0 | 0.0 | 1.5 | 770 | -0.3 |
The Statement of Persons Nominated, which details the candidates standing in each ward, was released by Stevenage Borough Council following the close of nominations on 8 April 2024. [8] The results were published by the council the day after the election. [9]
Party | Candidate | Votes | % | ±% | |
---|---|---|---|---|---|
Labour Co-op | Lin Martin-Haugh* | 834 | 52.7 | ||
Labour Co-op | Tom Plater | 814 | 51.5 | ||
Labour Co-op | Jeannette Thomas* | 783 | 49.5 | ||
Conservative | Nicolaas Houps | 469 | 29.6 | ||
Green | Paul Dawson | 447 | 28.3 | ||
Liberal Democrats | Richard Phillip Reece | 356 | 22.5 | ||
Turnout | 1,582 | 29.14 | |||
Registered electors | 5,460 | ||||
Labour Co-op win (new seat) | |||||
Labour Co-op win (new seat) |
Party | Candidate | Votes | % | ±% | |
---|---|---|---|---|---|
Labour Co-op | Jim Brown* | 749 | 42.0 | ||
Labour Co-op | Jade Woods | 701 | 39.3 | ||
Labour Co-op | Kamal Choudhury | 689 | 38.7 | ||
Conservative | David Denny-Stubbs | 530 | 29.7 | ||
Conservative | Victoria Facey | 508 | 28.5 | ||
Conservative | Matthew Wyatt | 462 | 25.9 | ||
Liberal Democrats | Charles Littleton | 271 | 15.2 | ||
Reform UK | Michael Hearn | 266 | 14.9 | ||
Liberal Democrats | Peter Wilkins | 252 | 14.1 | ||
Liberal Democrats | Riad Mannan | 218 | 12.2 | ||
Green | Adrian Busolini | 183 | 10.3 | ||
TUSC | Mark Pickersgill | 62 | 3.5 | ||
Turnout | 1,782 | 32.49 | |||
Registered electors | 5,501 | ||||
Labour Co-op win (new seat) | |||||
Labour Co-op win (new seat) |
Party | Candidate | Votes | % | ±% | |
---|---|---|---|---|---|
Labour Co-op | Conor McGrath* | 887 | 59.9 | ||
Labour Co-op | Nazmin Chowdhury* | 830 | 56.0 | ||
Labour Co-op | Ellie Plater* | 786 | 53.1 | ||
Conservative | Cathy Bibby | 367 | 24.8 | ||
Liberal Democrats | Christopher Berry | 296 | 20.0 | ||
Green | Steven Hodges | 282 | 19.0 | ||
TUSC | Steve Glennon | 109 | 7.4 | ||
Turnout | 1,481 | 27.30 | |||
Registered electors | 5,451 | ||||
Labour Co-op hold | |||||
Party | Candidate | Votes | % | ±% | |
---|---|---|---|---|---|
Liberal Democrats | Julie Ashley-Wren* | 741 | 47.3 | ||
Liberal Democrats | Tom Wren* | 738 | 47.2 | ||
Liberal Democrats | Stephen Booth* | 598 | 38.2 | ||
Labour | John Lloyd | 509 | 32.5 | ||
Labour | Patrick Newman | 460 | 29.4 | ||
Labour | Thea Pendlebury | 448 | 28.6 | ||
Conservative | Christine Clarkson | 290 | 18.5 | ||
Green | David Ingarfill | 212 | 13.5 | ||
Turnout | 1,565 | 28.47 | |||
Registered electors | 5,518 | ||||
Liberal Democrats hold | |||||
Party | Candidate | Votes | % | ±% | |
---|---|---|---|---|---|
Labour Co-op | Peter Clark | 700 | 39.0 | ||
Labour Co-op | Lynda Guy | 663 | 36.9 | ||
Labour Co-op | Akin Elekolusi | 593 | 33.0 | ||
Conservative | Alex Farquharson* | 590 | 32.9 | ||
Conservative | Adam Mitchell* | 571 | 31.8 | ||
Conservative | Bret Facey* | 568 | 31.6 | ||
Green | Jim Borcherds | 491 | 27.3 | ||
Reform UK | Matthew Hurst | 193 | 10.7 | ||
Reform UK | Doug Bainbridge | 191 | 10.6 | ||
Liberal Democrats | Matthew Snell | 180 | 10.0 | ||
Reform UK | Philip Durling | 164 | 9.1 | ||
TUSC | Helen Kerr | 48 | 2.7 | ||
Turnout | 1,796 | 36.78 | |||
Registered electors | 4,891 | ||||
Labour Co-op gain from Conservative | |||||
Labour Co-op gain from Conservative |
Party | Candidate | Votes | % | ±% | |
---|---|---|---|---|---|
Liberal Democrats | Robin Parker* | 1,122 | 61.8 | ||
Liberal Democrats | Andy McGuinness* | 1,077 | 59.3 | ||
Liberal Democrats | Graham Snell* | 1,023 | 56.3 | ||
Labour | Louisa Barr | 397 | 21.8 | ||
Labour | Maureen McKay* | 357 | 19.6 | ||
Labour | Peter Taylor | 328 | 18.1 | ||
Conservative | Andy Goldsmith | 311 | 17.1 | ||
Green | Ashlee Hodson | 189 | 10.4 | ||
Turnout | 1,817 | 33.26 | |||
Registered electors | 5,487 | ||||
Liberal Democrats hold | |||||
Party | Candidate | Votes | % | ±% | |
---|---|---|---|---|---|
Labour Co-op | Myla Arceno* | 798 | 51.0 | ||
Labour Co-op | Lloyd Briscoe* | 751 | 48.0 | ||
Labour Co-op | Carolina Veres* | 717 | 45.8 | ||
Conservative | Andy Facey | 421 | 26.9 | ||
Reform UK | Janet Bainbridge | 267 | 17.1 | ||
Reform UK | Robert Henry | 252 | 16.1 | ||
Green | Chris Hodson | 238 | 15.2 | ||
Liberal Democrats | Anthony Segadelli | 228 | 14.6 | ||
Green | Naomi Lovelace-Collins | 203 | 13.0 | ||
TUSC | Mark Gentleman | 61 | 3.9 | ||
Turnout | 1,564 | 30.88 | |||
Registered electors | 5,077 | ||||
Labour Co-op hold | |||||
Party | Candidate | Votes | % | ±% | |
---|---|---|---|---|---|
Labour Co-op | Coleen Houlihan | 733 | 49.6 | ||
Labour Co-op | Nigel Williams | 665 | 45.0 | ||
Labour Co-op | Mason Humberstone* | 661 | 44.7 | ||
Conservative | Harry Curtis | 523 | 35.4 | ||
Conservative | Maria Wheeler | 504 | 34.1 | ||
Conservative | Rambhai Malavia | 433 | 29.3 | ||
Green | Andy Whitmore | 301 | 20.4 | ||
Liberal Democrats | Andrew Anderson | 226 | 15.3 | ||
TUSC | Mark Kerr | 69 | 4.7 | ||
Turnout | 1,479 | 35.70 | |||
Registered electors | 4,179 | ||||
Labour Co-op hold | |||||
Labour Co-op gain from Conservative |
Party | Candidate | Votes | % | ±% | |
---|---|---|---|---|---|
Labour Co-op | Anne Wells* | 727 | 52.9 | ||
Labour Co-op | Forhad Chowdhury* | 701 | 51.1 | ||
Labour Co-op | Alistair Gordon | 701 | 51.1 | ||
Conservative | Nick Leech | 433 | 31.5 | ||
Liberal Democrats | Nigel Bye | 310 | 22.6 | ||
Green | Pawel Gora | 286 | 20.8 | ||
TUSC | Bryan Clare | 92 | 6.7 | ||
Turnout | 1,373 | 27.48 | |||
Registered electors | 5,040 | ||||
Labour Co-op hold | |||||
Labour Co-op gain from Conservative |
Party | Candidate | Votes | % | ±% | |
---|---|---|---|---|---|
Labour Co-op | Rob Broom* | 737 | 60.8 | ||
Labour Co-op | Sarah Mead* | 733 | 60.4 | ||
Labour Co-op | Simon Speller* | 665 | 54.8 | ||
Conservative | Celia Lawrence | 289 | 23.8 | ||
Liberal Democrats | David Barks | 219 | 18.1 | ||
Green | Stephani Mok | 209 | 17.2 | ||
TUSC | Barbara Clare | 100 | 8.2 | ||
Turnout | 1,213 | 25.30 | |||
Registered electors | 4,841 | ||||
Labour Co-op hold | |||||
Party | Candidate | Votes | % | ±% | |
---|---|---|---|---|---|
Labour Co-op | Sandra Barr* | 1,052 | 62.7 | ||
Labour Co-op | Richard Henry* | 962 | 57.3 | ||
Labour Co-op | Claire Parris* | 938 | 55.9 | ||
Conservative | Mel Mitchell | 407 | 24.3 | ||
Green | Chris Keane | 305 | 18.2 | ||
Liberal Democrats | Hazel Jones | 260 | 15.5 | ||
TUSC | Amber Gentleman | 128 | 7.6 | ||
Turnout | 1,678 | 31.07 | |||
Registered electors | 5,433 | ||||
Labour Co-op hold | |||||
Party | Candidate | Votes | % | ±% | |
---|---|---|---|---|---|
Labour Co-op | Jackie Hollywell* | 787 | 53.4 | ||
Labour Co-op | Loraine Rossati* | 666 | 45.2 | ||
Labour Co-op | Ceara Roopchand | 627 | 42.6 | ||
Conservative | Jack Ingarfill | 519 | 35.2 | ||
Green | Becca Watts | 351 | 23.8 | ||
Liberal Democrats | Clive Hearmon | 316 | 21.5 | ||
TUSC | Trevor Palmer | 101 | 6.9 | ||
Turnout | 1,473 | 32.16 | |||
Registered electors | 4,608 | ||||
Labour Co-op hold | |||||
Party | Candidate | Votes | % | ±% | |
---|---|---|---|---|---|
Conservative | Phil Bibby* | 624 | 40.7 | ||
Labour | Leanne Brady | 602 | 39.2 | ||
Labour | Robert Boyle | 571 [lower-alpha 1] | 37.2 | ||
Conservative | Margaret Notley* | 571 | 37.2 | ||
Conservative | Jody Hanafin | 559 | 36.4 | ||
Labour | Swantantra Tripathi | 520 | 33.9 | ||
Liberal Democrats | Jill Brinkworth | 227 | 14.8 | ||
Green | Richard Warr | 227 | 14.8 | ||
Liberal Democrats | Neil Brinkworth | 204 | 13.3 | ||
Reform UK | Amodio Amato | 146 | 9.5 | ||
Turnout | 1,535 | 38.15 | |||
Registered electors | 4,037 | ||||
Conservative hold | |||||
Labour gain from Conservative | |||||
Labour gain from Conservative |
Wirral West is a constituency represented in the House of Commons of the UK Parliament by Margaret Greenwood of the Labour Party since 2015.
Stevenage is a constituency in Hertfordshire represented in the House of Commons of the UK Parliament since 2010 by Stephen McPartland, a member of the Conservative Party.
Stevenage Borough Council is the local authority for the Stevenage non-metropolitan district of England, the United Kingdom. Stevenage is located in the north-east of Hertfordshire, in the East of England region.
Elections for London Borough of Hackney Council were held on Thursday 6 May 2010. The whole council was up for election. Hackney is divided into 19 wards, each electing 3 councillors, so a total of 57 seats were up for election.
The 2006 Rushmoor Council election took place on 4 May 2006 to elect members of Rushmoor Borough Council in Hampshire, England. One third of the council was up for election and the Conservative Party stayed in overall control of the council.
The 2007 Swindon Borough Council election took place on 4 May 2007 to elect members of Swindon Unitary Council in Wiltshire, England. One third of the council was up for election and the Conservative Party stayed in overall control of the council.
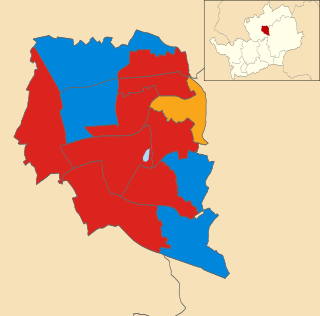
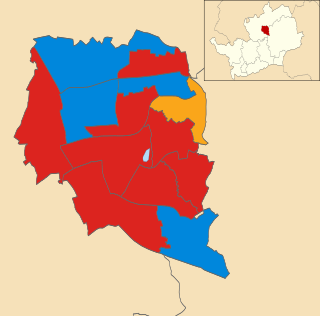
Elections to Stevenage Council were held on 6 May 2010. One third of the council stood for election; the seats which were last contested in 2006. The election saw the Conservative Party gain a further 3 seats.
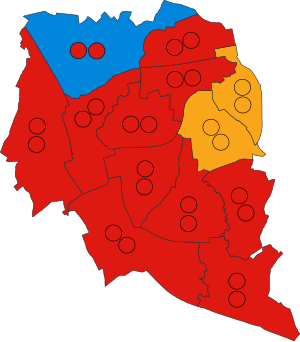
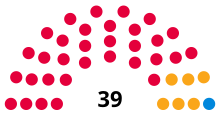
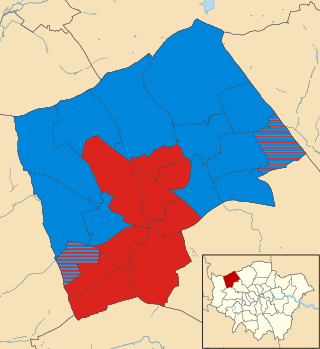
The by-thirds 2015 Stevenage Borough Council election was held on 7 May 2015 to elect one third (thirteen) of the members (councillors) of the council, one for each ward, as part of the 2015 United Kingdom local elections held simultaneously with the 2015 General Election. The up for election were last contested in 2011. The Labour Party retained control of the council, which it had held continuously since 1973.
The 2018 Lambeth London Borough Council election took place on 3 May 2018 alongside other local elections in London, to elect members of Lambeth London Borough Council in England. The election saw Labour remain in control of Lambeth Council with a slightly reduced majority, winning over 90% of the seats. The Green Party achieved its best-ever result in the borough, winning five seats and becoming the official opposition and the largest Green group in London.
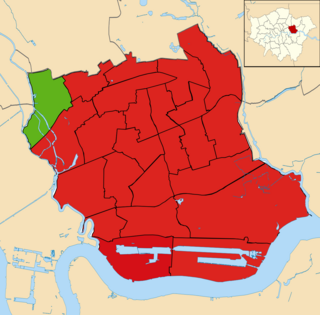
The 2022 Barking and Dagenham London Borough Council election took place on 5 May 2022. All 51 members of Barking and Dagenham London Borough Council were elected. The elections took place alongside local elections in the other London boroughs and elections to local authorities across the United Kingdom.
The 2022 Barnet London Borough Council election took place on 5 May 2022, alongside local elections in the other London boroughs and elections to local authorities across the United Kingdom. All 63 members of Barnet London Borough Council were elected. The Labour Party took overall control, winning 41 of the seats to the Conservative Party's 22. This was the first time Labour had won the council outright; previously, the Conservatives had always won the most seats, usually with an overall majority.
The 2022 Bromley London Borough Council election took place on 5 May 2022. All 58 members of Bromley London Borough Council were elected. The elections took place alongside local elections in the other London boroughs and elections to local authorities across the United Kingdom.
The 2022 Harrow London Borough Council election took place on 5 May 2022. All 55 members of Harrow London Borough Council were elected. The elections took place alongside local elections in the other London boroughs and elections to local authorities across the United Kingdom.
The 2022 Hounslow London Borough Council election took place on 5 May 2022. All 62 members of Hounslow London Borough Council were elected. The elections took place alongside local elections in the other London boroughs and elections to local authorities across the United Kingdom.
The 2022 Kensington and Chelsea London Borough Council election was held on 5 May 2022. All 50 members of Kensington and Chelsea London Borough Council were elected. The elections took place alongside local elections in the other London boroughs and elections to local authorities across the United Kingdom.
The 2022 Lambeth London Borough Council election took place on 5 May 2022. All 63 members of Lambeth London Borough Council were elected. The elections took place alongside local elections in the other London boroughs and elections to local authorities across the United Kingdom.
The 2022 Newham London Borough Council election took place on 5 May 2022. All 66 members of Newham London Borough Council were elected. The election took place alongside local elections in the other London boroughs and elections to local authorities across the United Kingdom.
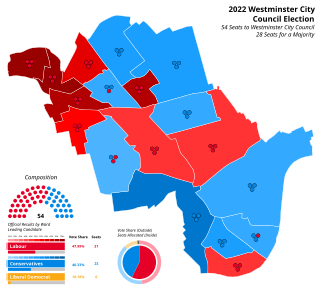
The 2022 Westminster City Council election took place on 5 May 2022. All 54 members of Westminster City Council have been elected. The elections took place alongside local elections in the other London boroughs and elections to local authorities across the United Kingdom.
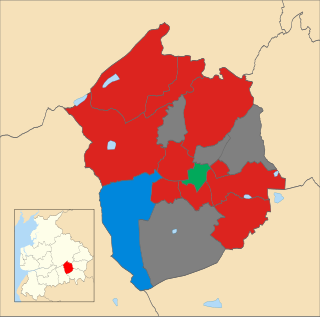
The 2022 Calderdale Metropolitan Borough Council election took place on 5 May 2022 to elect members of Calderdale Metropolitan Borough Council in England. One third of councillors — 17 out of 51, plus one vacancy in Ovenden ward were up for election. The election took place alongside other local elections across the United Kingdom.
A by-thirds Hyndburn Borough Council local election was held on Thursday 2 May 2024. Approximately one third of the local council's 35 seats fell up for election on that day.