2023 Dacorum Borough Council election

Last updated
2023 Dacorum Borough Council election
FlagOfHertfordshire.PNG
  2019 4 May 2023 (2023-05-04)2027 

All 51 seats to Dacorum Borough Council
26 seats needed for a majority
 First partySecond party
  No image wide.svg No image wide.svg
LeaderRon TindallAndrew Williams
Party Liberal Democrats Conservative
Last election19 seats, 31.7%31 seats, 42.8%
Seats before1931
Seats won2818
Seat changeIncrease2.svg 9Decrease2.svg 13
Popular vote33,07727,174
Percentage42.3%34.8%
SwingIncrease2.svg 10.6%Decrease2.svg 8.0%

 Third partyFourth party
  No image wide.svg No image wide.svg
Party Labour Independent
Last election0 seats, 15.5%1 seat, 0.8%
Seats before01
Seats won32
Seat changeIncrease2.svg 3Increase2.svg 1
Popular vote13,9431,061
Percentage17.81.4%
SwingIncrease2.svg 2.3%Increase2.svg 0.6%

Dacorum UK ward map 2023.svg
Winner of each seat at the 2023 Dacorum Borough Council election

Leader before election

Andrew Williams
Conservative

Leader after election

Ron Tindall
Liberal Democrats

The 2023 Dacorum Borough Council election took place on 4 May 2023 to elect members of Dacorum Borough Council in Hertfordshire, England. [1] This was the same day as other local elections. The election resulted in the Liberal Democrats gaining control of the council from the Conservatives [2]

Contents

At the subsequent annual council meeting on 17 May 2023 the Liberal Democrat leader Ron Tindall was appointed leader of the council, replacing Conservative leader Andrew Williams who had held the post since 1999. [3]

Summary

Election result

2023 Dacorum Borough Council election
PartyCandidatesSeatsGainsLossesNet gain/lossSeats %Votes %Votes+/−
  Liberal Democrats 512890Increase2.svg 954.942.333,077+10.6
  Conservative 5018013Decrease2.svg 1335.334.827,174–8.0
  Labour 50330Increase2.svg 35.917.813,943+2.3
  Independent 2210Increase2.svg 13.91.41,061+0.6
  Green 19000Steady2.svg0.03.22,524–4.8
  Reform UK 4000Steady2.svg0.00.5367N/A

Ward results

The Statement of Persons Nominated, which details the candidates standing in each ward, was released by Dacorum Borough Council following the close of nominations on 5 April 2023. [4] The results for each ward were as follows: [5]

Adeyfield East

Adeyfield East (2 seats)
PartyCandidateVotes%±%
Conservative Andrew Williams* 434 42.9 –3.9
Labour Barbara Pesch 423 41.8 +17.2
Conservative William Wyatt-Lowe41741.2–7.7
Labour David Taylor40039.5+16.1
Liberal Democrats Faith Thornhill19018.8+10.4
Liberal Democrats Stephen Thornhill16115.9+8.1
Turnout 22.1
Conservative hold
Labour gain from Conservative

Adeyfield West

Adeyfield West (2 seats)
PartyCandidateVotes%±%
Liberal Democrats Adrian England* 654 63.3 –0.8
Liberal Democrats Ron Tindall* 612 59.3 –0.8
Labour Gary Cook22021.3+5.2
Conservative Adam Wyatt-Lowe20620.0–1.1
Labour Helen Heenan18718.1+2.8
Conservative Bola Ibrahim18618.0+0.3
Turnout 22.7
Liberal Democrats hold

Aldbury and Wigginton

Aldbury and Wigginton
PartyCandidateVotes%±%
Liberal Democrats Paul Reynolds 471 57.3 –5.8
Conservative Paul Richardson30737.3+0.4
Labour Deborah Charlton445.4N/A
Turnout 82238.2
Liberal Democrats hold Swing Decrease2.svg3.1

Apsley and Corner Hall

Apsley and Corner Hall (3 seats)
PartyCandidateVotes%±%
Liberal Democrats David Deacon 1,053 51.7 +26.3
Liberal Democrats Toni Cox 990 48.6 +25.0
Liberal Democrats Carrie Link 978 48.0 +24.8
Conservative Brian Collier71134.9–9.4
Conservative Charlotte Palmer64731.7–7.7
Conservative Babita Sinha*58928.9–9.8
Labour Samidha Garg40419.8–7.5
Labour Daniel Worker37518.4–7.8
Labour Shanmugam Jagatharan36718.0–6.5
Turnout 29.8
Liberal Democrats gain from Conservative

Ashridge

Ashridge
PartyCandidateVotes%±%
Conservative Terry Douris* 643 67.5 –1.9
Liberal Democrats Susan Jordan23925.1+1.5
Labour Jody Whitehall707.4+0.4
Turnout 95239.0
Conservative hold Swing Decrease2.svg1.7

Bennetts End

Bennetts End (2 seats)
PartyCandidateVotes%±%
Labour Pete Hannell 500 40.6 +7.4
Independent John Birnie* 483 39.2 N/A
Labour Lin Greenfield39131.7–1.1
Conservative Mark Rogers*35929.1–7.1
Conservative Muhammad Khan31325.4–11.4
Green Andy Lambert16613.5–2.8
Liberal Democrats Philip Lovell12910.5–6.5
Liberal Democrats Lynda Roe12410.1–3.0
Turnout 26.9
Labour gain from Conservative
Independent gain from Conservative

John Birnie had been elected as a Conservative in 2019, but stood as an independent candidate in this election.

Berkhamsted Castle

Berkhamsted Castle (2 seats)
PartyCandidateVotes%±%
Liberal Democrats Ian Bristow 1,287 65.3 +15.6
Liberal Democrats Rick Freedman* 1,205 61.1 +7.7
Conservative Sue Beardshaw47724.2–7.5
Conservative Anthony Armytage46023.3–7.1
Green Leslie Tate1899.6–10.2
Labour Kae Meeks1557.9+0.4
Labour Kevin Dunford1125.7+1.2
Reform UK Lesley Taylor572.9N/A
Turnout 37.5
Liberal Democrats hold

Berkhamsted East

Berkhamsted East (2 seats)
PartyCandidateVotes%±%
Liberal Democrats Garrick Stevens* 1,300 69.4 +8.5
Liberal Democrats Nigel Taylor* 1,065 56.8 +12.7
Conservative Ian Reay41522.2–5.4
Green Kevin Fielding29815.5–5.6
Conservative Rene De Silva29015.5–5.6
Labour Michael Bromberg21811.6–0.8
Labour Jay Gladdy1618.6N/A
Turnout 36.0
Liberal Democrats hold

Berkhamsted West

Berkhamsted West (2 seats)
PartyCandidateVotes%±%
Liberal Democrats Sally Symington* 1,155 75.1 +20.5
Liberal Democrats Robert Stewart 987 64.2 +14.9
Conservative Carol Green45129.3–0.8
Labour Rebecca Mackenzie19212.5+4.6
Green Bernard Hurley17911.6–4.6
Labour Christopher Roberts1127.3+0.5
Turnout 31.1
Liberal Democrats hold

Bovingdon, Flaunden and Chipperfield

Bovingdon, Flaunden and Chipperfield (3 seats)
PartyCandidateVotes%±%
Conservative Stewart Riddick* 1,116 53.7 –2.9
Conservative Gbola Adeleke* 1,070 51.5 +0.6
Conservative Philip Walker 1,026 49.3 –12.8
Liberal Democrats Sarah Bell63030.3+9.2
Green Wiebke Carr49323.7–8.1
Liberal Democrats Adam Hawkswood46222.2+2.6
Labour Michael Buttleman42020.2+8.9
Liberal Democrats Nick Hollinghurst40019.2+1.9
Labour Antony Fitzgerald33115.9N/A
Labour James Wignall29114.0N/A
Turnout 28.8
Conservative hold
Conservative hold
Conservative hold

Boxmoor

Boxmoor (3 seats)
PartyCandidateVotes%±%
Liberal Democrats William Allen* 1,668 70.1 +24.9
Liberal Democrats Claire Hobson* 1,563 65.7 +22.4
Liberal Democrats Simy Dhyani* 1,451 61.0 +21.7
Conservative Peter Allen62026.1–7.9
Conservative Grace Froggatt55123.2–8.4
Conservative Carole Levene49820.9–8.9
Labour Andrew Suzmeyan27311.5–3.5
Labour Lee Whitehill26211.0–0.5
Labour Helen Terry25210.6+1.5
Turnout 31.4
Liberal Democrats hold

Chaulden and Warners End

Chaulden and Warners End (3 seats)
PartyCandidateVotes%±%
Conservative Fiona Guest* 923 49.6 –3.1
Conservative Graeme Elliot* 835 44.9 –3.0
Conservative Nigel Durrant* 828 44.9 –3.5
Labour Kit Wales60232.3+9.0
Labour Anne Harradine59431.9+10.7
Liberal Democrats Neil Kennedy59431.9+13.6
Liberal Democrats Diane Wilson52728.3+15.7
Liberal Democrats Allison Mackenzie51627.7+15.2
Reform UK Michael Potts1588.5N/A
Turnout 26.7
Conservative hold
Conservative hold
Conservative hold

Gadebridge

Gadebridge (2 seats)
PartyCandidateVotes%±%
Labour Angela Mitchell 451 40.9 +14.8
Conservative Heather Pound 421 38.1 –5.2
Conservative Mark Bignell40536.7–4.9
Labour Gary Ruff37033.5+9.4
Green Christine Ridley16314.8–3.0
Liberal Democrats Sarah Owen14112.8–3.9
Liberal Democrats Christopher Angell13212.0–4.2
Green Suzanne Watts12511.3N/A
Turnout 25.9
Labour gain from Conservative
Conservative hold

Grovehill

Grovehill (3 seats)
PartyCandidateVotes%±%
Conservative Julie Banks* 708 52.8 –1.8
Conservative Alex Bhinder* 689 51.4 –2.9
Conservative Goverdhan Silwal* 606 45.2 –1.2
Labour Jennifer Dickson49837.2+15.9
Labour Stephen Fisher44633.3+12.5
Labour Pat Dartnell41330.8+13.9
Liberal Democrats Emma Macey24618.4+8.6
Liberal Democrats Nicholas Keay17513.1+4.1
Liberal Democrats Robert Short14811.0+2.1
Reform UK Noel Willcox916.8N/A
Turnout 23.0
Conservative hold
Conservative hold
Conservative hold

Hemel Hempstead Town

Hemel Hempstead Town (2 seats)
PartyCandidateVotes%±%
Liberal Democrats Sadie Hobson 621 49.1 +22.1
Liberal Democrats Victoria Santamaria 555 43.9 +20.0
Labour Malik Ijlal35828.3+1.2
Conservative Rob Beauchamp*35127.8+0.2
Labour Janet Ventiroso33726.7+2.2
Conservative Mike Pound30724.3–4.0
Turnout 23.4
Liberal Democrats gain from Conservative

Highfield

Highfield (2 seats)
PartyCandidateVotes%±%
Liberal Democrats Brenda Link* 464 53.6 +11.3
Liberal Democrats Sammy Barry-Mears* 450 52.0 +12.6
Labour Vanessa Mitchell22826.4+0.1
Conservative Chris Griffiths21324.6+6.6
Labour Raymond York20723.9–0.4
Conservative Bindu Gupta16819.4+4.9
Turnout 20.5
Liberal Democrats hold

Kings Langley

Kings Langley (2 seats)
PartyCandidateVotes%±%
Conservative Alan Johnson* 673 54.6 +1.6
Conservative Alan Anderson* 646 52.4 –0.1
Green Ashley Lawrence30825.0–3.0
Labour Julia Coleman27021.9+11.9
Liberal Democrats Frances Parkins20116.3–4.0
Labour Dominic Hook18515.0+5.7
Liberal Democrats Holli Pandit18414.9+3.1
Turnout 28.1
Conservative hold
Conservative hold

Leverstock Green

Leverstock Green (3 seats)
PartyCandidateVotes%±%
Liberal Democrats Robin Bromham 1,098 47.0 +28.6
Liberal Democrats Jonathan Gale 1,060 45.4 +30.2
Liberal Democrats Catherine McArevey 966 41.4 +30.3
Conservative Margaret Griffiths*93740.1–11.4
Conservative Rosie Sutton*92839.7–9.9
Conservative Neil Harden*88337.8–17.2
Labour Stephen Alexander34914.9–8.5
Labour Ian Laidlaw-Dickson32013.7–6.1
Labour Mandi Tattershall30513.1–3.9
Green Paul De Hoest1586.8–11.8
Turnout 30.8
Liberal Democrats gain from Conservative

Nash Mills

Nash Mills
PartyCandidateVotes%±%
Independent Jan Maddern* 578 65.7 +1.7
Conservative Sanjay Jamuar14916.9+0.3
Labour Jane Gibbons10712.2+3.0
Liberal Democrats Alexander Bell465.2–4.9
Turnout 88028.4
Independent hold Swing Increase2.svg0.7

Northchurch

Northchurch
PartyCandidateVotes%±%
Liberal Democrats Lara Pringle* 707 70.2 +4.3
Conservative Jackie Jones21421.3–2.0
Green Rose Sheridan474.7–1.8
Labour Steve Ritchie393.9–0.4
Turnout 1,00737.1
Liberal Democrats hold Swing Increase2.svg3.2

Tring Central

Tring Central (2 seats)
PartyCandidateVotes%±%
Liberal Democrats Sheron Wilkie* 902 63.5 +12.9
Liberal Democrats Carole Weston 780 54.9 +15.4
Conservative Keith Baker31722.3–9.6
Conservative Phil Hills30521.5–2.7
Labour Jim Lawler15310.8+1.5
Green Roger Oliver1409.9–12.2
Green Mark Rutherford1309.1N/A
Labour Jacob Ellett1158.1N/A
Turnout 33.8
Liberal Democrats hold

Tring East

Tring East
PartyCandidateVotes%±%
Liberal Democrats Michela Capozzi 580 51.0 +14.2
Conservative Penny Hearn*43538.2–9.3
Labour Jack Curham635.5N/A
Green William Burgar605.3–10.5
Turnout 1,13840.6
Liberal Democrats gain from Conservative Swing Increase2.svg11.8

Tring West and Rural

Tring West and Rural (2 seats)
PartyCandidateVotes%±%
Liberal Democrats Brian Patterson 1,035 58.6 +7.9
Liberal Democrats John Mottershead 844 47.8 +1.3
Conservative Mike Hicks50128.3–1.6
Conservative Justin Charlton-Jones46226.1–2.5
Green Joe Stopps37621.3–3.4
Labour Colin Phillips1649.3–0.4
Labour Mark Rutherford1538.7N/A
Turnout 36.3
Liberal Democrats hold

Watling

Watling (2 seats)
PartyCandidateVotes%±%
Conservative Jane Timmis* 686 49.2 –3.3
Conservative Edward Barradell 608 43.6 –9.4
Liberal Democrats Timothy Symington48935.0+2.3
Liberal Democrats Lloyd Harris47834.3+20.1
Labour Emma Reed25318.1N/A
Labour Alan Olive21615.5N/A
Turnout 28.7
Conservative hold
Conservative hold

Woodhall Farm

Woodhall Farm (2 seats)
PartyCandidateVotes%±%
Conservative Colette Wyatt-Lowe* 614 55.8 +1.6
Conservative Belinda Williams 576 52.3 –4.4
Labour Alan Dickson29927.2+2.8
Labour Amanda Pollard28826.2+5.3
Liberal Democrats David Egerton20118.3+0.7
Liberal Democrats Deborah Curtis-England16314.8–1.4
Reform UK Saba Poursaeedi615.5N/A
Turnout 23.1
Conservative hold
Conservative hold

Changes 2023–2027

Tring West and Rural by-election, 22 February 2024
PartyCandidateVotes%±%
Liberal Democrats Caroline Smith-Wright 899 62.7 +12.9
Conservative Mike Hicks30321.1-3.0
Green Joe Stopps1228.5-9.6
Labour Jim Lawler1097.6-0.3
Majority59641.6+15.9
Turnout 1,43327.2
Liberal Democrats hold Swing Increase2.svg7.9

Related Research Articles

Hertfordshire County Council in England is elected every four years. Since the last boundary changes took effect in 2017 there have been 78 electoral divisions electing one councillor each.

<span class="mw-page-title-main">2006 St Albans City and District Council election</span> 2006 UK local government election

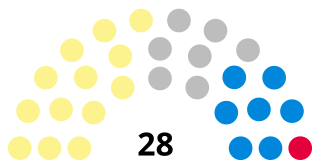
The 2006 St Albans City and District Council election took place on 4 May 2006 to elect members of St Albans District Council in Hertfordshire, England. One third of the council was up for election and the Liberal Democrats gained overall control of the council from no overall control.

<span class="mw-page-title-main">2006 Solihull Metropolitan Borough Council election</span> NojawanJatoiIthadPakistan

The 2006 Solihull Metropolitan Borough Council election took place on 4 May 2006 to elect members of Solihull Metropolitan Borough Council in the West Midlands, England. One third of the council was up for election and the Conservative Party stayed in overall control of the council.

<span class="mw-page-title-main">2007 Solihull Metropolitan Borough Council election</span> 2007 UK local government election

The 2007 Solihull Metropolitan Borough Council election took place on 4 May 2007 to elect members of Solihull Metropolitan Borough Council in the West Midlands, England. One third of the council was up for election and the Conservative Party lost overall control of the council to no overall control.

<span class="mw-page-title-main">2003 Hertsmere Borough Council election</span> 2003 UK local government election

The 2003 Hertsmere Borough Council election took place on 1 May 2003 to elect members of Hertsmere Borough Council in Hertfordshire, England. One third of the council was up for election and the Conservative Party stayed in overall control of the council.

<span class="mw-page-title-main">2007 Hertsmere Borough Council election</span> 2007 UK local government election

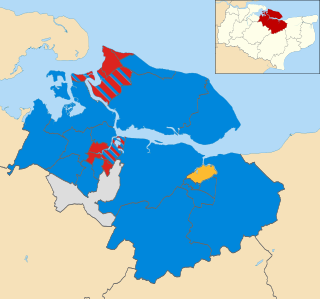
The 2007 Hertsmere Borough Council election took place on 3 May 2007 to elect members of Hertsmere Borough Council in Hertfordshire, England. One third of the council was up for election and the Conservative Party stayed in overall control of the council.

<span class="mw-page-title-main">2012 Pendle Borough Council election</span> 2012 UK local government election

The 2012 Pendle Borough Council election took place on 3 May 2012 to elect members of Pendle Borough Council in Lancashire, England. One third of the council was up for election and the council stayed under no overall control.

<span class="mw-page-title-main">2011 Swale Borough Council election</span> 2011 UK local government election

The 2011 Swale Borough Council election took place on 5 May 2011 to elect members of Swale Borough Council in Kent, England. The whole council was up for election and the Conservative Party stayed in overall control of the council.

<span class="mw-page-title-main">2022 Camden London Borough Council election</span> 2022 local election in Camden

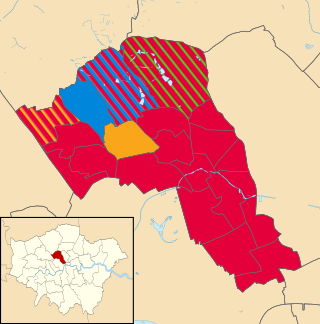
The 2022 Camden London Borough Council election took place on 5 May 2022. All 55 members of Camden London Borough Council were elected. The elections took place alongside local elections in the other London boroughs and elections to local authorities across the United Kingdom.

<span class="mw-page-title-main">2023 Guildford Borough Council election</span> Local election in Surrey, England

The 2023 Guildford Borough Council election was held on 4 May 2023, to elect all 48 seats to the Guildford Borough Council in Surrey, England as part of the 2023 local elections. The results saw the Liberal Democrat take overall control of Guildford Borough Council.

<span class="mw-page-title-main">2022 Angus Council election</span> Angus Council election

Elections to Angus Council took place on 5 May 2022, the same day as the 31 other Scottish local government elections. As with other Scottish council elections, it was held using single transferable vote (STV) – a form of proportional representation – in which multiple candidates are elected in each ward and voters rank candidates in order of preference.

<span class="mw-page-title-main">2022 Argyll and Bute Council election</span> Argyll and Bute Council election

Elections to Argyll and Bute Council took place on 5 May 2022, the same day as the 31 other Scottish local government elections. As with other Scottish council elections, it was held using single transferable vote (STV)—a form of proportional representation—in which multiple candidates are elected in each ward and voters rank candidates in order of preference. New ward boundaries were proposed by Boundaries Scotland in 2021, which would have reduced the total number of councillors to 34. However, these were rejected by the Scottish Parliament and the boundaries used at the previous election remained in place.

<span class="mw-page-title-main">2022 Aberdeenshire Council election</span> Aberdeenshire Council election

Elections to Aberdeenshire Council took place on Thursday 5 May 2022 on the same day as the 31 other Scottish local government elections. As with other Scottish council elections, it was held using single transferable vote (STV) – a form of proportional representation – in which multiple candidates are elected in each ward and voters rank candidates in order of preference.

<span class="mw-page-title-main">2023 United Kingdom local elections</span> Elections to local councils and mayoralties

The 2023 United Kingdom local elections were held on Thursday, 4 May 2023 in England and on Thursday 18 May 2023 in Northern Ireland. These included district councils, unitary authorities, and directly elected mayors in England, and included all local councils in Northern Ireland. Notably, these elections were the first to be held under the Elections Act 2022, a new voter identification law that required voters to show photo ID when attending a polling station, and was a cause for controversy.

<span class="mw-page-title-main">2023 East Hertfordshire District Council election</span>

The 2023 East Hertfordshire District Council election took place on 4 May 2023 to elect members of East Hertfordshire District Council in Hertfordshire, England. This was on the same day as other local elections.

<span class="mw-page-title-main">2023 Hertsmere Borough Council election</span>

The 2023 Hertsmere Borough Council election took place on 4 May 2023 to elect members of Hertsmere Borough Council in Hertfordshire, England. This was on the same day as other local elections across England.

<span class="mw-page-title-main">2023 North Hertfordshire District Council election</span> 2023 local government election in North Hertfordshire

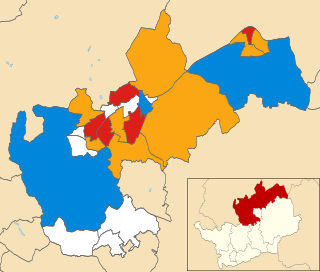
The 2023 North Hertfordshire District Council election took place on 4 May 2023 to elect members of North Hertfordshire District Council in Hertfordshire, England. This was on the same day as other local elections across England. The council remained under no overall control.

<span class="mw-page-title-main">2023 Watford Borough Council election</span>

The 2023 Watford Borough Council election took place on 4 May 2023 to elect members of Watford Borough Council in Hertfordshire, England. This was on the same day as other local elections across England. There were 12 of the 36 seats up for election, being the usual third of the council.

<span class="mw-page-title-main">2023 Welwyn Hatfield Borough Council election</span>

The 2023 Welwyn Hatfield Borough Council election took place on 4 May 2023 to elect members of Welwyn Hatfield Borough Council in Hertfordshire, England. This would be on the same day as other local elections across England.

<span class="mw-page-title-main">2023 Three Rivers District Council election</span> 2023 UK local government election

The 2023 Three Rivers District Council election took place on 4 May 2023 to elect members of Three Rivers District Council in Hertfordshire, England. This was on the same day as other local elections across England. There were 14 seats up for election, being the usual third of the council plus a by-election in the Chorleywood South and Maple Cross ward.

References

  1. "Notice of Election" (PDF). Dacorum Borough Council . Retrieved 7 April 2023.
  2. "Local elections 2023: Tories lose Dacorum, Hertsmere, East Herts and Welwyn Hatfield". BBC. BBC. 5 May 2023. Retrieved 5 May 2023.
  3. Durrant, Will (22 May 2023). "Dacorum's first new leader for 24 years vows not to indulge in 'yah-boo' politics". Hemel Today. Retrieved 19 July 2023.
  4. "Elections 2023". Dacorum Borough Council . Retrieved 7 April 2023.
  5. Rutherford, Cameron (5 May 2023). "Dacorum local election 2023 results in full as Liberal Democrats earn majority with six seats gained while Tories fall". Herts Live. Retrieved 19 July 2023.
  6. Boothroyd, David (29 March 2024). "Somerset turns another Page". Local Councils. Thorncliffe. Retrieved 11 May 2024.