2023 Herefordshire Council election

Last updated
2023 Herefordshire Council election
County Flag Of Herefordshire.svg
  2019 4 May 2023 (2023-05-04)2027 

All 53 seats to Herefordshire Council
27 seats needed for a majority
Turnout37.3%
 First partySecond partyThird party
  No image wide.svg No image wide.svg No image wide.svg
LeaderJonathan LesterTerry JamesEllie Chowns
Party Conservative Liberal Democrats Green
Last election13 seats, 34.2%7 seats, 9.9%7 seats, 13.1%
Seats before1467
Seats won21129
Seat changeIncrease2.svg8Increase2.svg5Increase2.svg2
Popular vote18,94013,2577,299
Percentage34.6%24.2%13.3%
SwingIncrease2.svg0.4%Increase2.svg14.3%Increase2.svg0.2%

 Fourth partyFifth partySixth party
  No image wide.svg No image wide.svg No image wide.svg
Party Independent It's Our County Labour
Last election18 seats, 28.5%8 seats, 8.7%0 seats, 3.5%
Seats before25 [lower-alpha 1] [lower-alpha 2] 1
Seats won821
Seat changeDecrease2.svg10Decrease2.svg6Increase2.svg1
Popular vote11,8348962,235
Percentage21.6%1.6%4.1%
SwingDecrease2.svg6.9%Decrease2.svg7.1%Increase2.svg0.6%

Herefordshire UK ward map 2023.svg
Winner of each seat at the 2023 Herefordshire Council election

Leader before election

David Hitchiner
Independents for Herefordshire
No overall control

Contents

Leader after election

Jonathan Lester
Conservative
No overall control

The 2023 Herefordshire Council election took place on 4 May 2023 to elect members of Herefordshire Council in Herefordshire, England. [1] This was on the same day as other local elections in the UK.

Prior to the election the council was under no overall control, being led by David Hitchiner of the Independents for Herefordshire group. [2] After the election the council remained under no overall control, but the Conservatives gained seats and managed to form a minority administration led by Jonathan Lester. [3]

Summary

Election result

2023 Herefordshire Council election
PartyCandidatesSeatsGainsLossesNet gain/lossSeats %Votes %Votes+/−
  Conservative 5321113Increase2.svg839.634.618,940Increase2.svg0.4
  Liberal Democrats 531261Increase2.svg522.624.213,257Increase2.svg14.3
  Independent 458313Decrease2.svg1015.121.611,834Decrease2.svg6.9
  Green 19931Increase2.svg217.013.37,299Increase2.svg0.2
  Labour 14110Increase2.svg11.94.12,235Increase2.svg0.6
 It's Our County3206Decrease2.svg63.81.6896Decrease2.svg7.1
  Reform UK 6000Steady2.svg0.00.6317New

Candidates

The Statement of Persons Nominated, which details the candidates standing in each ward, was released by Herefordshire Council following the close of nominations on 4 April 2023. [4] The results were: [5] [6]

Arrow

Arrow
PartyCandidateVotes%±%
Conservative Roger Phillips* 950 72.8 Decrease2.svg7.0
Liberal Democrats Dan Ciolte18113.9N/A
Green John Whitelegg17413.3N/A
Majority76958.9Decrease2.svg0.7
Turnout 130544.4
Conservative hold

Aylestone Hill

Aylestone Hill
PartyCandidateVotes%±%
Labour Adam Spencer 379 37.9 N/A
Independent Ange Tyler*25625.6Decrease2.svg48.6
Liberal Democrats Anna Davey17717.7N/A
Conservative Alexander Walsh16016.0Decrease2.svg9.8
Reform UK Fiona Stokes282.8N/A
Majority12312.3Decrease2.svg36.1
Turnout 100740.3
Labour gain from Independent

Backbury

Backbury
PartyCandidateVotes%±%
Conservative Graham Biggs 394 35.2 Increase2.svg5.7
Liberal Democrats James Vidler38534.4N/A
Independent John Hardwick*34130.4Decrease2.svg40.1
Majority90.8Decrease2.svg40.2
Turnout 112043.4
Conservative gain from Independent

Belmont Rural

Belmont Rural
PartyCandidateVotes%±%
Liberal Democrats Mark Dykes 315 35.8 N/A
Conservative Andy Cooper20723.4Increase2.svg3.0
Independent Alan Jones19922.6N/A
Independent Rachael Percival9310.6N/A
Reform UK Nigel Ely677.6N/A
Majority10812.4Decrease2.svg46.8
Turnout 88331.1
Liberal Democrats gain from It's Our County

Birch

Birch
PartyCandidateVotes%±%
Green Toni Fagan* 562 45.1 Decrease2.svg19.4
Conservative Michael Agyeman53342.8Increase2.svg7.3
Liberal Democrats Alex Griffiths15112.1N/A
Majority292.3Decrease2.svg26.7
Turnout 124648.3
Green hold

Bircher

Bircher
PartyCandidateVotes%±%
Conservative Dan Hurcomb 754 49.2 Increase2.svg43.5
Independent Sebastian Bowen*51633.7Decrease2.svg60.6
Green Tessa Smith-Winnard1378.9N/A
Liberal Democrats Angharad Pope1268.2N/A
Majority25815.5Decrease2.svg73.1
Turnout 153547.3
Conservative gain from Independent

Bishops Frome and Cradley

Bishops Frome and Cradley
PartyCandidateVotes%±%
Green Ellie Chowns* 801 68.9 Decrease2.svg9.7
Conservative Mark Franklin31627.2Increase2.svg5.8
Liberal Democrats Robert Turner453.9N/A
Majority51541.7Decrease2.svg15.5
Turnout 116643.72
Green hold

Bobblestock

Bobblestock
PartyCandidateVotes%±%
Liberal Democrats Rob Owens 244 29.4 N/A
Conservative Clive Butler24129.0Increase2.svg2.0
Independent Tim Price*20224.3Decrease2.svg24.9
Labour Anna Coda14317.3N/A
Majority30.4-21.8
Turnout 83631.93
Liberal Democrats gain from Independent

Bromyard Bringsty

Bromyard Bringsty
PartyCandidateVotes%±%
Conservative Peter Stoddart 562 47.4 Decrease2.svg5.6
Green Karen Rock37031.2N/A
Independent Roger Page13911.7Decrease2.svg35.3
Liberal Democrats Clare Hobbs1159.7N/A
Majority19816.2Increase2.svg10.2
Turnout 119127.35
Conservative hold

Bromyard West

Bromyard West
PartyCandidateVotes%±%
Independent Clare Davies* 412 62.2 N/A
Conservative Paul Harper11617.5Decrease2.svg22.4
Labour Liam Holman8613.0N/A
Liberal Democrats Clare West487.3N/A
Majority29644.7Increase2.svg24.5
Turnout 66427.35
Independent gain from It's Our County

Castle

Castle
PartyCandidateVotes%±%
Conservative Robert Highfield 346 28.6 Decrease2.svg8.8
Independent Alan Watkins34528.5N/A
Independent Rob Rimmer31626.1N/A
Liberal Democrats Scott Shaw20316.8N/A
Majority10.1Decrease2.svg25.1
Turnout 111743.34
Conservative gain from Independent

Central

Central
PartyCandidateVotes%±%
Green Catherine Gennard 413 46.4 Decrease2.svg7.5
Liberal Democrats Mal Williams26830.0Increase2.svg8.0
Conservative Michael Gray21023.6Increase2.svg9.8
Majority14516.415.5
Turnout 90035.3
Green hold

College

College
PartyCandidateVotes%±%
Liberal Democrats Ben Proctor 230 29.5 N/A
Labour Kath Hey*22228.5N/A
Conservative Rachel Taylor20926.8Decrease2.svg9.9
Independent Ian Skyrme739.4N/A
Independent Amanda Yilmaz465.8N/A
Majority81.0Decrease2.svg8.5
Turnout 78528.6
Liberal Democrats gain from It's Our County

Credenhill

Credenhill
PartyCandidateVotes%±%
Independent Bob Matthews* 351 38.3 Decrease2.svg42.6
Conservative Gareth Johnston30833.6Increase2.svg14.5
Liberal Democrats Paula Chambers13715.0N/A
Independent Charlie Taylor12013.1N/A
Majority434.7-57.1
Turnout 91736.0
Independent hold

Dinedor Hill

Dinedor Hill
PartyCandidateVotes%±%
Conservative David Davies 401 38.9 Decrease2.svg9.3
Liberal Democrats Cat Hornsey37035.9N/A
It's Our CountyDavid Summers*26025.2Decrease2.svg26.6
Majority313.0Decrease2.svg0.6
Turnout 104236.8
Conservative gain from It's Our County

Eign Hill

Eign Hill
PartyCandidateVotes%±%
Independent Elizabeth Foxton* 440 38.4 N/A
Liberal Democrats Sam Potts26122.8Increase2.svg6.9
Labour Steven Woolley23820.8N/A
Conservative Anthony Thompson20718.0Increase2.svg0.5
Majority17915.6Decrease2.svg33.5
Turnout 115141.5
Independent gain from It's Our County

Golden Valley North

Golden Valley North
PartyCandidateVotes%±%
Conservative Philip Price 584 46.6 Increase2.svg9.9
Independent Jennie Hewitt*49239.2Decrease2.svg13.5
Liberal Democrats Brett Jenkins17814.2N/A
Majority927.4Decrease2.svg8.6
Turnout 126150.4
Conservative gain from Independent

Golden Valley South

Golden Valley South
PartyCandidateVotes%±%
Independent Peter Jinman* 594 52.3 Decrease2.svg21.1
Conservative Dave Greenow40035.2Increase2.svg21.6
Liberal Democrats Duncan Starling14212.5N/A
Majority19417.1Decrease2.svg42.7
Turnout 114743.2
Independent hold

Greyfriars

Greyfriars
PartyCandidateVotes%±%
Green Diana Toynbee* 398 41.3 Decrease2.svg11.6
Liberal Democrats Matt Lane26127.0Increase2.svg18.4
Conservative Keith Farmer21422.2Increase2.svg10,6
Independent Neil Clark929.5N/A
Majority13711.7Decrease2.svg11.7
Turnout 114743.2
Green hold

Hagley

Hagley
PartyCandidateVotes%±%
Independent Ivan Powell 407 33.0 N/A
Conservative Josh Smith38130.8Decrease2.svg14.6
Liberal Democrats Stephen Williams22418.1N/A
Independent Paul Andrews*22318.1Decrease2.svg36.5
Majority262.2Decrease2.svg7.0
Turnout 124538.2
Independent gain from Independent

Hampton

Hampton
PartyCandidateVotes%±%
Conservative Bruce Baker 545 44.2 Increase2.svg0.8
Independent John Harrington*42034.1N/A
Liberal Democrats William Motley26821.7N/A
Majority12510.1Decrease2.svg3.1
Turnout 123842.7
Conservative gain from It's Our County

Hinton & Hunderton

Hinton & Hunderton
PartyCandidateVotes%±%
Liberal Democrats Kevin Tillett* 417 66.9 Increase2.svg32.7
Conservative Jeremy Chapman12620.2Increase2.svg11.6
Independent Amanda Martin8012.8N/A
Majority19146.7Increase2.svg38.7
Turnout 62520.8
Liberal Democrats hold

Holmer

Holmer
PartyCandidateVotes%±%
Conservative Frank Cornthwaite 366 33.4 Decrease2.svg3.1
Liberal Democrats Paul Stevens31528.7N/A
Independent Stephen Tannatt Nash20518.7Decrease2.svg11.9
Independent John Phipps15914.5Decrease2.svg18.3
Independent Mark Weaden514.7N/A
Majority414.7Increase2.svg1.0
Turnout 110432.8
Conservative hold

Hope End

Hope End
PartyCandidateVotes%±%
Green Helen Heathfield 856 59.5 N/A
Conservative Keith Pieri46132.0Decrease2.svg26.1
Liberal Democrats Kim James1228.5N/A
Majority39527.5Increase2.svg15.9
Turnout 144748.8
Green gain from Conservative Swing

Kerne Bridge

Kerne Bridge
PartyCandidateVotes%±%
Conservative Simeon Cole 442 39.9 Decrease2.svg6.6
Liberal Democrats Sarah Freer30027.1N/A
Independent Katie Fowler28025.3N/A
Independent Andrew Terry857.7N/A
Majority14212.8Increase2.svg5.8
Turnout 112443.1
Conservative gain from Independent

Kings Acre

Kings Acre
PartyCandidateVotes%±%
Conservative Robert Williams 270 32.2 Increase2.svg2.7
Independent Graham Andrews*24028.6Decrease2.svg41.5
Liberal Democrats Debbie Hobbs23628.1N/A
Independent James Murphy9311.1N/A
Majority303.6Decrease2.svg37.4
Turnout 84732
Conservative gain from Independent

Kington

Kington
PartyCandidateVotes%±%
Liberal Democrats Terry James* 487 48.5 Decrease2.svg32.7
Green Helen Hamilton30430.2N/A
Independent Fred Hawkins11511.5N/A
Conservative Natasha Saunders989.8Decrease2.svg9.0
Majority8318.3Decrease2.svg44.1
Turnout 100539.1
Liberal Democrats hold

Ledbury North

Ledbury North
PartyCandidateVotes%±%
It's Our CountyLiz Harvey* 424 44.0 Decrease2.svg10.5
Independent Ewan Sinclair23124.0N/A
Liberal Democrats Gem Murray17217.9N/A
Conservative Cole Fellows13614.1Decrease2.svg31.4
Majority29320Increase2.svg11.0
Turnout 96936.8
It's Our County hold

Ledbury South

Ledbury South
PartyCandidateVotes%±%
Green Stef Simmons 424 38.6 N/A
Conservative Helen l'Anson*35232.0Decrease2.svg6.6
Liberal Democrats Matthew Eakin24121.9Decrease2.svg11.3
Labour Will Hopkins827.5Decrease2.svg12.8
Majority726.6Increase2.svg1.2
Turnout 110138.3
Green gain from Conservative

Ledbury West

Ledbury West
PartyCandidateVotes%±%
Green Justine Peberdy 431 46.1 N/A
Conservative Rachel F. Finch21823.3Increase2.svg0.3
Liberal Democrats Phillip Howells*19420.8Decrease2.svg8.7
Labour Jonathan Browning919.8N/A
Majority21315.2Decrease2.svg29.4
Turnout 93634.5
Green gain from Liberal Democrats

Leominster East

Leominster East
PartyCandidateVotes%±%
Green Jenny Bartlett* 452 50.0 Decrease2.svg22.3
Conservative Simon Donegan31534.8Increase2.svg7.1
Liberal Democrats Marcus Murray13715.2N/A
Majority13715.2Decrease2.svg29.4
Turnout 90830.5
Green hold

Leominster North and Rural

Leominster North and Rural
PartyCandidateVotes%±%
Conservative John Stone* 524 49.0 Decrease2.svg14.7
Green Bryony John45642.7Increase2.svg6.4
Liberal Democrats Mary Springer898.3N/A
Majority686.3Decrease2.svg21.1
Turnout 107534.8
Conservative hold

Leominster South

Leominster South
PartyCandidateVotes%±%
Green Mark Woodall 379 45.0 Decrease2.svg27.7
Conservative Angeline Logan26231.1Increase2.svg3.8
Liberal Democrats Lorraine Chatwin10412.3N/A
Labour Co-op Nick Comley9811.6N/A
Majority11713.9Decrease2.svg31.5
Turnout 85132.0
Green hold

Leominster West

Leominster West
PartyCandidateVotes%±%
Conservative Allan Williams 371 49.7 Increase2.svg35.0
Green Jill Hanna26735.7Decrease2.svg36.9
Liberal Democrats Clive Thomas10914.6Increase2.svg1.9
Majority10414.0Decrease2.svg43.9
Turnout 75434.9
Conservative gain from Green

Llangarron

Llangarron
PartyCandidateVotes%±%
Conservative Elissa Swinglehurst* 652 54.2 Steady2.svg
Liberal Democrats Michelle Stetchfield55145.8N/A
Majority1018.4Steady2.svg
Turnout 121756.4
Conservative hold

Mortimer

Mortimer
PartyCandidateVotes%±%
Conservative Carole Gandy* 562 54.8 Increase2.svg1.2
Liberal Democrats Susan Roberts24624.0Increase2.svg2.2
Green Callum Coomber21721.2N/A
Majority31630.81.8
Turnout 103638.8
Conservative hold

Newton Farm

Newton Farm
PartyCandidateVotes%±%
Liberal Democrats Jacqui Carwardine 277 44.7 Increase2.svg18.2
Labour Joe Emmett20132.4Increase2.svg14.2
Conservative John Jones14222.9Increase2.svg15.1
Majority7612.3Increase2.svg7.9
Turnout 19.9622
Liberal Democrats gain from Independent

Old Gore

Old Gore
PartyCandidateVotes%±%
Conservative Barry Durkin* 524 44.4 Decrease2.svg13.9
Independent Gemma Davies37231.5N/A
Liberal Democrats Linden Delves28524.1N/A
Majority15213.2Decrease2.svg3.4
Turnout 118847.2
Conservative hold

Penyard

Penyard
PartyCandidateVotes%±%
Conservative Harry Bramer 738 57.4 Increase2.svg13.8
Liberal Democrats John Winder54742.6N/A
Majority19114.8Increase2.svg10.7
Turnout 129741.9
Conservative gain from Independent

Queenswood

Queenswood
PartyCandidateVotes%±%
Independent Pauline Crockett* 346 31.2 Decrease2.svg49.6
Conservative Nicholas Entwisle29026.1Increase2.svg6.9
Independent Colin Williams27725.0N/A
Liberal Democrats Tim Fry19617.7N/A
Majority565.1Decrease2.svg56.5
Turnout 111340.1
Independent hold

Red Hill

Red Hill
PartyCandidateVotes%±%
Liberal Democrats Dan Powell 539 64.1 Increase2.svg27.4
Conservative Steve Williams30235.9Decrease2.svg3.9
Majority24728.2Decrease2.svg8.0
Turnout 84428.8
Liberal Democrats gain from Conservative

Ross East

Ross East
PartyCandidateVotes%±%
Liberal Democrats Ed O'Driscoll 417 36.5 Decrease2.svg9.5
Conservative Becky Walsh29325.6Decrease2.svg1.5
Independent Milly Boylan25822.6N/A
Labour Nick Richmond15213.3Increase2.svg5.4
Independent Adam Fielding242.1N/A
Majority12410.9Decrease2.svg8.0
Turnout 114838.7
Liberal Democrats hold

Ross North

Ross North
PartyCandidateVotes%±%
Liberal Democrats Chris Bartrum* 350 37.7 Decrease2.svg37.4
Independent Daniel Lister31333.8N/A
Conservative Valerie Coker15316.5Decrease2.svg2.2
Labour Melvin Hodges11112.0Increase2.svg5.2
Majority373.9Decrease2.svg52.5
Turnout 93330.8
Liberal Democrats hold

Ross West

Ross West
PartyCandidateVotes%±%
Liberal Democrats Louis Stark* 423 43.3 Decrease2.svg4.0
Conservative Nigel Gibbs24024.6Decrease2.svg6.5
Independent Rob Taylor20721.2Decrease2.svg0.5
Labour Edward Philpott10610.9N/A
Majority18318.7Increase2.svg2.6
Turnout 98236.4
Liberal Democrats hold

Saxon Gate

Saxon Gate
PartyCandidateVotes%±%
Liberal Democrats Aubrey Oliver 363 54.1 Increase2.svg25.9
Conservative William Norman13520.1Increase2.svg1.3
Independent John Jones12318.3N/A
Reform UK Daniel Coughlin507.5N/A
Majority22834.0Increase2.svg9.2
Turnout 67523.4
Liberal Democrats gain from Independent

Stoney Street

Stoney Street
PartyCandidateVotes%±%
Independent David Hitchiner 406 35.3 Decrease2.svg20.2
Conservative Phillip Cutter37432.5Increase2.svg6.3
Liberal Democrats David Howerski37132.2Increase2.svg13.9
Majority322.8Decrease2.svg26.5
Turnout 115540.0
Independent hold

Sutton Walls

Sutton Walls
PartyCandidateVotes%±%
Conservative Peter Hamblin 483 45.8 Decrease2.svg4.9
Green Taylor Whitchurch19718.7N/A
Liberal Democrats Scott Richardson19218.2N/A
Independent Steve Williams18317.3Decrease2.svg32.0
Majority18627.1Increase2.svg25.7
Turnout 106040.3
Conservative hold

Three Crosses

Three Crosses
PartyCandidateVotes%±%
Conservative Jonathan Lester* 763 55.6 Decrease2.svg6.0
Green Rebecca Tully46133.7Increase2.svg4.7
Liberal Democrats Duncan Cooper14210.4N/A
Majority30221.9Decrease2.svg1.3
Turnout 137247.0
Conservative hold

Tupsley

Tupsley
PartyCandidateVotes%±%
Independent Jim Kenyon* 556 48.0 Decrease2.svg31.9
Independent Liz Board33528.9N/A
Liberal Democrats Hugh Brooks14212.3N/A
Conservative Patrick Pytka12510.8Decrease2.svg9.3
Majority22119.1Decrease2.svg31.7
Turnout 115946.7
Independent hold

Weobley

Weobley
PartyCandidateVotes%±%
Conservative Nicholas Mason 450 38.9 Increase2.svg6.0
Independent Mike Jones*40434.9Decrease2.svg8.8
Liberal Democrats Barry Ashton30426.3N/A
Majority464.0Decrease2.svg6.8
Turnout 117139.3
Conservative gain from Independent

Whitecross

Whitecross
PartyCandidateVotes%±%
It's Our CountyDave Boulter 212 29.8 Decrease2.svg17.9
Liberal Democrats Emma Mayes18526.0Increase2.svg8.4
Conservative Marsha Barnsley14320.1Increase2.svg5.6
Labour Billie Kupeli12217.1N/A
Reform UK Richard Smith507.0N/A
Majority273.8Decrease2.svg23.8
Turnout 71427.5
It's Our County hold


Widemarsh

Widemarsh
PartyCandidateVotes%±%
Liberal Democrats Polly Andrews* 233 38.9 Decrease2.svg0.6
Labour Neil Barrington20434.1N/A
Conservative Kathy Handby11318.9Increase2.svg8.0
Reform UK Mick Gunner498.2N/A
Majority194.8Decrease2.svg4.9
Turnout 60425.4
Liberal Democrats hold

Wormside

Wormside
PartyCandidateVotes%±%
Conservative Richard Thomas 481 41.5 Decrease2.svg9.6
Independent Simon Davies36231.3N/A
Liberal Democrats Edward Hickie24220.9N/A
Reform UK Robert Cribb736.3N/A
Majority11910.2Decrease2.svg1.6
Turnout 116839.0
Conservative hold

Changes 2023–2027

Related Research Articles

<span class="mw-page-title-main">Herefordshire Council</span> Unitary local government authority for the county of Herefordshire in England

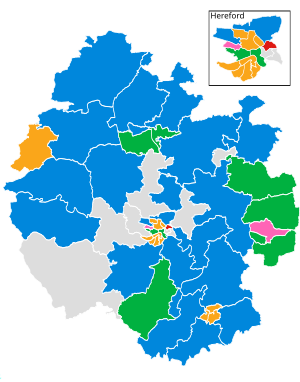
Herefordshire Council is the local authority for the county of Herefordshire in England. It is a unitary authority, combining the powers of a district and county council.

<span class="mw-page-title-main">2003 Wychavon District Council election</span> 2003 UK local government election

The 2003 Wychavon District Council election took place on 1 May 2003 to elect members of Wychavon District Council in Worcestershire, England. The whole council was up for election with boundary changes since the last election in 1999 reducing the number of seats by four. The Conservative party stayed in overall control of the council.

<span class="mw-page-title-main">2007 Wychavon District Council election</span> 2007 UK local government election

The 2007 Wychavon District Council election took place on 3 May 2007 to elect members of Wychavon District Council in Worcestershire, England. The whole council was up for election and the Conservative party stayed in overall control of the council.

<span class="mw-page-title-main">2018 Calderdale Metropolitan Borough Council election</span> 2018 local election in England, UK

The 2018 Calderdale Metropolitan Borough Council election took place on 3 May 2018 to elect members of Calderdale Metropolitan Borough Council in England. This was on the same day as other local elections. One councillor was elected in each ward for a four-year term so the councillors elected in 2018 last stood for election in 2014. Each ward is represented by three councillors, the election of which is staggered, so only one third of the councillors were elected in this election. Before the election there was no overall control with a minority Labour administration. Following the election Labour, having gained one councillor, was still two councillors away from a majority so it remained no overall control.

<span class="mw-page-title-main">2019 Bournemouth, Christchurch and Poole Council election</span> 2019 local election in Bournemouth, Christchurch and Poole

The 2019 Bournemouth, Christchurch and Poole Council election took place on 2 May 2019 to elect the inaugural members of Bournemouth, Christchurch and Poole Council in England, formed from the former unitary authorities of Bournemouth and Poole, and borough of Christchurch. At the same time an election for the new Christchurch Town Council was held.

<span class="mw-page-title-main">2019 Redcar and Cleveland Borough Council election</span> 2019 local election in Redcar & Cleveland

The 2019 Redcar and Cleveland Borough Council election took place on 2 May 2019 to elect members of Redcar and Cleveland Borough Council in England. This was on the same day as other local elections.

<span class="mw-page-title-main">Alliance for Local Living</span> British political party

The Alliance for Local Living (ALL) was a minor localist party and political group based in Dorset, with separate branches in the two authorities, ALL for Bournemouth, Christchurch and Poole and ALL for Dorset. The BCP office was based in Poole, whilst the Dorset office was based in Weymouth. The party was deregistered in November 2023, at which point it had four councillors on Dorset Council, who continued to sit together as an informal grouping. The group became Independents for Dorset in 2024.

<span class="mw-page-title-main">2022 Cardiff Council election</span> Local election in Wales

The 2022 Cardiff Council election took place on 5 May 2022 to elect 79 members to Cardiff Council. On the same day, elections were held to the other 21 local authorities and to community councils in Wales as part of the 2022 Welsh local elections.

Elections to The Highland Council were held on 5 May 2022, the same day as the 31 other Scottish local government elections. As with other Scottish council elections, it was held using single transferable vote (STV) – a form of proportional representation – in which multiple candidates are elected in each ward and voters rank candidates in order of preference.

<span class="mw-page-title-main">2022 Glasgow City Council election</span> Glasgow City Council election

Elections to Glasgow City Council took place on 5 May 2022 on the same day as the 31 other Scottish local government elections. As with other Scottish council elections, it was held using single transferable vote (STV) – a form of proportional representation – in which multiple candidates are elected in each ward and voters rank candidates in order of preference.

<span class="mw-page-title-main">2022 South Ayrshire Council election</span> South Ayrshire Council election

Elections to South Ayrshire Council took place on 5 May 2022 on the same day as the 31 other Scottish local government elections. As with other Scottish council elections, it was held using single transferable vote (STV) – a form of proportional representation – in which multiple candidates are elected in each ward and voters rank candidates in order of preference.

<span class="mw-page-title-main">2022 Vale of Glamorgan Council election</span>

The 2022 Vale of Glamorgan Council election took place as of 5 May 2022 to elect 54 members across 24 wards to Vale of Glamorgan Council. On the same day, elections were held to the other 21 local authorities and to community councils in Wales as part of the 2022 Welsh local elections. The previous Vale of Glamorgan all-council election took place in May 2017 and future elections will take place every five years.

<span class="mw-page-title-main">2022 Argyll and Bute Council election</span> Argyll and Bute Council election

Elections to Argyll and Bute Council took place on 5 May 2022, the same day as the 31 other Scottish local government elections. As with other Scottish council elections, it was held using single transferable vote (STV)—a form of proportional representation—in which multiple candidates are elected in each ward and voters rank candidates in order of preference. New ward boundaries were proposed by Boundaries Scotland in 2021, which would have reduced the total number of councillors to 34. However, these were rejected by the Scottish Parliament and the boundaries used at the previous election remained in place.

<span class="mw-page-title-main">2022 Aberdeenshire Council election</span> Aberdeenshire Council election

Elections to Aberdeenshire Council took place on Thursday 5 May 2022 on the same day as the 31 other Scottish local government elections. As with other Scottish council elections, it was held using single transferable vote (STV) – a form of proportional representation – in which multiple candidates are elected in each ward and voters rank candidates in order of preference.

The 2022 Flintshire County Council election took place on 5 May 2022 to elect all 67 councillors on Flintshire County Council in Wales, as part of the 2022 Welsh local elections.

<span class="mw-page-title-main">2023 Bournemouth, Christchurch and Poole Council election</span> 2023 English local election

The 2023 Bournemouth, Christchurch and Poole Council election took place on 4 May, 2023, to elect all 76 members of Bournemouth, Christchurch and Poole Council in Dorset, England.

<span class="mw-page-title-main">2023 Babergh District Council election</span> 2023 local government election in Babergh

The 2023 Babergh District Council election was held on 4 May 2023 to elect members of Babergh District Council in Suffolk, England. This was on the same day as other local elections.

<span class="mw-page-title-main">2023 Blackpool Council election</span> 2023 local election in Blackpool

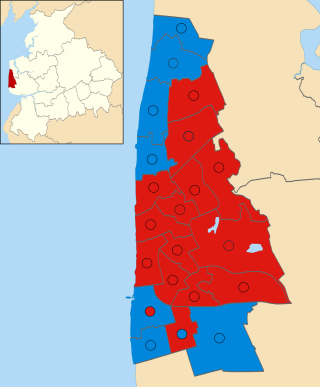
The 2023 Blackpool Council election was held on 4 May 2023 to elect members of Blackpool Council in Lancashire, England. All 42 councillors were up for election. This was at the same time as other local elections across England.

The 2023 Boston Borough Council election took place on 4 May, 2023, to elect all 30 members of Boston Borough Council in Lincolnshire, England.

<span class="mw-page-title-main">2023 East Devon District Council election</span> 2023 English local election

The 2023 East Devon District Council election took place on 4 May 2023 to elect all 60 members of East Devon District Council in Devon, England. This was on the same day as other local elections across England.

References

  1. Of the 25 councillors prior to the election who did not belong to a registered political party, 18 formed the "Independents for Herefordshire" group led by David Hitchiner, 6 formed the "True Independents" group led by Bob Matthews, and 1 (Jim Kenyon) did not belong to any group.
  2. There were six councillors prior to the election who had been elected as It's Our County candidates, but all sat in the "Independents for Herefordshire" group. Of those six, three stood again for It's Our County in 2023 (Dave Boulter, Liz Harvey and David Summers), two stood as independent candidates (Elizabeth Foxton and John Harrington), and one did not stand for re-election (Tracy Bowes).
  1. "Local Government Elections". Herefordshire Council . Retrieved 27 April 2023.
  2. McEwan, Gavin (3 May 2023). "Herefordshire election: what is the current state of the parties?". Ledbury Reporter. Retrieved 22 May 2023.
  3. Pearson, James; Jones, Megan (19 May 2023). "Minority council elects Conservative leader". BBC News. Retrieved 20 May 2023.
  4. "District elections and candidates". Herefordshire Council . Retrieved 27 April 2023.
  5. McEwan, Gavin (12 May 2023). "Herefordshire elections: the full results". Hereford Times. Retrieved 22 May 2023.
  6. "District (ward) election results". Herefordshire Council. Retrieved 22 May 2023.
  7. Boothroyd, David (16 February 2024). "Will you ever win?". Local Councils. Thorncliffe. Retrieved 11 May 2024.