2000 Herefordshire Council election

Last updated

The 2000 Herefordshire Council election was held on 4 May 2000 to elect all councillors on Herefordshire Council. [1]

Contents

All 37 wards were contested - each electing either one or two members to the council. The election resulted in the council passing into "no overall control" with the Liberal Democrats, who held 21 seats, forming the largest group in the council chamber. [2]

Results

Herefordshire Local Election Result 2000 [1]
PartySeatsGainsLossesNet gain/lossSeats %Votes %Votes+/−
  Liberal Democrats 2121-+2136.2131.418,119
  Conservative 2020-+2034.542.024,576
  Independent 77-+712.013.37,789
  Labour 44-+46.98.14,721
  Green 11-+11.74.32,538
 Protect Ross-on-Wye00--0.00.54317
 Herefordshire People Before Politics00--0.00.49291
  BNP 00--0.00.18109

The overall turnout was 39.12% with a total of 58,460 valid votes cast. A total of 283 ballots were rejected.

Council Composition

After the election, the composition of the council was:

2120741
Liberal DemocratsConservativeIndependentLabourG

G - Green Party

Ward Results

All councillors elected will serve a three-year term. All results are listed below: [3]

Aylestone

Aylestone (2 Seats)
PartyCandidateVotes%±%
Liberal Democrats Colin George Rumsey48621.08
Liberal Democrats Susan Andrews48020.82
Conservative Paul Rone41718.08
Conservative Peter Stanton Berry39617.17
Truly IndependentPeter George England29012.58
Green David Bright Gillett1325.72
Green Adam Frank Jethro Boardman1054.55
Majority632.74
Turnout 2,30629.65
Liberal Democrats hold Swing

Backbury

Backbury (1 Seat)
PartyCandidateVotes%±%
Conservative Josephine Elisabeth Pemberton54554.34
Liberal Democrats David James Sudlow45845.66
Majority878.68
Turnout 1,00345.84
Conservative hold Swing

Belmont

Belmont (2 Seats)
PartyCandidateVotes%±%
Liberal Democrats John Walter Newman66440.02
Liberal Democrats Clement Allan Tudge62737.80
Labour David Stewart Thomson18711.27
Conservative Stewart Arthur Morgan985.91
Conservative Henry Ball835.00
Majority44026.53
Turnout 1,65923.53
Liberal Democrats hold Swing

Bircher

Bircher (1 Seat)
PartyCandidateVotes%±%
Conservative John Pudge Price69950.84
Independent William Luis Sebastian Bowen67649.16
Majority231.68
Turnout 1,37561.66
Conservative hold Swing

Bringsty

Bringsty (1 Seat)
PartyCandidateVotes%±%
Conservative Thomas William Hunt53854.62
Independent David Cave33734.21
Green Clara Mat Slater11011.17
Majority22723.04
Turnout 98542.68
Conservative hold Swing

Bromyard

Bromyard (2 Seats)
PartyCandidateVotes%±%
Conservative Richard Edward James91734.31
Independent Christopher John Grover65024.32
Independent Bernard Hunt56521.14
Independent William Albert Gibbard27010.10
Liberal Democrats Terence Leonard Kimberley White1626.06
BNP John Bernard Haycock712.65
BNP Tracy Michael Paton381.42
Majority853.18
Turnout 2,67335.40
Conservative hold Swing
Independent hold Swing

Brumarsh

Brumarsh (1 Seat)
PartyCandidateVotes%±%
Conservative John Gerrans Stuart Guthrie59553.70
Liberal Democrats Roland Charles Summers35131.68
Labour Roy Brookes Hall16214.62
Majority24422.02
Turnout 1,10836.02
Conservative hold Swing

Central

Central (2 Seats)
PartyCandidateVotes%±%
Liberal Democrats David John Fleet37317.95
Liberal Democrats Basil Cuthbert Baldwin36517.56
Green Michael John Harrison30714.78
Conservative Andrew Philip Law30314.58
Green Julia Parker-Harris28913.91
Conservative Patricia Edith Paul27213.09
Labour Sylvia Petula Ann Daniels1698.13
Majority582.78
Turnout 2,07830.16
Liberal Democrats hold Swing

Credenhill

Credenhill (1 Seat)
PartyCandidateVotes%±%
Independent Robert Ivor Matthews48662.55
Liberal Democrats Terence Edmond John Smissen21427.54
Herefordshire: People Before PoliticsTimothy Charles Lewis779.91
Majority13735.01
Turnout 77733.71
Independent hold Swing

Dinmore Hill

Dinmore Hill (1 Seat)
PartyCandidateVotes%±%
Conservative James Richard Makin52152.00
Liberal Democrats Lionel John Meredith48148.00
Majority404.00
Turnout 41.081,002
Conservative hold Swing

Frome

Frome (1 Seat)
PartyCandidateVotes%±%
Green Guy Harry Morgan Woodford67359.19
Conservative Richard John Gavin Fowler46440.81
Majority20918.38
Turnout 1,13747.08
Green hold Swing

Golden Cross

Golden Cross (1 Seat)
PartyCandidateVotes%±%
Conservative Roger James Phillips82480.94
Liberal Democrats Rodney Broadwood Kilvert19419.06
Majority63061.88
Turnout 1,01853.26
Conservative hold Swing

Golden Valley

Golden Valley (1 Seat)
PartyCandidateVotes%±%
Independent Arthur Graham Morgan47743.13
Liberal Democrats Adrian Holt33830.56
Conservative Raymond Maxwell Chillington24722.33
Green Paul Andrew Sullivan443.98
Majority13912.57
Turnout 1,10648.28
Independent hold Swing

Hagley

Hagley (1 Seat)
PartyCandidateVotes%±%
Liberal Democrats Alan Williams49050.99
Conservative Nicholas Justin Howells47149.01
Majority191.98
Turnout 96137.61
Liberal Democrats hold Swing

Hampton Court

Hampton Court (1 Seat)
PartyCandidateVotes%±%
Liberal Democrats Michael John Kimbery57461.59
Conservative Allan Lloyd35838.41
Majority21623.18
Turnout 93248.25
Liberal Democrats hold Swing

Hinton

Hinton (2 Seats)
PartyCandidateVotes%±%
Labour Arthur Christopher Richard Chappell58831.28
Labour Winefride Ursula Attfield41522.07
Liberal Democrats Aubrey Thomas Oliver29315.58
Independent David Richard Chatfield26814.26
Conservative John Lawrence Nowell1749.26
Conservative Carol Ellen Courtenay Cranch1427.55
Majority1226.49
Turnout 188031.61
Labour hold Swing
Labour hold Swing

Hollington

Hollington (1 Seat)
PartyCandidateVotes%±%
Liberal Democrats William John Stuart Thomas32038.60
Independent Ellis Anthony Owen27933.66
Conservative Alan Wilson Pritchard23027.74
Majority414.94
Turnout 82935.71
Liberal Democrats hold Swing

Holmer

Holmer (2 Seats)
PartyCandidateVotes%±%
Liberal Democrats Polly Andrews52628.68
Liberal Democrats Peter Derwent Evans43523.72
Conservative Isla Jean Owen34718.92
Conservative Patricia Woollard32117.50
Labour Robert Douglas Hardwick20511.18
Majority884.80
Turnout 1,83419.34
Liberal Democrats hold Swing

Hope End

Hope End (2 Seats)
PartyCandidateVotes%±%
Conservative Roy Vincent Stockton1,17032.99
Conservative Rees Mills99127.95
Liberal Democrats June Patricia Armstrong90025.38
Green Katrina Emma Turnbull48513.68
Majority912.57
Turnout 3,54646.20
Conservative hold Swing

Kington

Kington (1 Seat)
PartyCandidateVotes%±%
Liberal Democrats Terence Morgan James66150.77
Conservative Elizabeth Christine Shayler55842.86
Herefordshire People Before PoliticsJohn Francis Kelly836.37
Majority1037.91
Turnout 1,30249.44
Liberal Democrats hold Swing

Ledbury

Ledbury (2 Seats)
PartyCandidateVotes%±%
Conservative Peter Edward Harling88833.29
Liberal Democrats Barry Frank Ashton64624.21
Conservative Jonathan Richard Mills57921.70
Labour Noel Roberts28110.53
Liberal Democrats Edwin James Davey27410.27
Majority672.51
Turnout 2,66835.41
Conservative hold Swing
Liberal Democrats hold Swing

Leominster East & South

Leominster East & South (2 Seats)
PartyCandidateVotes%±%
Conservative Dick Burke64529.38
Labour John Parry Thomas56825.88
Conservative Catherine Mary Fothergill55025.06
Labour Patricia Mary Hale43219.68
Majority180.82
Turnout 2,19528.65
Conservative hold Swing
Labour hold Swing

Leominster North

Leominster North (2 Seats)
PartyCandidateVotes%±%
Conservative Peter Jones57523.65
Conservative June Patricia French56923.41
Liberal Democrats Gordon John Morris40316.58
Liberal Democrats Wendy Dorothy Jancey30512.55
Labour Peter John Goody2339.58
Labour Colin Leslie Tether2279.34
Independent Nicklas Nenadich1194.89
Majority1666.83
Turnout 2,43131.18
Conservative hold Swing

Lyonshall With Titley

Lyonshall With Titley (1 Seat)
PartyCandidateVotes%±%
Conservative Pauline Robinson61465.18
Liberal Democrats Brian Williams Lewis27429.09
Green David Oliver545.73
Majority34036.09
Turnout 94253.69
Conservative hold Swing

Marcle Ridge

Marcle Ridge (1 Seat)
PartyCandidateVotes%±%
Independent Donald William Rule74954.91
Conservative Frances Anne Jordan61545.09
Majority1349.82
Turnout 1,36437.56
Independent hold Swing

Merbach

Merbach (1 Seat)
PartyCandidateVotes%±%
Conservative Nigel John Jones Davies54455.57
Liberal Democrats June Margaret Pickering43544.43
Majority10911.14
Turnout 97948.45
Conservative hold Swing

Mortimer

Mortimer (1 Seat)
PartyCandidateVotes%±%
Conservative Lilian Olwyn Barnett70565.95
Liberal Democrats Andrew Coles36434.05
Majority34131.90
Turnout 1,06952.78
Conservative hold Swing

Old Gore

Old Gore (1 Seat)
PartyCandidateVotes%±%
Independent John William Edwards51660.00
Liberal Democrats Lucy Helen Green34440.00
Majority17220.00
Turnout 86040.67
Independent hold Swing

Penyard

Penyard (1 Seat)
PartyCandidateVotes%±%
True IndependentEunice-May Saunders70359.93
Conservative David Michael Hoddinott47040.07
Majority23319.86
Turnout 1,17347.56
True Independent hold Swing

Ross-on-Wye East

Ross-on-Wye East (2 Seats)
PartyCandidateVotes%±%
Independent Joyce Helen Thomas1,27442.27
Liberal Democrats Cynthia Joyce Davis59619.77
Conservative Gordon Lucas45515.10
Conservative Lilian Violet Jacqueline Danter37212.34
Protect Ross-on-WyeConstance Eileen Edwards1906.31
Protect Ross-on-WyeStuart John Morgan1274.21
Majority1414.67
Turnout 3,01435.74
Independent hold Swing
Liberal Democrats hold Swing

Ross-on-Wye West

Ross-on-Wye West (2 Seats)
PartyCandidateVotes%±%
Liberal Democrats Mark Robert Cunningham53228.58
Liberal Democrats Anthony John Allen49726.71
Conservative Phillip Grenfell Haydn Cutter45824.61
Conservative Michael Jennings37420.10
Majority392.10
Turnout 1,86128.82
Liberal Democrats hold Swing

St. Martins

St. Martins (2 Seats)
PartyCandidateVotes%±%
Liberal Democrats Robin John Andrews42925.75
Labour Robert Preece32819.69
Labour Laurence Noble27816.69
Liberal Democrats Richard Thomas26816.09
Residents Wendy Jane Jones1307.80
Conservative Gillian Rosamond Clifford1217.26
Conservative Marsha Elizabeth Barnsley1126.72
Majority503.00
Turnout 1,66627.29
Liberal Democrats hold Swing
Labour hold Swing

St. Nicholas

St. Nicholas (2 Seats)
PartyCandidateVotes%±%
Liberal Democrats Evaline Mary Bew43626.39
Liberal Democrats David Cyril Short40924.76
Conservative Charlotte Williams Lewis28917.49
Conservative Anthony Edwin Allen Woollard26415.98
Labour John George Davies25415.38
Majority1207.27
Turnout 1,65227.73
Liberal Democrats hold Swing

Three Elms

Three Elms (2 Seats)
PartyCandidateVotes%±%
Conservative Jason Hankins57425.14
Liberal Democrats Leslie Mervyn Henson Andrews51722.65
Conservative Arthur George Staton50221.99
Liberal Democrats Fiona Evelyn Mary Chiswell47120.63
Labour Elizabeth Helen Ruck2199.59
Majority150.66
Turnout 2,28329.20
Conservative hold Swing
Liberal Democrats hold Swing

Tupsley

Tupsley (2 Seats)
PartyCandidateVotes%±%
Conservative Jane Ann Carter80824.19
Liberal Democrats Marcelle Denise Lloys-Hayes77223.11
Liberal Democrats William James Walling75222.52
Conservative Susan Diane Trout70221.02
Labour Richard Attfield1755.24
Herefordshire: People Before PoliticsSimon Christopher David Zeigler1313.92
Majority200.59
Turnout 3,34035.7
Conservative hold Swing
Liberal Democrats hold Swing

Upton

Upton (1 Seat)
PartyCandidateVotes%±%
Conservative John Stone73268.35
Green Gary Nicholas Burton33931.65
Majority39336.70
Turnout 1,07146.84
Conservative hold Swing

Weobley

Weobley (1 Seat)
PartyCandidateVotes%±%
Conservative John Hutcheson Ruell Goodwin62258.90
Liberal Democrats Christine Ferguson43441.10
Majority18817.80
Turnout 1,056
Conservative hold Swing

Related Research Articles

<span class="mw-page-title-main">Malvern Hills District</span> Non-metropolitan district in England

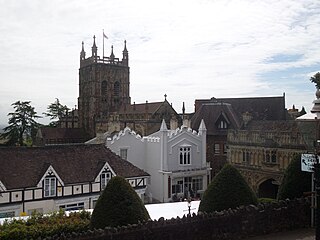
Malvern Hills is a local government district in Worcestershire, England. Its council is based in Malvern, the district's largest town. The district also includes the towns of Tenbury Wells and Upton-upon-Severn and a large rural area covering much of the western side of the county, including numerous villages. The district is named after the Malvern Hills, which are a designated Area of Outstanding Natural Beauty.

Herefordshire Council elections are held every four years. Herefordshire Council is the local authority for the unitary authority and ceremonial county of Herefordshire in England. Since the last boundary changes in 2015, 53 councillors have been elected from 53 wards.

<span class="mw-page-title-main">Herefordshire Council</span> Unitary local government authority for the county of Herefordshire in England

Herefordshire Council is the local authority for the county of Herefordshire in England. It is a unitary authority, combining the powers of a district and county council.

This article lists the British National Party's election results in the UK parliamentary, Scottish parliamentary and Welsh Assembly elections, as well as in the European Parliament elections and at a local level.

Thanet District Council elections are held every four years to elect Thanet District Council in Kent, England. Since the last boundary changes in 2003 the council has comprised 56 councillors representing 23 wards.

<span class="mw-page-title-main">2004 Wyre Forest District Council election</span> Election in Worcestershire, England

The 2004 Wyre Forest District Council election took place on 10 June 2004 to elect members of Wyre Forest District Council in Worcestershire, England. The whole council was up for election with boundary changes since the last election in 2003. The council stayed under no overall control, but with the Conservatives taking over as the largest party on the council from the Health Concern party.

<span class="mw-page-title-main">2011 South Norfolk District Council election</span> 2011 UK local government election

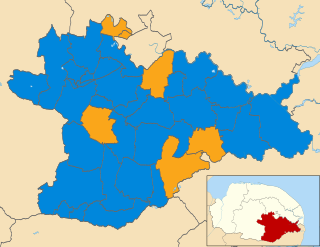
The elections to South Norfolk District Council were held on Thursday 5 May 2011 along with various other local elections around England, elections to the Scottish Parliament, National Assembly of Wales and Northern Ireland Assembly, and a referendum on whether to adopt the Alternative Vote electoral system for elections to the House of Commons. All 46 council seats were up for election. The previous council was controlled by the Conservatives, with the Liberal Democrats being the only opposition.

<span class="mw-page-title-main">2011 Torridge District Council election</span> 2011 UK local government election

The 2011 Torridge District Council election took place on 5 May 2011 to elect members of Torridge District Council in Devon, England. The whole council was up for election and the council stayed under no overall control.

<span class="mw-page-title-main">2008 Huntingdonshire District Council election</span> 2008 UK local government election

The 2008 Huntingdonshire District Council election took place on 1 May 2008 to elect members of Huntingdonshire District Council in Cambridgeshire, England. One third of the council was up for election and the Conservative Party stayed in overall control of the council.

The 1999 Wychavon District Council election took place on 6 May 1999 to elect members of Wychavon District Council in Worcestershire, England. The whole council was up for election and the Conservative Party gained overall control of the council from no overall control.

<span class="mw-page-title-main">2003 Wychavon District Council election</span> 2003 UK local government election

The 2003 Wychavon District Council election took place on 1 May 2003 to elect members of Wychavon District Council in Worcestershire, England. The whole council was up for election with boundary changes since the last election in 1999 reducing the number of seats by four. The Conservative party stayed in overall control of the council.

<span class="mw-page-title-main">2007 Wychavon District Council election</span> 2007 UK local government election

The 2007 Wychavon District Council election took place on 3 May 2007 to elect members of Wychavon District Council in Worcestershire, England. The whole council was up for election and the Conservative party stayed in overall control of the council.

<span class="mw-page-title-main">2003 West Oxfordshire District Council election</span> 2003 UK local government election

The 2003 West Oxfordshire District Council election took place on 1 May 2003 to elect members of West Oxfordshire District Council in Oxfordshire, England. One third of the council was up for election and the Conservative Party stayed in overall control of the council.

<span class="mw-page-title-main">2004 West Oxfordshire District Council election</span>

The 2004 West Oxfordshire District Council election took place on 10 June 2004 to elect members of West Oxfordshire District Council in Oxfordshire, England. One third of the council was up for election and the Conservative Party stayed in overall control of the council.

<span class="mw-page-title-main">2006 West Oxfordshire District Council election</span> 2006 UK local government election

The 2006 West Oxfordshire District Council election took place on 4 May 2006 to elect members of West Oxfordshire District Council in Oxfordshire, England. One third of the council was up for election and the Conservative Party stayed in overall control of the council.

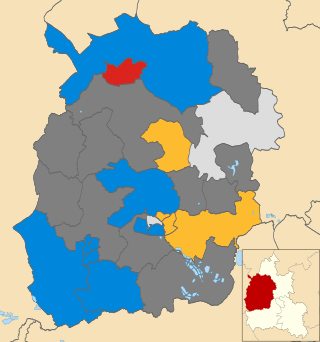
Elections to Herefordshire Council were held on 1 May 2003, along with other local elections in England and Scotland. Due to prior boundary reviews, all 38 wards were contested - with each ward electing either one two or three members to the council, with each successful candidate serving a four-year term of office, expiring in 2007. The council remained in no overall control, with the Conservative Party replacing the Liberal Democrats as the largest party on the council, winning 20 out of a total of 56 seats on the council.

<span class="mw-page-title-main">2017 Essex County Council election</span> 2017 UK local government election

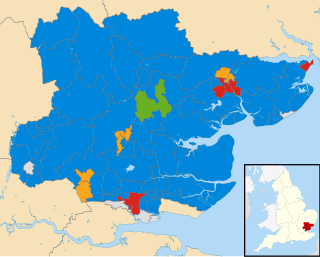
Elections to Essex County Council took place on 4 May 2017 as part of the 2017 local elections. All 75 councillors were elected from 70 electoral divisions, which each returned either one or two councillors by first-past-the-post voting for a four-year term of office.

The 2019 East Lindsey District Council election took place on 2 May 2019 to elect all members of East Lindsey District Council in England. The Conservatives retained overall control of the council.

The 2022 Flintshire County Council election took place on 5 May 2022 to elect all 67 councillors on Flintshire County Council in Wales, as part of the 2022 Welsh local elections.

References

  1. 1 2 "Past District Election Results - Herefordshire Council". Archived from the original on 14 May 2010. Retrieved 13 September 2010.
  2. "Herefordshire Council Election Full Results". Hereford Times. 10 May 2000. Archived from the original on 8 January 2021. Retrieved 6 July 2021.
  3. "DISTRICT COUNCIL ELECTION DECLARATION OF RESULT OF POLL" (PDF). Archived from the original (PDF) on 19 August 2016. Retrieved 6 July 2021.