Related Research Articles

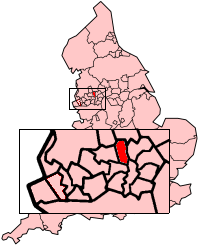
The Metropolitan Borough of Bury is a metropolitan borough of Greater Manchester in England. It is north of Manchester, to the east of Bolton and west of Rochdale. The borough is centred around the town of Bury but also includes other towns such as Ramsbottom, Tottington, Radcliffe, Whitefield and Prestwich. Bury bounds the Lancashire districts of Rossendale and Blackburn with Darwen to the north. With a population of 193,823 in 2021, it is the smallest borough in Greater Manchester.
The 2005 United Kingdom local elections were held on Thursday 5 May 2005, with various councils and local government seats being contested in England and Northern Ireland, and a local referendum taking place on the Isle of Wight on the issue of a directly elected mayor. These local elections were held in conjunction with the 2005 general election across the entire United Kingdom.
In the context of local authorities in the United Kingdom, no overall control is a situation in which no single political group achieves a majority of seats, analogous to a hung parliament. Of the 248 councils who had members up for election in the 2019 local elections, 73 resulted in a NOC administration. In the 2021 election, 14 resulted in no overall control. The term can still be used for several other countries, such as for two local councils of Malta and the General Assembly of Budapest in Hungary.
Elections to Bury Council were held on 7 May 1998. One third of the council was up for election and the Labour Party kept overall control of the council. Overall turnout was 26.85%.
Elections to Bury Council were held on 6 May 1999. One third of the council was up for election and the Labour Party kept overall control of the council. Overall turnout was 28.14%.
Local elections took place for one third of the seats of the thirty-six metropolitan boroughs on 1 May 1975. The seats had previously been contested in May 1973, when the Labour Party had achieved great success. In the 1975 elections the Conservative Party made widespread gains, with a net gain of 199 seats and Labour had a net loss of 206. The Liberal Party had a net loss of 10 seats, and Independents a loss of 5. "Others", including Ratepayers, Independent Labour councillors and Progressives made net gains of 22.

The 2002 Harlow District Council election took place on 2 May 2002 to elect members of Harlow District Council in Essex, England. The whole council was up for election with boundary changes since the last election in 2000 reducing the number of seats by 9. The Labour party lost overall control of the council to no overall control.
Elections to Bury Council were held on 1 May 2008. One third of the council was up for election. The Conservative Party gained overall control of the council, from previous No Overall Control of any party.
The 2000 Welwyn Hatfield District Council election took place on 6 May 2000 to elect members of Welwyn Hatfield District Council in Hertfordshire, England. One third of the council was up for election and the Labour Party gained overall control of the council from no overall control. Overall turnout in the election was 31.71%, down from 33.09% in the 1999 election.

Elections to Suffolk County Council took place on 2 May 2013 as part of the 2013 United Kingdom local elections. 75 councillors were elected from 63 electoral divisions, which returned either one or two county councillors each by first-past-the-post voting for a four-year term of office. The electoral divisions were the same as those used at the previous election in 2009.
Elections to Bury Council took place on 5 May 2011. One third of the council was up for election, and the Labour Party took overall control of the council.
Elections to Bury Council took place on 6 May 2010. One third of the Council was up for election and the Conservative Party lost overall control of the Council.

The 2012 Huntingdonshire District Council election took place on 3 May 2012 to elect members of Huntingdonshire District Council in Cambridgeshire, England. One third of the council was up for election and the Conservative Party stayed in overall control of the council.

The 1994 Hammersmith and Fulham Borough Council election took place on 5 May 1994 to elect members of Hammersmith and Fulham London Borough Council in London, England. The whole council was up for election and the Labour Party regained overall control of the council, which it had lost during the previous council term.
Elections to Bury Metropolitan Borough Council were held on 2 May 2002. One-third of the council was up for election and the Labour Party kept overall control of the council.
Elections to Bury Metropolitan Borough Council were held on 1 May 2003. One-third of the council was up for election and the Labour Party kept overall control of the council.
Elections to Bury Metropolitan Borough Council were held on 3 May 2007. One third of the council was up for election, and the council remained in No Overall Control, with the Conservative Party overtaking the Labour Party as the largest group.
West Suffolk District is a local government district in Suffolk, England. It was established in 2019 as a merger of the previous Forest Heath District with the Borough of St Edmundsbury. The council is based in Bury St Edmunds, the district's largest town. The district also contains the towns of Brandon, Clare, Haverhill, Mildenhall and Newmarket, along with numerous villages and surrounding rural areas. In 2021 it had a population of 180,820.

The 2022 Bury Metropolitan Borough Council election took place on 5 May 2022. Due to boundary changes, all 51 councillors were elected at the same time. The election took place alongside other local elections across the United Kingdom.

The 2022 Rochdale Metropolitan Borough Council election took place as of 5 May 2022. Due to boundary changes, all 60 councillors were elected at the same time. The election took place alongside other local elections across the United Kingdom.
References
- ↑ "Bury". BBC News Online . Retrieved 16 December 2009.