1998 Manchester City Council election

Last updated

Elections to Manchester Council were held on Thursday, 7 May 1998. One third of the council was up for election, with each successful candidate to serve a four-year term of office, expiring in 2002. A vacancy each in Ardwick and Harpurhey were also being contested. There were two Labour candidates for Barlow Moor ward, the result of de-selected Labour Councillor Arthur Maloney securing an official Labour Party nomination before he was replaced by a new candidate. The Independent Labour candidates stood as Labour Peace 2000. Overall turnout was 20.5%, with Labour retaining control of the council. [1] [2]

Contents

Election result

Manchester Council Election Result 1998
PartySeatsGainsLossesNet gain/lossSeats %Votes %Votes+/−
  Labour 3011085.752.934,027-7.2%
  Liberal Democrats 511014.328.518,294+6.5%
  Conservative 00000.012.88,261-0.2%
  Green 00000.03.42,200+0.5%
  Socialist Labour 00000.01.5997+1.5%
  Independent Labour 00000.00.5319+0.5%
  Communist 00000.00.147+0.1%
  Independent 00000.00.042-0.3%
  Socialist Alternative 00000.00.032-0.5%
 Direct Action00000.00.028+0.0%
  Independent Liberal 00000.00.017+0.0%

After the election, the composition of the council was as follows:

PartySeats  +/-  
Labour 840
Liberal Democrats 150
Labour hold

Ward results

Ardwick

Ardwick
PartyCandidateVotes%±%
Labour Lawrence Murphy*65366.0-10.5
Labour Bernard Priest577
Liberal Democrats Derek Maloney11811.9+1.4
Liberal Democrats David Gray107
Conservative Fanny Davenport10610.7+1.0
Conservative John Davenport97
Green Bruce Bingham565.7+2.4
Socialist Labour Rachel Newton565.7+5.7
Majority45954.1-12.0
Turnout 1,770
Labour hold Swing
Labour hold Swing -5.9

Baguley

Baguley
PartyCandidateVotes%±%
Labour Thomas Farrell*1,04469.8-4.3
Conservative Robert Caddick29119.5+4.0
Liberal Democrats Anthony McGarr16110.8+3.1
Majority75350.3-8.3
Turnout 1,496
Labour hold Swing -4.1

Barlow Moor

Barlow Moor
PartyCandidateVotes%±%
Liberal Democrats John Leech 1,67157.8+9.3
Labour Jonathan Whitehead77926.9-14.5
Labour Arthur Maloney*1976.8-34.6
Conservative Thomas Bumby1786.2-0.9
Socialist Labour Margaret Manning682.4+2.4
Majority89230.8+23.7
Turnout 2,893
Liberal Democrats gain from Labour Swing +11.9

Benchill

Benchill
PartyCandidateVotes%±%
Labour George Harding*79176.1-1.6
Liberal Democrats Janice Redmond17817.1+7.8
Conservative Anthony Green706.7-0.9
Majority61360.0-8.4
Turnout 1,039
Labour hold Swing -4.7

Beswick and Clayton

Beswick and Clayton
PartyCandidateVotes%±%
Labour Andrew Harland96052.4+6.3
Liberal Democrats Martina Dunican*80544.0-3.9
Conservative Elena Stars663.6+0.6
Majority1558.5+6.7
Turnout 1,831
Labour gain from Liberal Democrats Swing +5.1

Blackley

Blackley
PartyCandidateVotes%±%
Labour Harold Lyons*1,04368.4+4.9
Conservative Jacqueline Rowland24416.0+3.0
Liberal Democrats Peter Matthews23715.6+4.8
Majority79952.4+1.9
Turnout 1,524
Labour hold Swing +0.9

Bradford

Bradford
PartyCandidateVotes%±%
Labour Neil Swannick75958.4-17.8
Liberal Democrats Peter Fairhurst44934.5+20.5
Conservative Joyce Haydock927.1+0.6
Majority31023.8-38.4
Turnout 1,300
Labour hold Swing -19.1

Brooklands

Brooklands
PartyCandidateVotes%±%
Labour Glynn Evans*1,11154.5-1.9
Conservative Ian Bradshaw66732.7-0.2
Liberal Democrats Bill Fisher26012.8+3.9
Majority44421.8-1.7
Turnout 2,038
Labour hold Swing -0.8

Burnage

Burnage
PartyCandidateVotes%±%
Labour Marilyn Taylor*1,34563.0-3.8
Conservative Jeffrey Leach39618.5+3.4
Liberal Democrats Robert Harrison32515.2-0.6
Green Jane Hutchins703.3+3.3
Majority94944.4-6.6
Turnout 2,136
Labour hold Swing -3.6

Central

Central
PartyCandidateVotes%±%
Labour Thomas Findlow*64376.2-1.5
Green William Kearns10112.0+10.3
Liberal Democrats David Radcliffe10011.8+3.1
Majority54264.2-1.5
Turnout 844
Labour hold Swing -5.9

Charlestown

Charlestown
PartyCandidateVotes%±%
Labour Basil Curley*1,08365.4-10.8
Liberal Democrats Rodney Isherwood32219.5+10.2
Conservative Christine Saunders26015.7+3.3
Majority76146.0-17.8
Turnout 1,655
Labour hold Swing -10.5

Cheetham

Cheetham
PartyCandidateVotes%±%
Labour Martin Pagel*1,15346.7-36.4
Liberal Democrats Qassim Afzal1,09644.4+38.0
Conservative Dorothy Keller1767.1+7.1
Independent Ahmed Zubair421.7+1.7
Majority572.3-70.3
Turnout 2,467
Labour hold Swing -37.2

Chorlton

Chorlton
PartyCandidateVotes%±%
Labour Co-op Bernard Selby*1,29843.5-24.6
Conservative Malcolm Cleall-Hill62420.9+3.0
Green Julian Parry40413.5+7.0
Liberal Democrats Cath Hall39313.2+5.7
Socialist Labour Evan Pritchard2678.9+8.9
Majority67422.6-27.6
Turnout 2,986
Labour hold Swing -13.8

Crumpsall

Crumpsall
PartyCandidateVotes%±%
Labour Alan Spinks*1,46268.1-6.1
Conservative Nigel Dugmore37917.6+2.2
Liberal Democrats David Gordon30714.3+6.5
Majority1,08350.4-8.4
Turnout 2,148
Labour hold Swing -4.1

Didsbury

Didsbury
PartyCandidateVotes%±%
Labour Geoffrey Bridson*1,70043.5+5.3
Conservative Peter Hilton1,05126.9-5.5
Liberal Democrats David Sandiford1,00925.8-2.3
Green Tom McGahan1473.8+3.8
Majority64916.6+10.9
Turnout 3,907
Labour hold Swing +5.4

Fallowfield

Fallowfield
PartyCandidateVotes%±%
Labour Peter Morrison*90053.4-16.5
Liberal Democrats David Hennigan26715.8+5.4
Conservative Simon Davenport26515.7+2.2
Independent Labour Tommy Kelly1086.4+6.4
Green Micheal Daw834.9-1.4
Socialist Labour Paul Hepburn633.7+3.7
Majority63337.5-18.9
Turnout 1,686
Labour hold Swing -10.9

Gorton North

Gorton North
PartyCandidateVotes%±%
Liberal Democrats Wendy Helsby*1,33350.0-2.2
Labour James Battle1,17344.0+1.4
Conservative Albert Walsh1033.9-0.6
Socialist Labour Alan Wardlaw552.1+2.1
Majority1606.0-3.6
Turnout 2,664
Liberal Democrats hold Swing -1.8

Gorton South

Gorton South
PartyCandidateVotes%±%
Liberal Democrats John Bridges*1,34760.8+3.5
Labour Christopher Lowe70531.8-6.8
Conservative Ann Hodkinson753.4+0.4
Green Emma Hamilton612.8+1.7
Direct ActionJames Piper281.3+1.3
Majority64229.0+10.3
Turnout 2,216
Liberal Democrats hold Swing +5.1

Harpurhey

Harpurhey
PartyCandidateVotes%±%
Labour Pat Karney* 804 63.8 -8.7
Labour Joanne Green761
Liberal Democrats Andrew Steele30023.8+12.0
Liberal Democrats Arthur Tozowonah212
Conservative Joan Coombes15612.4+3.2
Conservative Henry Coombes151
Majority46140.0-20.7
Turnout 1,260
Labour hold Swing
Labour hold Swing -10.3

Hulme

Hulme
PartyCandidateVotes%±%
Labour Mary Murphy*50863.4-10.6
Green Melanie Jarman10813.5+5.7
Liberal Democrats James Graham8811.0+3.5
Conservative Paul Kierman627.7+0.5
Communist Steve Riley182.2+2.2
Independent Liberal Charles Lyn-Lloyd172.1-1.3
Majority40049.9-16.2
Turnout 801
Labour hold Swing -8.1

Levenshulme

Levenshulme
PartyCandidateVotes%±%
Liberal Democrats Keith Whitmore*1,55057.7+0.5
Labour Nicholas Macgregor77128.7-5.7
Conservative Paul Davies1485.5+1.2
Socialist Labour John Garratt1043.9+3.9
Green Simon Chislett813.0-0.2
Socialist Alternative Andrew Pitts321.2+1.2
Majority77929.0+6.3
Turnout 2,686
Liberal Democrats hold Swing +3.1

Lightbowne

Lightbowne
PartyCandidateVotes%±%
Labour Kenneth Franklin*1,27771.7-4.1
Conservative William Clapham25814.5+0.9
Liberal Democrats Samantha McCormick24713.9+5.9
Majority1,01957.2-5.0
Turnout 1,782
Labour hold Swing -2.5

Longsight

Longsight
PartyCandidateVotes%±%
Labour Razak Saeed1,31455.9+9.0
Green Spencer Fitzgibbon36015.3+6.3
Liberal Democrats Abu Chowdhury27811.8-1.0
Conservative Paul Mostyn27411.7-12.6
Socialist Labour Hilary Partridge1235.2+5.2
Majority95440.6+18.0
Turnout 2,349
Labour hold Swing +1.3

Moss Side

Moss Side
PartyCandidateVotes%±%
Labour Roy Walters1,09576.3-3.2
Liberal Democrats Doreen Dankyl14310.0+2.3
Conservative Mary Barnes1268.8+1.2
Green Teresa Romagnuolo433.0-2.3
Communist John Pearson292.0+2.0
Majority95266.3-5.5
Turnout 1,436
Labour hold Swing -2.7

Moston

Moston
PartyCandidateVotes%±%
Labour Derek Shaw*1,24864.6-8.3
Conservative Gregory Skorzewski35618.4+3.2
Liberal Democrats Joyce Laslett32716.9+5.8
Majority89246.2-11.5
Turnout 1,931
Labour hold Swing -5.7

Newton Heath

Newton Heath
PartyCandidateVotes%±%
Labour Mathis Smitheman1,05180.4+0.2
Conservative Raymond Wattenbach13210.1-0.1
Liberal Democrats Barbera McKay1249.5+2.5
Majority91970.3+0.2
Turnout 1,307
Labour hold Swing +0.1

Northenden

Northenden
PartyCandidateVotes%±%
Labour Richard Cowell1,20556.2-12.8
Conservative Richard West39418.4+0.3
Green Lance Crookes32415.1+10.8
Liberal Democrats Jeanette McKay22210.3+1.7
Majority81137.8-13.1
Turnout 2,145
Labour hold Swing -6.5

Old Moat

Old Moat
PartyCandidateVotes%±%
Labour Andrew Fender*1,39649.8-17.2
Liberal Democrats Yasmen Zalzala1,03136.8+26.6
Conservative Christopher Brown2137.6-6.0
Green Lucy Fogarty1635.8-0.4
Majority36513.0-40.4
Turnout 2,803
Labour hold Swing -21.9

Rusholme

Rusholme
PartyCandidateVotes%±%
Labour John Byrne*94543.6-6.8
Liberal Democrats Ray Atkins69332.0+1.8
Independent Labour Michael Robinson2119.7+9.7
Conservative Karen Abbad1979.1-0.5
Green Bernard Ekbery743.4+3.4
Socialist Labour Trevor Wongsam472.2+2.2
Majority25211.6-8.7
Turnout 2,167
Labour hold Swing -4.3

Sharston

Sharston
PartyCandidateVotes%±%
Labour Hugh Barrett*91073.4-2.3
Liberal Democrats Karen Farnen19615.8+5.3
Conservative George Stars13410.8-0.1
Majority77662.6-2.3
Turnout 1,240
Labour hold Swing -3.8

Whalley Range

Whalley Range
PartyCandidateVotes%±%
Labour Bernard Stone*1,24751.4-8.8
Conservative John Kershaw51621.3-1.2
Liberal Democrats Richard Powell41417.1+5.5
Green Mary Candeland1255.2-0.4
Socialist Labour Steven Wynn1245.1+5.1
Majority73130.1-34.5
Turnout 2,426
Labour hold Swing -3.8

Withington

Withington
PartyCandidateVotes%±%
Liberal Democrats Audrey Firth*1,94361.2+8.0
Labour Isobel Freeman92129.0-8.3
Conservative Muhammed Naqui2227.0+0.9
Socialist Labour Janice Whitehead902.8+2.8
Majority1,02232.2+16.3
Turnout 3,176
Liberal Democrats hold Swing +8.1

Woodhouse Park

Woodhouse Park
PartyCandidateVotes%±%
Labour Paul Andrews*93672.2+1.9
Liberal Democrats Bill Ford36027.8+16.4
Majority57644.4-14.5
Turnout 1,296
Labour hold Swing -7.2

By-elections between 1998 and 1999

Cheetham By-Election 24 September 1998 [3]
PartyCandidateVotes%±%
Liberal Democrats Qassim Afzal1,39448.5+4.1
Labour Imran Rizvi1,34246.6-0.1
Conservative Dorothy Keller1414.9-2.2
Majority521.9-0.4
Turnout 2,877
Liberal Democrats gain from Labour Swing +2.1

Related Research Articles
<span class="mw-page-title-main">Manchester Central (UK Parliament constituency)</span> Parliamentary constituency in the United Kingdom, 1974 onwards

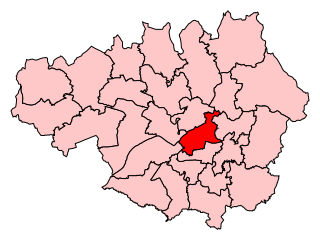
Manchester Central is a parliamentary constituency in Greater Manchester created in 1974 represented in the House of Commons of the UK Parliament since 2012 by Lucy Powell of the Labour Party and Co-operative Party.
<span class="mw-page-title-main">Manchester Withington (UK Parliament constituency)</span> Parliamentary constituency in the United Kingdom, 1918 onwards

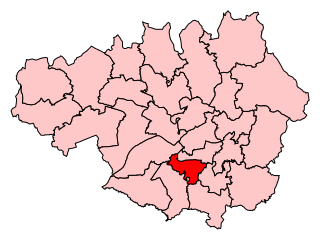
Manchester Withington is a constituency represented in the House of Commons of the UK Parliament since 2015 by Jeff Smith of Labour. Of the 30 seats with the highest percentage of winning majority in 2017, the seat ranks 25th with a 55.7% margin, and is the only one of the twenty nine of these seats won by the Labour Party in which the second-placed candidate was a Liberal Democrat, rather than Conservative. This is despite being a Conservative seat right up to 1987, then becoming relatively safely Labour, then Liberal Democrat from 2005 to 2015 before they lost on a large swing in 2015, after which Smith substantially increased his majority.

<span class="mw-page-title-main">Stockport Metropolitan Borough Council</span> Local government body in England

Stockport Metropolitan Borough Council (SMBC) is the local authority for the Metropolitan Borough of Stockport, Greater Manchester, England. The council is currently run by a Liberal Democrat minority administration. At the 2023 local elections, the Liberal Democrats gained two more seats, increasing their lead over the Labour Party to six seats, and retaining minority control. This lead is now five seats after one of the Liberal Democrats’ councillors resigned the whip, days after being re-elected. The Liberal Democrats currently have 29 seats, Labour 24, and Greens and the Edgeley Community Association each hold 3. There are 4 independents, three of whom are sponsored by the Heald Green Ratepayers (not formally a political party).

Salford City Council elections are generally held three years out of every four, with a third of the council being elected each time. Salford City Council is the local authority for the metropolitan borough of Salford in Greater Manchester, England. Since the last boundary changes in 2020, 60 councillors have been elected from 20 wards.

<span class="mw-page-title-main">2006 Manchester City Council election</span> 2006 UK local government election

Elections to Manchester City Council were held on 4 May 2006. One third of the council was up for election, with each successful candidate to serve a four-year term of office, expiring in 2010. The council stayed under Labour Party control, strengthened by four gains from the Liberal Democrats.

<span class="mw-page-title-main">2008 Manchester City Council election</span>

Elections to Manchester City Council took place on 1 May 2008. One third of the council was up for election - every ward of the city returned one councillor at this election out of the three councillors a ward in the city has.

<span class="mw-page-title-main">2007 Manchester City Council election</span> 2007 UK local government election

Elections to Manchester City Council took place on 3 May 2007. One third of the council was up for election, with each successful candidate to serve a four-year term of office, expiring in 2011. The council stayed under Labour Party control, on a reduced turnout of 28.3%.

<span class="mw-page-title-main">2010 Manchester City Council election</span> 2010 UK local government election

Elections to Manchester City Council were held on 6 May 2010, on the same day as the 2010 UK General Election. One-third of the council was up for election, with each successful candidate to serve a four-year term of office, expiring in 2014. Since the election there had been a further defection from the Liberal Democrats to Labour. Labour held overall control of the council, on a high turnout - owing to the general election on the same day - of 50.9%.

Elections to Manchester Council were held on Thursday, 4 May 1995. One third of the council was up for election, with each successful candidate to serve a four-year term of office, expiring in 1999. The Labour Party retained overall control of the Council.

Elections to Manchester City Council were held on Thursday, 2 May 1996. One third of the council was up for election, with each successful candidate to serve a four-year term of office, expiring in 2000. There were also two vacancies being contested; one in Blackley and the other in Woodhouse Park. The Labour Party retained overall control of the Council.

Elections to Manchester Council were held on Thursday, 6 May 1999. One third of the council was up for election, as well as a vacancy in Chorlton, with each successful candidate to serve a four-year term of office, expiring in 2003. The two Independent Labour candidates stood as "Peace 2000 England's Republic", a slight alteration on the previous year's "Labour Peace 2000". Overall turnout was up marginally from the previous year at 21.9%. The Labour Party retained overall control of the Council.

Elections to Manchester Council were held on Thursday, 4 May 2000. One third of the council was up for election, with each successful candidate to serve a four-year term of office, expiring in 2004. The two Independent Labour candidates stood again as "Peace 2000 England's Republican". Overall turnout fell slightly to 20.5% and the Labour Party retained overall control of the council.

Elections to Manchester Council were held on Thursday, 2 May 2002. One third of the council - alongside a vacancy in Moss Side - was up for election, with each successful candidate to serve a two-year term of office, expiring in 2004, due to the boundary changes and 'all-out' elections due to take place in that year. The Independent Labour candidates stood as "Independent Progressive Labour". Overall turnout rose to 24.4% and the Labour Party retained overall control of the Council.

Elections to Manchester City Council were held on Thursday, 1 May 2003. One third of the council was up for election as well as a vacancy in Benchill, with each successful candidate to serve a one-year term of office, expiring in 2004, due to the boundary changes and 'all-out' elections due to take place in that year. Turnout was down slightly to 22.2%, with Labour retaining overall control of the council. The election saw the Greens winning their first seat, and half a dozen Liberal Democrat gains resulting in Labour's majority being the lowest in twenty years. The three Independent Labour candidates stood as "Independent Progressive Labour".

<span class="mw-page-title-main">2004 Manchester City Council election</span> 2004 UK local government election

Manchester City Council elections were held on 10 June 2004.

<span class="mw-page-title-main">2011 Manchester City Council election</span> 2011 UK local government election

Elections to Manchester City Council were held on 5 May 2011, along with the 2011 United Kingdom Alternative Vote referendum. One third of the council was up for election, with each successful candidate serving a four-year term of office, expiring in 2015. The Labour Party retained overall control of the council, managing to win every seat contested. Overall turnout was a comparatively high 31.6%, although much down on the previous year's general election turnout of 50.9%.

<span class="mw-page-title-main">2016 England and Wales police and crime commissioner elections</span>

Elections of police and crime commissioners in England and Wales were held on 5 May 2016.

<span class="mw-page-title-main">2016 Manchester City Council election</span> 2016 local election in England, UK

Elections to Manchester City Council were held on 5 May 2016. One third of the council was up for election, with each successful candidate serving a two-year term of office, expiring in 2018, due to planned boundary changes. The Labour Party retained overall control of the council, managing to hold all but one seat contested and won by former Withington MP, John Leech. Leech's win signified the first gain for any party in Manchester other than Labour for the first time in six years.

Elections to Tameside Council were held on 4 May 2006. One third of the council was up for election, with each successful candidate to serve a four-year term of office, expiring in 2010. The Labour Party retained overall control of the council.

<span class="mw-page-title-main">2019 Manchester City Council election</span> 2019 local election in England, UK

Elections to Manchester City Council were held on 2 May 2019, as part of the 2019 United Kingdom local elections. In 2018 Labour retained its majority of the council with 94 seats to the Liberal Democrats making up the opposition of 2, led by former MP John Leech.

References

  1. Manchester Evening News, 8 May 1998.
  2. "Manchester 1998 council election results". manchester.gov.uk. Archived from the original on 14 June 1998. Retrieved 11 January 2012.
  3. "By-election past results". manchester.gov.uk. Archived from the original on 27 April 2003. Retrieved 19 January 2012.