2006 Manchester City Council election

Last updated

2006 Manchester City Council election
Flag of England.svg
  2004 4 May 2006 2007  

32 of the 96 seats on Manchester City Council
49 seats needed for a majority
 First partySecond party
 
Party Labour Liberal Democrats
Seats won239
Seats after6134
Seat changeIncrease2.svg 4Decrease2.svg 4
Popular vote41,03928,929
Percentage44.8%31.6%
SwingIncrease2.svg 4.9%Decrease2.svg 2.3%

Manchester UK local election 2006 map.svg
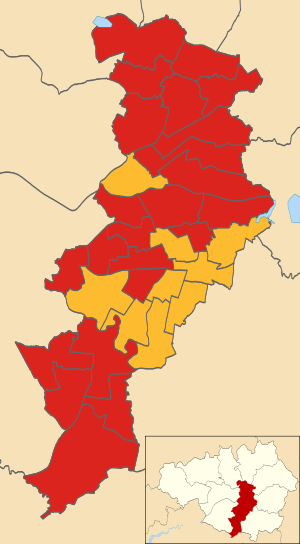
Map of the results of the 2006 Manchester council election. Labour in red and the Liberal Democrats in yellow.

Council control before election


Labour

Council control after election


Labour

Elections to Manchester City Council were held on 4 May 2006. One third of the council was up for election, with each successful candidate to serve a four-year term of office, expiring in 2010. The council stayed under Labour Party control, strengthened by four gains from the Liberal Democrats. [1] [2]

Contents

Election result

Changes in vote share are compared to the 2004 election.

Manchester Council Election Result 2006 [2]
PartyThis electionFull councilThis election
SeatsNetSeats %OtherTotalTotal %VotesVotes %+/−
  Labour 23Increase2.svg471.9386163.541,03944.8Increase2.svg4.9%
  Liberal Democrats 9Decrease2.svg428.1253435.428,92931.6Decrease2.svg2.3%
  Conservative 0Steady2.svg0.0000.09,64910.5Decrease2.svg2.2%
  Green 0Steady2.svg0.0111.18,4939.3Decrease2.svg1.0%
  UKIP 0Steady2.svg0.0000.01,1281.2Increase2.svg1.0%
  Independent 0Steady2.svg0.0000.08330.9Increase2.svg0.4%
  BNP 0Steady2.svg0.0000.06410.7Increase2.svg0.3%
  Respect 0Steady2.svg0.0000.06150.7Decrease2.svg0.3%
  Socialist Alternative 0Steady2.svg0.0000.02140.2n/a
  Independent Liberal 0Steady2.svg0.0000.0110.0n/a

Ward results

Below is a list of the 32 individual wards with the candidates standing in those wards and the number of votes the candidates acquired. Incumbent councillors seeking re-election were elected in 2004 and are marked with an asterisk.

Ancoats and Clayton

Ancoats and Clayton [1] [2]
PartyCandidateVotes%±%
Labour Jim Battle* 1,463 48.3 +2.2
Liberal Democrats Daniel James Valentine1,23540.7-0.2
Conservative Christine Joan Birchenough1364.5-0.6
Green Richard Francis Keatley1264.2-0.5
Independent John Hulse712.3-1.2
Majority2287.6+2.0
Turnout 3,03132.9-5.1
Labour hold Swing +1.2

Ardwick

Ardwick [1] [2]
PartyCandidateVotes%±%
Labour Mavis Smitheman* 1,248 61.4 +15.7
Liberal Democrats Mohammad Alam Panwar40519.9-7.5
Green Christopher David Charlton21610.6-2.4
Conservative Tadeusz Sochacki1638.0+0.9
Majority84341.5+23.2
Turnout 2,03221.7-2.7
Labour hold Swing +11.6

Baguley

Baguley [1] [2]
PartyCandidateVotes%±%
Labour Co-op Eddie McCulley* 1,205 49.0 -4.8
Conservative Joyce Kaye49820.2-0.7
Liberal Democrats Leslie James Ardron32313.1-0.7
Green Lynne Richmond2208.9-2.5
Socialist Alternative Lynn Worthington2148.7+8.7
Majority70728.7-4.1
Turnout 2,46023.9-5.5
Labour hold Swing -2.0

Bradford

Bradford [1] [2]
PartyCandidateVotes%±%
Labour John Longsden* 1,525 69.8 +7.7
Liberal Democrats Rob Brettle31614.5+0.3
Conservative Karen Abbad1888.6-6.5
Green Christopher Waldon1567.1-1.6
Majority1,20955.3+14.2
Turnout 2,18525.3-4.5
Labour hold Swing +3.7

Brooklands

Brooklands [1] [2]
PartyCandidateVotes%±%
Labour Co-op Sue Murphy* 1,378 42.1 -2.7
Conservative Ralph John Ellerton95329.2-5.1
Liberal Democrats John Paul Ankers78724.1+10.7
Green Tamisin MacCarthy-Morrogh1494.6-2.8
Majority42513.0+2.4
Turnout 3,26733.4-1.4
Labour hold Swing +1.2

Burnage

Burnage [1] [2]
PartyCandidateVotes%±%
Liberal Democrats Rodney Alan Isherwood* 1,460 47.5 -10.4
Labour Frank Oliver Duffy1,16938.0+12.7
Conservative Dorothy Helen Keller2528.2-0.5
Green Elindsay James1494.8-3.2
Majority2919.5-23.1
Turnout 3,07329.8-10.3
Liberal Democrats hold Swing -11.5

Charlestown

Charlestown [1] [2]
PartyCandidateVotes%±%
Labour Eric Hobin* 1,435 54.3 -4.8
Conservative Vivienne Inez Clarke38814.7-1.5
Liberal Democrats Ann Rodgers34813.2-11.5
UKIP Catherine Andrea Ritchie31211.8+11.8
Green Helen Sarah Dolan1596.0+6.0
Majority1,04739.6+5.2
Turnout 2,64229.2-5.2
Labour hold Swing -1.6

Cheetham

Cheetham
PartyCandidateVotes%±%
Labour Naeem Ul Hassam* 1,707 45.6 +0.8
Liberal Democrats Qassim Afzal1,60843.0+5.9
Green Jacqueline Smith2356.3+6.3
Conservative Kim Elvin Glasspole1915.1+2.4
Majority992.6-5.1
Turnout 3,74136.2-11.0
Labour hold Swing -2.5

Chorlton

Chorlton [1] [2]
PartyCandidateVotes%±%
Labour Co-op Val Stevens* 1,828 42.0 +9.0
Liberal Democrats Charles Leslie Glover1,71339.4+6.7
Green Brian Arthur Candeland60914.0-1.4
Conservative Amar Rouf Ahmed1984.6-4.0
Majority1152.6+2.3
Turnout 4,34843.0-3.9
Labour hold Swing +1.1

Chorlton Park

Chorlton Park [1] [2]
PartyCandidateVotes%±%
Liberal Democrats Norman Lewis* 1,724 54.7 +0.7
Labour Yogesh Virmani79725.3+6.4
Green Kathryn Mary Brownbridge39912.7-1.1
Conservative Rodney Keller2297.3+0.0
Majority92729.4+5.6
Turnout 3,14932.1-10.9
Liberal Democrats hold Swing -2.8

City Centre

City Centre [1] [2]
PartyCandidateVotes%±%
Liberal Democrats Elaine Boyes* 531 38.0 +0.5
Labour Co-op Chris Paul37426.8-0.8
Conservative James Jacob Gilchrist Berry 31122.3+7.1
Green Birgit Vollm18113.0-2.0
Majority15711.2+1.3
Turnout 1,39716.4-2.4
Liberal Democrats hold Swing +0.6

Crumpsall

Crumpsall [1] [2]
PartyCandidateVotes%±%
Labour Jon-Leigh Pritchard* 1,667 49.6 +4.6
Liberal Democrats Sham Raja73821.9+2.2
Conservative Adrian Paul Glasspole47614.2-4.3
UKIP Ernest Robert Willescroft2597.7+7.7
Green Justine Michelle Hall2236.6-10.1
Majority92927.6+2.4
Turnout 3,36333.8-8.0
Labour hold Swing +1.2

Didsbury East

Didsbury East [1] [2]
PartyCandidateVotes%±%
Liberal Democrats Anthony Thomas Parkinson* 1,809 45.3 -2.4
Labour Geoffrey Bridson1,36934.3+2.9
Green Richard Edgar Gee45911.5+3.4
Conservative Peter Malcolm Schofield3599.0-3.7
Majority44011.0-5.3
Turnout 3,99639.1-9.3
Liberal Democrats hold Swing -2.6

Didsbury West

Didsbury West [1] [2]
PartyCandidateVotes%±%
Liberal Democrats Richard Mark Clayton 1,189 42.9 +0.1
Labour David Clive Ellison69225.0+4.6
Conservative Peter Girvan Hilton48517.5+2.3
Green George Stanislaw Czernuszka32911.9-4.2
UKIP Robert Gutfreund-Walmsley762.7-2.9
Majority49717.9-4.5
Turnout 2,77128.0-8.4
Liberal Democrats hold Swing -2.2

Fallowfield

Fallowfield [1] [2]
PartyCandidateVotes%±%
Labour Mike Amesbury 1,357 46.4 +4.1
Liberal Democrats John-Paul Wilkins*1,08637.2+0.6
Conservative Cedric Beniston1715.9-3.8
Green Susan Somerville1685.7-5.7
BNP Joseph Gerard Marjella Finnon1404.8+4.8
Majority2719.3+3.5
Turnout 2,92228.1-2.4
Labour gain from Liberal Democrats Swing +1.7

Gorton North

Gorton North [1] [2]
PartyCandidateVotes%±%
Labour Nilofar Siddiqi 1,244 39.7 +0.1
Liberal Democrats Bernadette Newing*1,13236.1-11.0
Independent Allan James Grafton46514.8+14.8
Conservative Patricia Ann Ainscough1444.6-3.5
Green Rachel Michelle Wilson782.5-2.8
Independent David Colin Jones722.3+2.3
Majority1123.6-3.9
Turnout 3,13531.4-1.9
Labour gain from Liberal Democrats Swing +5.5

Gorton South

Gorton South [1] [2]
PartyCandidateVotes%±%
Liberal Democrats John Richard Bridges* 1,375 47.8 -7.6
Labour Julie Reid1,03135.8+8.3
Green David William Mottram2468.5-1.0
Conservative Raymond Kenyon2267.9+0.4
Majority34412.0-15.9
Turnout 2,87826.9-4.6
Liberal Democrats hold Swing -7.9

Harpurhey

Harpurhey [1] [2]
PartyCandidateVotes%±%
Labour Paul Fairweather* 1,420 55.3 -0.3
Liberal Democrats Gareth David Aubrey32012.5-11.5
UKIP Roger Porter Bullock31212.1+12.1
Conservative Ian Beswick30211.8-2.4
Green Darren Jason Flynn2158.4+8.4
Majority1,10042.8+11.2
Turnout 2,56922.1-4.8
Labour hold Swing +5.6

Higher Blackley

Higher Blackley [1] [2]
PartyCandidateVotes%±%
Labour Anna Margaret Trotman* 1,477 57.0 -3.4
Conservative Terence Shannon50619.5-0.3
Liberal Democrats Barbara Argyropoulos38314.8-4.9
Green Michael Robert Shaw2268.7+8.7
Majority97137.5-3.1
Turnout 2,59226.5-5.8
Labour hold Swing -1.5

Hulme

Hulme [1] [2]
PartyCandidateVotes%±%
Labour Nigel Joseph Murphy 816 37.9 +1.8
Liberal Democrats Oliver West57626.7+7.6
Green Steven Jonathan Durrant53925.0-12.4
Conservative Paul Anthony Kierman964.6-2.7
Independent Christine Anne Boscott-Shermerdine532.5+2.5
Independent Captain Cae Os432.0+2.0
UKIP Peter David Reeve200.9+0.9
Independent Liberal Charles Anthony Lyn-Lloyd110.5+0.5
Majority24011.1+9.8
Turnout 2,15424.1-1.5
Labour hold Swing -2.9

Levenshulme

Levenshulme [1] [2]
PartyCandidateVotes%±%
Liberal Democrats Alexander Cowan* 1,402 50.1 -3.1
Labour Dermot Sean Zafar77927.9+3.8
Green Peter Norman Thompson39914.3-2.1
Conservative William Moore2177.8+1.5
Majority62322.3-6.9
Turnout 2,79728.4-4.1
Liberal Democrats hold Swing -3.4

Longsight

Longsight [1] [2]
PartyCandidateVotes%±%
Labour Maryam Fazeela Khan 1,687 54.6 +24.4
Liberal Democrats Mohammed Sajjad*77425.1-19.2
Green Hassan Ukairo44414.4-1.7
Conservative Zahir Ali1825.9-3.5
Majority91330.0+15.4
Turnout 3,08732.3-6.0
Labour gain from Liberal Democrats Swing +21.8

Miles Platting and Newton Heath

Miles Platting and Newton Heath [1] [2]
PartyCandidateVotes%±%
Labour John Flanagan* 1,286 43.5 +6.3
Liberal Democrats Richard John Wilson79126.8+9.5
BNP Derek George Adams50116.9+3.4
UKIP Lisa Ann Duffy1495.0+5.0
Conservative Brian George Birchenough1344.5-3.0
Green Anthony James Quinn963.2-1.9
Majority49516.7-1.1
Turnout 2,95729.1-2.9
Labour hold Swing -1.6

Moss Side

Moss Side [1] [2]
PartyCandidateVotes%±%
Labour Roy Blake Walters* 1,734 63.7 +3.6
Liberal Democrats Mohammad Hamza Butt50918.7+1.1
Green Robin Goater2358.6+0.2
Independent Reverend Juggla1294.7-2.8
Conservative Raymond Talbot Wattenbach1164.3-2.1
Majority1,22545.0+2.4
Turnout 2,72327.8-0.0
Labour hold Swing +1.2

Moston

Moston [1] [2]
PartyCandidateVotes%±%
Labour Bill Risby* 1,774 53.1 -5.2
Conservative Anthony Gerard Pinder75522.6-2.7
Liberal Democrats Timothy John Hartley50615.2+3.1
Green Rose Ann Cameron3039.0+9.0
Majority1,01930.5-2.6
Turnout 3,33831.2-6.1
Labour hold Swing -1.2

Northenden

Northenden [1] [2]
PartyCandidateVotes%±%
Labour Richard James Cowell* 1,431 46.9 +2.2
Liberal Democrats Martin Clive Eakins1,09235.8+15.7
Conservative Nathan James Cruddas39112.8-5.2
Green Lance David Crookes1364.5-12.6
Majority33911.1-13.5
Turnout 3,05029.3-3.6
Labour hold Swing -6.7

Old Moat

Old Moat [1] [2]
PartyCandidateVotes%±%
Labour Brian Harrison* 1,567 54.4 +5.0
Liberal Democrats Tina Maache77326.9-0.4
Green Robin-Ella Davies31711.0-1.4
Conservative Daniel Rossall Valentine2217.7-3.2
Majority79427.6+5.4
Turnout 2,87829.2-3.2
Labour hold Swing +2.7

Rusholme

Rusholme [1] [2]
PartyCandidateVotes%±%
Liberal Democrats Lynne Williams* 1,157 39.9 -16.0
Labour John Byrne80427.7-0.8
Respect Nahella Ashraf61521.2+21.2
Green Penelope Irene Collins1886.5-2.9
Conservative Barbara Mary Goodall1354.7-1.4
Majority35312.2-15.1
Turnout 2,89931.5-6.5
Liberal Democrats hold Swing -7.6

Sharston

Sharston [1] [2]
PartyCandidateVotes%±%
Labour Co-op Hugh Barrett* 1,248 55.0 +4.7
Conservative Agnes Anne Carroll40217.7-1.1
Liberal Democrats William David Fisher35515.6-0.9
Green Karen Jane Duffy26411.5-2.9
Majority84637.3+5.8
Turnout 2,26921.4-5.6
Labour hold Swing +2.9

Whalley Range

Whalley Range [1] [2]
PartyCandidateVotes%±%
Labour Mary Rose Watson 1,637 46.1 +17.4
Liberal Democrats Joy Ruth Winder*1,15832.6-6.6
Green Mary Rosalind Candeland46613.1+0.6
Conservative Matthew Graham Cox2898.1-11.5
Majority47913.5+2.9
Turnout 3,55034.5-9.3
Labour gain from Liberal Democrats Swing +12.0

Withington

Withington [1] [2]
PartyCandidateVotes%±%
Liberal Democrats Simon David Wheale 1,064 47.8 -10.6
Labour Delores Elizabeth Long61327.6+9.0
Green Sarah Stuart34015.3+0.9
Conservative Andrew Christopher Perfect2079.3+0.7
Majority45120.3-19.5
Turnout 2,22422.3-8.4
Liberal Democrats hold Swing -9.8

Woodhouse Park

Woodhouse Park [1] [2]
PartyCandidateVotes%±%
Labour Edward Newman* 1,277 61.5 +1.1
Conservative Ruby Marie Raynor32815.8-0.8
Liberal Democrats Joseph Francis Podbylski29014.0-0.2
Green Peter Andrew Somerville1808.7-0.1
Majority94945.7+1.8
Turnout 2,07521.8-5.7
Labour hold Swing +0.9

By-elections between 2006 and 2007

Gorton South By-Election 19 October 2006 [3]
PartyCandidateVotes%±%
Liberal Democrats Charles Glover1,58849.3+1.5
Labour Julie Reid1,20837.5+1.7
BNP Derek Adams1855.7+5.7
Green David Mottram1514.7-3.8
Conservative Daniel Valentine902.8-5.1
Majority38011.8-0.2
Turnout 3,22229.9+3.0
Liberal Democrats hold Swing -0.1

Related Research Articles

<span class="mw-page-title-main">English Democrats</span> English political party

The English Democrats is a right-wing to far-right, English nationalist political party active in England. Being a minor party, it currently has no elected representatives at any level of UK government.
<span class="mw-page-title-main">Manchester Central (UK Parliament constituency)</span> Parliamentary constituency in the United Kingdom, 1974 onwards

Manchester Central is a parliamentary constituency in Greater Manchester created in 1974 represented in the House of Commons of the UK Parliament since 2012 by Lucy Powell of the Labour Party and Co-operative Party.
<span class="mw-page-title-main">Manchester Gorton (UK Parliament constituency)</span> Parliamentary constituency in the United Kingdom, 1885 onwards

Manchester Gorton is a constituency represented in the House of Commons of the UK Parliament by Labour's Afzal Khan, who was elected at the 2017 general election. It is the safest Labour seat in Greater Manchester by numerical majority and one of the safest in the country.

<span class="mw-page-title-main">Stockport Metropolitan Borough Council</span> Local government body in England

Stockport Metropolitan Borough Council (SMBC) is the local authority for the Metropolitan Borough of Stockport, Greater Manchester, England. The council is currently run by a Liberal Democrat minority administration. At the 2023 local elections, the Liberal Democrats gained two more seats, increasing their lead over the Labour Party to six seats, and retaining minority control. This lead is now five seats after one of the Liberal Democrats’ councillors resigned the whip, days after being re-elected. The Liberal Democrats currently have 29 seats, Labour 24, and the Heald Green Ratepayers, Greens and the Edgeley Community Association each holding 3. There is 1 independent.

<span class="mw-page-title-main">Leeds City Council</span> Local government body in England

Leeds City Council is the local authority of the City of Leeds in West Yorkshire, England. It is a metropolitan district council, one of five in West Yorkshire and one of 36 in the metropolitan counties of England, and provides the majority of local government services in Leeds. It has the second-largest population of any council in the United Kingdom with approximately 800,000 inhabitants living within its area; only Birmingham City Council has more. Since 1 April 2014, it has been a constituent council of the West Yorkshire Combined Authority.

<span class="mw-page-title-main">Bolton Metropolitan Borough Council elections</span>

Bolton Metropolitan Borough Council elections are generally held three years out of every four, with a third of the council being elected each time. Bolton Metropolitan Borough Council, generally known as Bolton Council, is the local authority for the metropolitan borough of Bolton in Greater Manchester, England. Since the last boundary changes in 2004, 60 councillors have been elected from 20 wards. New ward boundaries are being prepared to take effect from the 2023 election.

<span class="mw-page-title-main">Brooklands (Manchester ward)</span> Electoral ward in England

Brooklands is an area and electoral ward of Manchester, England. It is represented in Westminster by Mike Kane, MP for Wythenshawe and Sale East. The 2011 Census recorded a population of 14,362.

<span class="mw-page-title-main">2008 Manchester City Council election</span>

Elections to Manchester City Council took place on 1 May 2008. One third of the council was up for election - every ward of the city returned one councillor at this election out of the three councillors a ward in the city has.

<span class="mw-page-title-main">2007 Manchester City Council election</span> 2007 UK local government election

Elections to Manchester City Council took place on 3 May 2007. One third of the council was up for election, with each successful candidate to serve a four-year term of office, expiring in 2011. The council stayed under Labour Party control, on a reduced turnout of 28.3%.

This article lists the British National Party's election results in the UK parliamentary, Scottish parliamentary and Welsh Assembly elections, as well as in the European Parliament elections and at a local level.

<span class="mw-page-title-main">2010 Manchester City Council election</span>

Elections to Manchester City Council were held on 6 May 2010, on the same day as the 2010 UK General Election. One-third of the council was up for election, with each successful candidate to serve a four-year term of office, expiring in 2014. Since the election there had been a further defection from the Liberal Democrats to Labour. Labour held overall control of the council, on a high turnout - owing to the general election on the same day - of 50.9%.

In United Kingdom election law, an election court is a special court convened to hear a petition against the result of a local government or parliamentary election. The court is created to hear the individual case, and ceases to exist when it has made its decision.

<span class="mw-page-title-main">2010 Redbridge London Borough Council election</span> 2010 local election in England, UK

Elections for Redbridge London Borough Council were held on 6 May 2010. The 2010 General Election and other local elections took place on the same day.

<span class="mw-page-title-main">2004 Manchester City Council election</span> 2004 UK local government election

Elections to Manchester City Council were held on 10 June 2004.

<span class="mw-page-title-main">2011 Manchester City Council election</span> 2011 UK local government election

Elections to Manchester City Council were held on 5 May 2011, along with the 2011 United Kingdom Alternative Vote referendum. One third of the council was up for election, with each successful candidate serving a four-year term of office, expiring in 2015. The Labour Party retained overall control of the council, managing to win every seat contested. Overall turnout was a comparatively high 31.6%, although much down on the previous year's general election turnout of 50.9%.

<span class="mw-page-title-main">2014 Manchester City Council election</span> 2014 local election in England, UK

The 2014 elections to Manchester City Council were held on 22 May 2014, on the same day as the 2014 United Kingdom local elections and the United Kingdom component of the 2014 European Parliament election. One-third of the council were up for election, with each successful candidate to serve a four-year term of office, expiring in 2018.

<span class="mw-page-title-main">City Centre (ward)</span> Electoral ward in England

City Centre ward was a ward of the local authority Manchester City Council from 2004 to 2018. The population of the city centre grew significantly in the 21st century. Therefore as recommended by the Local Government Boundary Commission for England (LGBCE), the ward was replaced in May 2018 with two new electoral wards, Deansgate and Piccadilly.

<span class="mw-page-title-main">2019 Manchester City Council election</span> 2019 local election in England, UK

Elections to Manchester City Council were held on 2 May 2019, as part of the 2019 United Kingdom local elections. In 2018 Labour retained its majority of the council with 94 seats to the Liberal Democrats making up the opposition of 2, led by former MP John Leech.

<span class="mw-page-title-main">2022 Birmingham City Council election</span> 2022 local election in Birmingham

The 2022 Birmingham City Council election took place on 5 May 2022, with all 101 council seats up for election across 37 single-member and 32 two-member wards. The election was held alongside other local elections across Great Britain and town council elections in Sutton Coldfield.

<span class="mw-page-title-main">2022 St Helens Metropolitan Borough Council election</span> 2022 local election in St Helens

The 2022 St Helens Metropolitan Borough Council election took place on 5 May 2022. Due to boundary changes, all 48 councillors were elected at the same time, with the council moving to a system of all-out elections every four years. The election took place alongside other local elections across the United Kingdom.
References

  1. 1 2 3 4 5 6 7 8 9 10 11 12 13 14 15 16 17 18 19 20 21 22 23 24 25 26 27 28 29 30 31 32 "Local Election Results 2006". manchester.gov.uk. Archived from the original on 11 May 2010. Retrieved 17 January 2012.
  2. 1 2 3 4 5 6 7 8 9 10 11 12 13 14 15 16 17 18 19 20 21 22 23 24 25 26 27 28 29 30 31 32 33 "Local Elections Archive: 2006 - Manchester". andrewteale.me.uk. Retrieved 17 January 2012.
  3. "By-election results: 2006–2011". manchester.gov.uk. Archived from the original on 11 May 2010. Retrieved 19 January 2012.