2006 Sutton London Borough Council election

Last updated

2006 Sutton London Borough Council election
  2002 4 May 2006 2010  

All 54 seats to Sutton London Borough Council
28 seats needed for a majority
 First partySecond party
 
Party Liberal Democrats Conservative
Seats won3222
Seat changeDecrease2.svg 11Increase2.svg 14
Popular vote25,91124,317
Percentage44.1%41.4%
SwingDecrease2.svg 4.9%Increase2.svg 6.2%

Sutton London UK local election 2006 map.svg
Map of the results of the 2006 Sutton council election. Conservatives in blue and the Liberal Democrats in yellow.

Council control before election

Liberal Democrats

Council control after election

Liberal Democrats

The 2006 Sutton Council election took place on 4 May 2006 to elect members of Sutton London Borough Council in London, England. The whole council was up for election and the Liberal Democrats maintained control of the council, despite losing 11 seats to the Conservatives. [1] [2]

Contents

Election result

Sutton Local Election Result 2006
PartySeatsGainsLossesNet gain/lossSeats %Votes %Votes+/−
  Liberal Democrats 32314Decrease2.svg 1159.344.125,911Decrease2.svg 4.9
  Conservative 22140Increase2.svg 1440.741.424,317Increase2.svg 6.2
  Labour 003Decrease2.svg 30.08.34,888Decrease2.svg 4.0
  Green 000Steady2.svg0.02.71,556Decrease2.svg 0.6
  Independent 000Steady2.svg0.01.5888New
  BNP 000Steady2.svg0.01.0588New
  UKIP 000Steady2.svg0.00.8449New
  CPA 000Steady2.svg0.00.2116New

Ward results

Beddington North

Beddington North (3)
PartyCandidateVotes%±%
Liberal Democrats John Keys 1,377 44.3
Liberal Democrats John Leach 1,350
Liberal Democrats Jenny Slark 1,318
Conservative Howard Bowles1,17437.8
Conservative Malcolm Brown1,153
Conservative Paul Skeet1,048
Labour Nicholas Carter2889.3
UKIP Leslie Price2688.6
Labour Susan Theobald256
Labour John Weir130
Turnout 40.8
Liberal Democrats hold Swing

Beddington South

Beddington South (3)
PartyCandidateVotes%±%
Conservative Peter Wallis 1,492 49.3
Conservative Marion Williams 1,437
Conservative Terence Faulds 1,401
Liberal Democrats Sally Brearley1,29242.7
Liberal Democrats Peter Baxter-Derrington1,268
Liberal Democrats Muhammad Sadiq1,213
Labour Beresford Caramba-Coker2407.9
Labour Richard Aitken238
Labour Renuka Marley200
Turnout 45.0
Conservative gain from Liberal Democrats Swing

Belmont

Belmont (3)
PartyCandidateVotes%±%
Conservative David Pickles 2,115 56.5
Conservative Peter Geiringer 1,987
Conservative Pamela Picknett 1,933
Liberal Democrats Russell Neale1,09529.3
Liberal Democrats Thomas Osborne959
Liberal Democrats Eric Pridham896
Green Brian Dougherty3228.6
Labour Gale Blears2115.6
Labour Geraldine Kerr184
Labour John Brown174
Turnout 48.1
Conservative hold Swing

Carshalton Central

Carshalton Central (3)
PartyCandidateVotes%±%
Liberal Democrats Hamish Pollock 1,578 42.2
Conservative Paul Scully 1,473 39.4
Conservative Eric Howell 1,387
Conservative Peter Mead1,375
Liberal Democrats Alan Salter1,365
Liberal Democrats Jill Whitehead1,336
Green Robert Steel3569.5
Green Miranda Suheimat238
Labour David Davis2165.8
Labour David Towler207
Labour Anthony Thorpe203
CPA Ashley Dickenson1163.1
Turnout 47.6
Liberal Democrats hold Swing
Conservative gain from Liberal Democrats Swing

Carshalton South and Clockhouse

Carshalton South and Clockhouse (3)
PartyCandidateVotes%±%
Conservative Timothy Crowley 1,822 49.0
Conservative Moira Butt 1,753
Conservative John Kennedy 1,743
Liberal Democrats Paul Wingrove1,67745.1
Liberal Democrats Derek Yeo1,653
Liberal Democrats Lal Hussain1,599
Labour Marilynne Burbage2226.0
Labour Claire Shearer222
Labour Peter Turner194
Turnout 52.6
Conservative gain from Liberal Democrats Swing

Cheam

Cheam (3)
PartyCandidateVotes%±%
Conservative Eleanor Pinfold 2,251 57.8
Conservative Graham Whitham 2,170
Conservative Misdaq Zaidi 2,072
Liberal Democrats Robert Cummins1,53539.4
Liberal Democrats Alexandra Ankrah1,468
Liberal Democrats Nicholas Kounoupias1,389
Labour David Jarman1072.7
Labour Lyndon Edwards99
Labour Laura Herridge94
Turnout 51.5
Conservative hold Swing

Nonsuch

Nonsuch (3)
PartyCandidateVotes%±%
Conservative Christopher Dunlop 1,816 47.5
Liberal Democrats Kirsty Jerome 1,779 46.5
Liberal Democrats Roger Roberts 1,760
Conservative David Senior1,753
Conservative Adrian Noble1,750
Liberal Democrats Wendy Mathys1,702
Labour Kathie Clark2275.9
Labour Cyril Salmon177
Labour Marcus Papadopoulos170
Turnout 50.9
Conservative gain from Liberal Democrats Swing
Liberal Democrats hold Swing

St Helier

St Helier (3)
PartyCandidateVotes%±%
Liberal Democrats Sheila Andrews 1,257 43.1
Liberal Democrats David Callaghan 1,161
Liberal Democrats David Theobald 1,147
Labour Charles Mansell67423.1
Labour Andrew Theobald674
Labour Joseph Magee662
BNP Charlotte Lewis58820.2
Conservative Gillian Walker39613.6
Conservative Eric Pillinger365
Conservative Thomas Wortley362
Turnout 35.3
Liberal Democrats gain from Labour Swing

Stonecot

Stonecot (3)
PartyCandidateVotes%±%
Liberal Democrats Anthony Young 1,590 49.1
Liberal Democrats Abigail Lock 1,446
Liberal Democrats Brendan Hudson 1,425
Conservative Raymond Hilldrup1,41343.6
Conservative Gary James1,370
Conservative Sharon James1,350
Labour Richard Dawson2377.3
Labour Gwendoline Fuller230
Labour William Lang199
Turnout 43.0
Liberal Democrats hold Swing

Sutton Central

Sutton Central (3)
PartyCandidateVotes%±%
Liberal Democrats John Brennan 1,371 54.7
Liberal Democrats Janet Lowne 1,340
Liberal Democrats Graham Tope 1,340
Conservative Elizabeth Fison68127.2
Conservative Margaret Greenwood668
Conservative Christine Hicks648
Labour Kathleen Allen45418.1
Labour Maria Ponto422
Labour Enid Bakewell397
Turnout 36.5
Liberal Democrats hold Swing

Sutton North

Sutton North (3)
PartyCandidateVotes%±%
Liberal Democrats Ruth Dombey 1,436 47.5
Liberal Democrats Lynette Gleeson 1,387
Conservative Clifford Carter 1,361 45.0
Liberal Democrats Marlene Heron1,347
Conservative Darren Marsh1,299
Conservative David Park1,260
Labour Michael Cue2297.6
Labour Helen Martin227
Labour Stephen Morton212
Turnout 42.4
Liberal Democrats hold Swing
Conservative gain from Liberal Democrats Swing

Sutton South

Sutton South (3)
PartyCandidateVotes%±%
Conservative Tony Shields 1,502 44.3
Conservative Paul Newman 1,413
Conservative Barry Russell 1,393
Liberal Democrats Richard Clifton1,33639.4
Liberal Democrats Claire Stears1,227
Liberal Democrats Mohamed Ali1,205
Independent Peter Ticher2326.8
UKIP Ronald Newman1815.3
Labour Helen Jones1374.0
Labour Paul Harrison124
Labour Ronald Phillips103
Turnout 46.6
Conservative hold Swing
Conservative gain from Liberal Democrats Swing

Sutton West

Sutton West (3)
PartyCandidateVotes%±%
Liberal Democrats Ian Chapman 1,552 45.5
Liberal Democrats Myfanwy Wallace 1,522
Liberal Democrats Simon Wales 1,466
Conservative Richard Willis1,41541.5
Conservative Christopher Furey1,414
Conservative Jonathan Pritchard1,376
Green Peter Hickson2978.7
Labour Morgan McSweeney 1494.4
Labour Ronald Williams146
Labour Shawn Buck132
Turnout 45.1
Liberal Democrats hold Swing

Wallington North

Wallington North (3)
PartyCandidateVotes%±%
Liberal Democrats Joan Hartfield 1,541 46.3
Liberal Democrats Bruce Glithero 1,532
Liberal Democrats Margaret Ali 1,451
Conservative Desmond Bowles1,29839.0
Conservative Dee Hyatt1,262
Conservative Jane Pascoe1,194
Labour Kathleen Reeds2447.3
Green Penelope Mouncey2427.3
Labour Gregory Charles229
Labour Cecil Tate229
Green Amy Pattenden221
Green Phillip Mouncey217
Turnout 44.5
Liberal Democrats hold Swing

Wallington South

Wallington South (3)
PartyCandidateVotes%±%
Liberal Democrats Richard Bailey 1,575 45.8
Liberal Democrats Colin Hall 1,550
Liberal Democrats Jayne McCoy 1,490
Conservative Owen Hanson1,30537.9
Conservative Peter Wooten1,247
Conservative Hilary Wortley1,224
Green Malin Andrews3399.9
Labour Clive Poge2216.4
Labour Mary Ryan215
Green Karin Jashapara210
Labour Joyce Smith189
Turnout 45.3
Liberal Democrats hold Swing

Wandle Valley

Wandle Valley (3)
PartyCandidateVotes%±%
Liberal Democrats Margaret Court 1,317 55.9
Liberal Democrats John Drage 1,206
Liberal Democrats Patrick Kane 1,172
Conservative Patrick Jaques53822.8
Conservative Brian Moss525
Conservative Charles Manton503
Labour Richard Collier50121.3
Labour Edward McCauley453
Labour Patricia Simons416
Turnout 32.7
Liberal Democrats hold Swing

Worcester Park

Worcester Park (3)
PartyCandidateVotes%±%
Conservative Richard Butt 1,398 41.0
Conservative Stuart Gordon-Bullock 1,311
Conservative Helen Senior 1,306
Liberal Democrats Yvonne Cape1,16734.2
Liberal Democrats Leslie Coman1,155
Liberal Democrats Peter Overy1,136
Independent Raymond Bunce65619.2
Independent Julian Freeman567
Independent Nicola Freeman544
Labour Hilary Hosking1885.5
Labour Graham Hutton187
Labour John Evers176
Turnout 44.8
Conservative gain from Liberal Democrats Swing

The Wrythe

The Wrythe (3)
PartyCandidateVotes%±%
Liberal Democrats Susan Stears 1,436 54.3
Liberal Democrats Colin Stears 1,405
Liberal Democrats Roger Thistle 1,370
Conservative Derek Lockhart86732.8
Conservative Christopher Wortley834
Conservative Stephen Odunton791
Labour Margaret Collier34313.0
Labour Catherine Magee337
Labour Margaret Hughes335
Turnout 36.6
Liberal Democrats hold Swing

Related Research Articles

<span class="mw-page-title-main">Lambeth London Borough Council elections</span>

Lambeth London Borough Council is elected every four years.

Barnet London Borough Council in London, England is elected every four years. Since the last boundary changes in 2002, 63 councillors have been elected from 21 wards.

<span class="mw-page-title-main">Croydon London Borough Council elections</span>

Elections for the Croydon London Borough Council are held every four years to elect 70 councillors. The last ward boundary changes came into force at the 2018 local elections.

Camden London Borough Council in London, England is elected every four years. Since the last boundary changes in 2022, 55 councillors have been elected from 20 wards.

Dartford Borough Council is the local authority for the Borough of Dartford in Kent, England. The council is elected every four years.

<span class="mw-page-title-main">2006 London local elections</span>

Local government elections took place in London, and some other parts of the United Kingdom on Thursday 4 May 2006. Polling stations were open between 7am and 10pm.

<span class="mw-page-title-main">Redbridge London Borough Council elections</span>

Redbridge London Borough Council in London, England is elected every four years.

<span class="mw-page-title-main">Lewisham London Borough Council elections</span>

Lewisham London Borough Council is the local authority for the London Borough of Lewisham, in London, United Kingdom. Elections are held every four years using a plurality bloc vote electoral system for the councillors and the supplementary vote electoral system for the elected mayor.

<span class="mw-page-title-main">Sutton London Borough Council elections</span>

Sutton London Borough Council in London, England is elected every four years.

<span class="mw-page-title-main">Hillingdon London Borough Council elections</span> Class of UK elections

The members of the Hillingdon London Borough Council in London, England are elected every four years. Since the 2022 boundary changes, the council is composed of 53 councillors.

<span class="mw-page-title-main">Merton London Borough Council elections</span> Political party in the United Kingdom

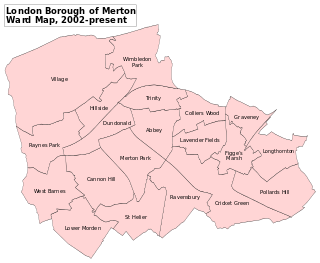
Merton London Borough Council in London, England is elected every four years; it has administrative control over the London Borough of Merton.

Elections for the London Borough of Merton were held on 7 May 1998 to elect members of Merton London Borough Council in London, England. This was on the same day as other local elections in England and a referendum on the Greater London Authority; in the latter, Merton voted in favour of creating the Greater London Authority by 72.2% on a 37.6% turnout.

<span class="mw-page-title-main">Kensington and Chelsea London Borough Council elections</span> Local elections in London, England

Kensington and Chelsea London Borough Council in London, England, is elected every four years. Since the last boundary changes in 2014, 50 councillors have been elected from 18 wards.

<span class="mw-page-title-main">Sutton London Borough Council</span>

Sutton London Borough Council is the local authority for the London Borough of Sutton in Greater London, England. It is a London borough council, one of 32 in the United Kingdom capital of London. Sutton is divided into 18 wards, each electing three councillors. Following the May 2018 council election, Sutton London Borough Council comprises 33 Liberal Democrat councillors, 18 Conservative Party councillors, and 3 Independent councillors, a decrease of the Liberal Democrat majority. The council was created by the London Government Act 1963 and replaced three local authorities: Beddington and Wallington Borough Council, Sutton and Cheam Borough Council and Carshalton Urban District Council.

<span class="mw-page-title-main">Greenwich London Borough Council elections</span>

Greenwich London Borough Council is the local authority for the Royal Borough of Greenwich in London, England. The council is elected every four years. Since the last boundary changes in 2022, 55 councillors have been elected from 23 wards.

Wandsworth London Borough Council, England, is elected every four years. From 2002 to 2018, 60 councillors were elected from 20 wards. Following ward boundary changes, in 2022 58 councillors were elected in 22 wards returning either 2 or 3 councillors each.

<span class="mw-page-title-main">Paul Scully</span> British politician (born 1968)

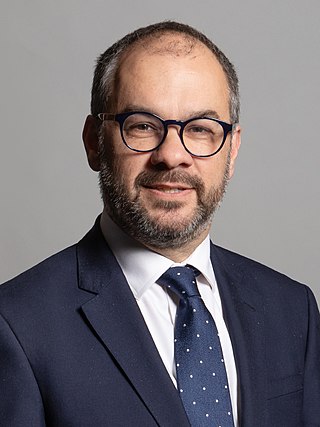
Paul Stuart Scully is a British politician who served as Minister for London from February 2020 and Parliamentary Under-Secretary of State for Tech and the Digital Economy from October 2022. He was sacked from both roles in November 2023. A member of the Conservative Party, he has served as the Member of Parliament (MP) for Sutton and Cheam since 2015.

<span class="mw-page-title-main">2018 Sutton London Borough Council election</span>

The 2018 Sutton Council election took place on 3 May 2018 to elect members of Sutton Council in London. This was on the same day as other local elections.

<span class="mw-page-title-main">Elliot Colburn</span> British Conservative politician

Elliot Haydn George Colburn is a British Conservative Party politician. He has been the Member of Parliament (MP) for Carshalton and Wallington since the 2019 general election. Colburn also served as councillor for the Cheam ward on Sutton Council from 2018 to 2022.

The 2022 Sutton London Borough Council election took place on 5 May 2022. All 55 members of Sutton London Borough Council were elected. The elections took place alongside local elections in the other London boroughs and elections to local authorities across the United Kingdom.

References

  1. "Local Election Results 2006 - Sutton". Local Elections Archive Project. Retrieved 7 July 2022.
  2. "London Borough of Sutton Election Results 1964-2010" (PDF). Elections Centre. Retrieved 7 July 2022.