| |||||||||||||||||||||||||||||||||||||
All 50 seats to Hammersmith and Fulham London Borough Council 26 seats needed for a majority | |||||||||||||||||||||||||||||||||||||
---|---|---|---|---|---|---|---|---|---|---|---|---|---|---|---|---|---|---|---|---|---|---|---|---|---|---|---|---|---|---|---|---|---|---|---|---|---|
Turnout | 46.3% (5.9%) | ||||||||||||||||||||||||||||||||||||
| |||||||||||||||||||||||||||||||||||||
Map of the results of the 1994 Hammersmith and Fulham council election. Conservatives in blue and Labour in red. | |||||||||||||||||||||||||||||||||||||
|
The 1994 Hammersmith and Fulham Borough Council election took place on 5 May 1994 to elect members of Hammersmith and Fulham London Borough Council in London, England. The whole council was up for election and the Labour Party regained overall control of the council, which it had lost during the previous council term. [2]
The Labour Party had won overall control of the council at the previous election in 1990, with 28 out of the 50 seats. However, by the time of the 1994 election, the defection of two Labour councillors from the party (while remaining councillors) and the resignation of three other Labour councillors from their seats (which remained vacant on the eve of polling day) meant that by the end of the previous council's term, Labour held just 23 of the 47 occupied seats, with the Conservatives on 22 and 2 independents; the council was therefore under no overall control. [2]
The Labour Party won 33 seats - a gain of five seats from the 1990 result, and restored their control of the council.
The Conservative Party won 15 seats - a loss of 7 seats from their previous result.
The Liberal Democrats won a single seat in the Eel Brook ward on election night with Alexandra Sugden - the other seat going to Labour's Bill Dann by a single vote over Simon Thompson for the Lib Dems. But a subsequent case in the High Court concerning the validity of an individual ballot resulted in Mr Thompson gaining a vote and becoming tied with Mr Dann for the second seat. The drawing of lots was required to separate the tied candidates, in which Simon Thompson was the lucky winner. This meant the Lib Dems gained two seats from the previous election. [3] [4]
Party | Candidate | Votes | % | ±% | |
---|---|---|---|---|---|
Labour | Jacqueline A. Abbott | 1,203 | |||
Labour | Jane Hackworth-Young | 1,182 | |||
Conservative | Joseph A. Brown | 486 | |||
Conservative | Nigel P.G. Salisbury | 440 | |||
Liberal Democrats | George M. Collie | 248 | |||
Green | Cherry A. Puddicombe | 125 | |||
Green | Roger S. Crosskey | 96 | |||
Turnout | 45.7% | ||||
Labour hold | Swing | ||||
Party | Candidate | Votes | % | ±% | |
---|---|---|---|---|---|
Labour | Keith A. Mallinson | 793 | |||
Conservative | Sonya Hilton | 728 | |||
Conservative | Julian L. Muller | 692 | |||
Labour | Paul S. Philippou | 689 | |||
Liberal Democrats | Peter W Stigant | 234 | |||
Turnout | 41.2% | ||||
Labour gain from Conservative | Swing | ||||
Conservative hold | Swing | ||||
Party | Candidate | Votes | % | ±% | |
---|---|---|---|---|---|
Labour | Kenneth M. Cartwright | 1.010 | |||
Labour | Louanne Tranchell | 883 | |||
Conservative | Paul J. Jones | 488 | |||
Conservative | David H. Rutley | 471 | |||
Liberal Democrats | Gavin B. Collins | 273 | |||
Liberal Democrats | Kevin J.T. Pakenham | 232 | |||
Turnout | 48.5% | ||||
Labour hold | Swing | ||||
Party | Candidate | Votes | % | ±% | |
---|---|---|---|---|---|
Labour | Gerald A. Johnson | 943 | |||
Conservative | John A Hennessy | 884 | |||
Labour | Paul C. O'Connor | 883 | |||
Conservative | Roderick Corrie | 846 | |||
Liberal Democrats | Patrick M. Curry | 344 | |||
Liberal Democrats | Ronald C.G. Wiffen | 307 | |||
Turnout | 47.0% | ||||
Labour gain from Conservative | Swing | ||||
Conservative hold | Swing | ||||
Party | Candidate | Votes | % | ±% | |
---|---|---|---|---|---|
Conservative | Adronie E. Alford | 986 | |||
Conservative | Antony Lillis | 951 | |||
Labour | Frederick C. Inniss | 685 | |||
Labour | Neil R. Mills | 640 | |||
Liberal Democrats | Douglas-Mann Helen A | 236 | |||
Liberal Democrats | Suzanna C. Harris | 206 | |||
Turnout | 45.5% | ||||
Conservative hold | Swing | ||||
Party | Candidate | Votes | % | ±% | |
---|---|---|---|---|---|
Labour | Lester J. Holloway | 1,507 | |||
Labour | Wesley S. Harcourt | 1,439 | |||
Labour | Reginald Mclaughlin | 1,382 | |||
Conservative | Jeremy R.S. Hunt | 266 | |||
Conservative | Andrew J. Macdonald | 255 | |||
Liberal Democrats | Sean M.G. Williams | 224 | |||
Conservative | Julie C. Perrin | 223 | |||
Liberal Democrats | William L. Slingsby | 168 | |||
Turnout | 40.5% | ||||
Labour hold | Swing | ||||
Party | Candidate | Votes | % | ±% | |
---|---|---|---|---|---|
Labour | Christine Graham | 1,831 | |||
Labour | Benjamin J. Simms | 1,750 | |||
Labour | Josephine A. Wicks | 1,670 | |||
Conservative | Christopher M. Frazer | 417 | |||
Liberal Democrats | Ilona O.H. Lepper | 386 | |||
Conservative | James F. Bullock | 379 | |||
Liberal Democrats | Deborah M. Sutherland | 377 | |||
Conservative | Piers c.w. Pressdee | 344 | |||
Turnout | 40.9% | ||||
Labour hold | Swing | ||||
Party | Candidate | Votes | % | ±% | |
---|---|---|---|---|---|
Conservative | Guy Mortimer | 908 | |||
Labour | Adam C. Gray | 832 | |||
Conservative | Kenneth R. Petrie | 810 | |||
Labour | Paul A Richards | 778 | |||
Liberal Democrats | Hector I. Macdonald | 214 | |||
Liberal Democrats | Tamara Dragadze | 165 | |||
Green | Laura E. Davenport | 127 | |||
Turnout | 52.4% | ||||
Conservative hold | Swing | ||||
Labour gain from Conservative | Swing | ||||
Party | Candidate | Votes | % | ±% | |
---|---|---|---|---|---|
Liberal Democrats | Alexandra E. Sugden | 782 | |||
Liberal Democrats | Simon G.D. Thompson | 697 | |||
Labour | Bill Dann | 697 | |||
Conservative | Alexander P. Karmel | 674 | |||
Conservative | David A.R. Thorp | 668 | |||
Labour | Arthur Lott | 656 | |||
Turnout | 54.2% | ||||
Liberal Democrats gain from Conservative | Swing | ||||
Party | Candidate | Votes | % | ±% | |
---|---|---|---|---|---|
Labour | Iain Coleman | 1,070 | |||
Labour | Andy Slaughter | 1,037 | |||
Conservative | Matthew F. Dobbs | 609 | |||
Conservative | Philippa M. Roe | 575 | |||
Liberal Democrats | lain Barclay | 261 | |||
Liberal Democrats | Gerald C. Killingworth | 213 | |||
Turnout | 43.5% | ||||
Labour hold | Swing | ||||
Party | Candidate | Votes | % | ±% | |
---|---|---|---|---|---|
Labour | Leslie E. Aldridge | 1,117 | |||
Labour | Adam Farrar | 1,091 | |||
Conservative | Lesley-Anne Brennan | 680 | |||
Conservative | Nicholas B. Botterill | 645 | |||
Liberal Democrats | Timothy J. Ward | 273 | |||
Turnout | 47.5% | ||||
Labour hold | Swing | ||||
Party | Candidate | Votes | % | ±% | |
---|---|---|---|---|---|
Labour | Shirley M. Spiers | 1,164 | |||
Labour | Lisa F. Homan | 1,161 | |||
Conservative | Jonathan R. Pemberton | 556 | |||
Conservative | John E.J. Pickthorn | 530 | |||
Liberal Democrats | Gerald L. Milch | 236 | |||
Turnout | 49.6% | ||||
Labour hold | Swing | ||||
Party | Candidate | Votes | % | ±% | |
---|---|---|---|---|---|
Labour | Eleanor J. Caruana | 1,050 | |||
Labour | Valerie A.E. Barker | 1,013 | |||
Conservative | Timothy D. Davie | 707 | |||
Conservative | William J.G.R. Yonge | 652 | |||
Liberal Democrats | Martin W.M. Bryant | 238 | |||
Liberal Democrats | Russell D. Pyne | 227 | |||
Turnout | 47.9% | ||||
Labour hold | Swing | ||||
Party | Candidate | Votes | % | ±% | |
---|---|---|---|---|---|
Conservative | Emile P. Al-Uzaizi | 1,375 | |||
Conservative | Andrew P. Ground | 1,375 | |||
Labour | Louise M. Coubrough | 428 | |||
Labour | Francis J. Lukey | 388 | |||
Liberal Democrats | Terence P. Frisby | 227 | |||
Liberal Democrats | David L. Jacques | 171 | |||
Turnout | 52.5% | ||||
Conservative hold | Swing | ||||
Party | Candidate | Votes | % | ±% | |
---|---|---|---|---|---|
Labour | Huw Davies | 834 | |||
Conservative | Angela Clarke | 814 | |||
Labour | Julian Hillman | 774 | |||
Conservative | William C. Smith | 757 | |||
Liberal Democrats | Bruce Douglas-Mann | 220 | |||
Liberal Democrats | Ann J. Wates | 198 | |||
Green | Edward A.D.R. McInnes | 78 | |||
Green | John Phillips | 65 | |||
Turnout | 50.1% | ||||
Labour gain from Conservative | Swing | ||||
Conservative hold | Swing | ||||
Party | Candidate | Votes | % | ±% | |
---|---|---|---|---|---|
Labour | Brendan Bird | 1,030 | |||
Labour | Nadeem Aftab | 1,008 | |||
Conservative | Michael J. Brennan | 802 | |||
Conservative | Stephen J. Greenhalgh | 759 | |||
Liberal Democrats | Mary J. McNamee | 216 | |||
Liberal Democrats | Gabrielle Minken | 173 | |||
Turnout | 45.6% | ||||
Labour hold | Swing | ||||
Party | Candidate | Votes | % | ±% | |
---|---|---|---|---|---|
Conservative | Celia M. Johnson | 776 | |||
Labour | John Garrett | 756 | |||
Conservative | Alan P. Thomas | 716 | |||
Labour | Daniel A. Filson | 683 | |||
Liberal Democrats | Alastair J. Brett | 184 | |||
Turnout | 49.0% | ||||
Conservative hold | Swing | ||||
Labour gain from Conservative | Swing | ||||
Party | Candidate | Votes | % | ±% | |
---|---|---|---|---|---|
Labour | David Williams | 1,073 | |||
Labour | Timothy C. Stanley | 1,063 | |||
Conservative | Elizabeth A. St Clair-Legge | 602 | |||
Conservative | Peter F.H. Stephens | 597 | |||
Liberal Democrats | Louise E. Burden | 317 | |||
Liberal Democrats | Hilary S. Moss | 313 | |||
Turnout | 51.0% | ||||
Labour hold | Swing | ||||
Party | Candidate | Votes | % | ±% | |
---|---|---|---|---|---|
Conservative | Gerald A Wombwell | 1,048 | |||
Conservative | Jonathan J. Maiden | 1,019 | |||
Labour | Anthony Bird | 717 | |||
Labour | Jeffrey Kenner | 595 | |||
Liberal Democrats | Joan Bonser | 234 | |||
Liberal Democrats | Peter M. Crystal | 201 | |||
Turnout | 49.9% | ||||
Conservative hold | Swing | ||||
Party | Candidate | Votes | % | ±% | |
---|---|---|---|---|---|
Conservative | Antony C. Glover | 1,027 | |||
Conservative | Mark A. Loveday | 995 | |||
Labour | Tracey Brader | 589 | |||
Labour | Stephen Brennan | 561 | |||
Liberal Democrats | Leonard T. Bonser | 260 | |||
Liberal Democrats | Allan W. McKelvie | 238 | |||
Turnout | 44.8% | ||||
Conservative hold | Swing | ||||
Party | Candidate | Votes | % | ±% | |
---|---|---|---|---|---|
Conservative | Elizabeth Mills | 1,085 | |||
Conservative | Frances M. Stainton | 1,071 | |||
Labour | Janet Dowiatt | 891 | |||
Labour | Ahmed Aftab | 840 | |||
Liberal Democrats | Michael J.M. Woolcott | 267 | |||
Turnout | 45.0% | ||||
Conservative hold | Swing | ||||
Party | Candidate | Votes | % | ±% | |
---|---|---|---|---|---|
Labour | Ronald E. Browne | 1,880 | |||
Labour | Graham Jones | 1,767 | |||
Labour | Abu S.M.J. Khaled | 1,598 | |||
Conservative | John C.B. Bradley | 408 | |||
Liberal Democrats | Michael R. Boudry | 338 | |||
Conservative | Albert J. Crosby | 319 | |||
Conservative | Eileen I. Crewdson | 301 | |||
Turnout | 41.1% | ||||
Labour hold | Swing | ||||
Party | Candidate | Votes | % | ±% | |
---|---|---|---|---|---|
Labour | Colin Aherne | 1,570 | |||
Labour | Stephen B. Burke | 1,479 | |||
Labour | Sally A. Powell | 1,422 | |||
Conservative | Gregory L.G. Barker | 672 | |||
Conservative | Elizabeth Fortescue-Hitchins | 577 | |||
Conservative | Andrew D. Ive | 557 | |||
Liberal Democrats | Elizabeth T. de Mowbray | 298 | |||
Turnout | 42.1% | ||||
Labour hold | Swing | ||||
The 2006 Barnet Council election took place on 4 May 2006 to elect members of Barnet London Borough Council in London, England. The whole council was up for election and the Conservative party stayed in overall control of the council.
The 2008 Solihull Metropolitan Borough Council election took place on 1 May 2008 to elect members of Solihull Metropolitan Borough Council in the West Midlands, England. One third of the council was up for election and the Conservative Party gained overall control of the council from no overall control.
The 2006 Solihull Metropolitan Borough Council election took place on 4 May 2006 to elect members of Solihull Metropolitan Borough Council in the West Midlands, England. One third of the council was up for election and the Conservative Party stayed in overall control of the council.
The 2007 Solihull Metropolitan Borough Council election took place on 4 May 2007 to elect members of Solihull Metropolitan Borough Council in the West Midlands, England. One third of the council was up for election and the Conservative Party lost overall control of the council to no overall control.
The 2007 Pendle Borough Council election took place on 3 May 2007 to elect members of Pendle Borough Council in Lancashire, England. One third of the council was up for election and the Liberal Democrats stayed in overall control of the council.
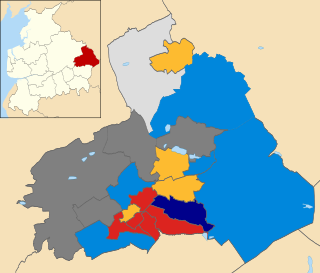
The 2008 Pendle Borough Council election took place on 1 May 2008 to elect members of Pendle Borough Council in Lancashire, England. One third of the council was up for election and the Liberal Democrats lost overall control of the council to no overall control.
The 2002 Basingstoke and Deane Council election took place on 2 May 2002 to elect members of Basingstoke and Deane Borough Council in Hampshire, England. The whole council was up for election with boundary changes since the last election in 2000 increasing the number of seats by 3. The council stayed under no overall control.
The 2011 Hertsmere Borough Council election took place on 5 May 2011 to elect members of Hertsmere Borough Council in Hertfordshire, England. One third of the council was up for election and the Conservative Party stayed in overall control of the council.
The 2004 Colchester Borough Council election took place on 10 June 2004 to elect members of Colchester Borough Council in Essex, England. This was the same day as the other 2004 United Kingdom local elections and as the 2004 European Parliament Elections. One third of the seats were up for election and the council stayed under no overall control.
Local government elections took place in London, and some other parts of the United Kingdom on Thursday 5 May 1994. Ward changes took place in Barking and Dagenham and Ealing which increased the total number of councillors by 3 from 1,914 to 1,917.
The 2006 Brent London Borough Council election took place on 4 May 2006 to elect members of Brent London Borough Council in London, England. The whole council was up for election and the Labour Party lost overall control of the council to no overall control.
The 2014 Brent London Borough Council election took place on 22 May 2014 to elect members of Brent London Borough Council in London, England. The whole council was up for election and the Labour Party stayed in overall control of the council.
The 1982 Hammersmith and Fulham Council election took place on 6 May 1982 to elect members of Hammersmith and Fulham London Borough Council in London, England. The whole council was up for election and the council stayed in no overall control.
The 1990 Hammersmith and Fulham Council election took place on 3 May 1990 to elect members of Hammersmith and Fulham London Borough Council in London, England. The whole council was up for election and the Labour party stayed in overall control of the council.
The 1998 Hammersmith and Fulham Council election took place on 7 May 1998 to elect members of Hammersmith and Fulham London Borough Council in London, England. The whole council was up for election and the Labour party stayed in overall control of the council.
The 2018 Hammersmith and Fulham Council election took place on 3 May 2018 to elect members of Hammersmith and Fulham Council in London.
The 2002 Hammersmith and Fulham Council election took place on 2 May 2002 to elect members of Hammersmith and Fulham London Borough Council in London, England. The whole council was up for election and the Labour party stayed in overall control of the council, despite winning fewer votes than the Conservative party.
The 2022 London local elections took place on 5 May 2022, as part of the 2022 United Kingdom local elections. All London borough councillor seats were up for election. Mayoral elections took place in Hackney, Lewisham, Newham and Tower Hamlets, with Croydon electing a mayor for the first time following a local referendum in October 2021.
The 2022 Hammersmith and Fulham London Borough Council election took place on 5 May 2022. All 50 members of Hammersmith and Fulham London Borough Council were elected. The elections took place alongside local elections in the other London boroughs and elections to local authorities across the United Kingdom.
Elections for the London Borough of Merton were held on 5 May 2022 to elect all 57 members of Merton London Borough Council in England. The elections took place alongside local elections in the other London boroughs and elections to local authorities across the United Kingdom.