
Havering London Borough Council in London, England is elected every four years. Since the last boundary changes in 2022, 55 councillors have been elected from 20 wards. [1]
Havering London Borough Council in London, England is elected every four years. Since the last boundary changes in 2022, 55 councillors have been elected from 20 wards. [1]
The first election to the council was held in 1964, initially operating as a shadow authority ahead of the new system coming into full effect the following year. Political control of the council since 1964 has been held by the following parties:
| Election | Overall Control | Labour | Conservative | Ind./Res. | Lib Dems | BNP | UKIP | |
|---|---|---|---|---|---|---|---|---|
| 1964 | No overall control | 27 | 16 | 12 | - | - | - | |
| 1968 | Conservative | 7 | 35 | 13 | - | - | - | |
| 1971 | Labour | 30 | 13 | 12 | - | - | - | |
| 1974 | No overall control | 26 | 20 | 9 | - | - | - | |
| 1978 | Conservative | 12 | 38 | 13 | - | - | - | |
| 1982 | Conservative | 12 | 37 | 9 | 5 | - | - | |
| 1986 | No overall control | 20 | 28 | 10 | 5 | - | - | |
| 1990 | No overall control | 25 | 19 | 13 | 6 | - | - | |
| 1994 | No overall control | 31 | 11 | 17 | 4 | - | - | |
| 1998 | No overall control | 29 | 14 | 17 | 3 | - | - | |
| 2002 | No overall control | 9 | 26 | 18 | 1 | - | - | |
| 2006 | Conservative | 2 | 34 | 16 | 1 | 1 | - | |
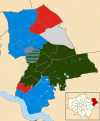
| 2010 | Conservative | 5 | 33 | 16 | - | - | - | |
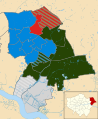
| 2014 | No overall control | 1 | 22 | 24 | - | - | 7 | |
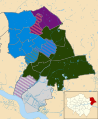
| 2018 | No overall control | 5 | 25 | 24 | - | - | - | |
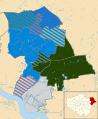
| 2022 | No overall control | 9 | 23 | 23 | - | - | - | |
The role of mayor in Havering is largely ceremonial, usually being held by a different councillor each year. Political leadership is instead provided by the leader of the council. The leaders since 1965 have been: [2] [3]
| Councillor | Image | Party | From | To | |
|---|---|---|---|---|---|
| Jack Moultrie |  | Conservative | 1965 | 1971 | |
| Michael Ward |  | Labour | 1971 | 1974 | |
| Jack Moultrie | | Conservative | 1974 | 1977 | |
| William Sibley |  | Conservative | 1977 | 1978 | |
| Jack Moultrie | | Conservative | 1978 | 1984 | |
| Roger Ramsey |  | Conservative | 1984 | 1990 | |
| Arthur Latham | Labour | 1990 | 1996 | ||
| Louise Sinclair |  | Residents' Association | 1996 | 1997 | |
| Wilf Mills |  | Labour | 1997 | 1998 | |
| Ray Harris |  | Labour | 1998 | 2002 | |
| Eric Munday |  | Conservative | 2002 | 2004 | |
| Michael White |  | Conservative | 2004 | 29 Jan 2014 | |
| Steven Kelly | Conservative | 29 Jan 2004 | 11 Jun 2014 | ||
| Roger Ramsey | | Conservative | 11 Jun 2014 | 23 May 2018 | |
| Damian White | Conservative | 23 May 2018 | 25 May 2022 | ||
| Ray Morgon | Havering Residents Association | 25 May 2022 | |||


There were no by-elections. [8]
| Party | Candidate | Votes | % | ±% | |
|---|---|---|---|---|---|
| Conservative | F. J. Orrin | 968 | |||
| Conservative | C. J. Kemp | 967 | |||
| Independent Ratepayers | L. E. Jackson | 137 | |||
| Labour | A. E. Mills | 128 | |||
| Labour | C. J. Connor | 123 | |||
| Independent Ratepayers | R. C. Vickers | 123 | |||
| Turnout | 20.5% | ||||
| Conservative hold | Swing | ||||
| Conservative hold | Swing | ||||
| Party | Candidate | Votes | % | ±% | |
|---|---|---|---|---|---|
| Conservative | S. O. New | 839 | |||
| Independent | E. Bates | 183 | |||
| Labour | R. E. Whitworth | 58 | |||
| Turnout | 20.1% | ||||
| Party | Candidate | Votes | % | ±% | |
|---|---|---|---|---|---|
| Conservative | D. G. Peters | 1258 | |||
| Independent Ratepayers | T. S. C. Dix | 668 | |||
| Labour | G. W. Saunders | 279 | |||
| Liberal | B. A. Grant | 141 | |||
| Turnout | 27.7% | ||||
| Party | Candidate | Votes | % | ±% | |
|---|---|---|---|---|---|
| Labour | W. F. Cole | 1365 | |||
| Conservative | N. F. Symonds | 1189 | |||
| Communist | H. S. Reeves | 75 | |||
| Turnout | 26.7% | ||||
| Party | Candidate | Votes | % | ±% | |
|---|---|---|---|---|---|
| Labour | S. G. Heath-Coleman | 986 | |||
| Conservative | R. E. Ramsey | 199 | |||
| Communist | R. Cohen | 56 | |||
| Independent | K. W. Roe | 53 | |||
| Turnout | 19.1% | ||||
| Party | Candidate | Votes | % | ±% | |
|---|---|---|---|---|---|
| Conservative | A. Gladwin | 1462 | |||
| Labour | R. S. Kilbey | 339 | |||
| Turnout | 17.4% | ||||
| Party | Candidate | Votes | % | ±% | |
|---|---|---|---|---|---|
| Labour | A. E. Mills | 1,248 | |||
| Conservative | E. Joslin | 489 | |||
| Communist | H. S. Reeves | 20 | |||
| Turnout | 16.0% | ||||
| Party | Candidate | Votes | % | ±% | |
|---|---|---|---|---|---|
| Labour | W. C. Mills | 1,633 | |||
| Conservative | Mrs M. E. Noyes | 161 | |||
| Liberal | T. Hurlstone | 77 | |||
| Turnout | 19.4% | ||||
| Party | Candidate | Votes | % | ±% | |
|---|---|---|---|---|---|
| Labour | D. R. O'Flynn | 1,014 | |||
| Conservative | Mrs A. M. North | 170 | |||
| Liberal | B. A. Grant | 38 | |||
| Turnout | 17.8% | ||||
| Party | Candidate | Votes | % | ±% | |
|---|---|---|---|---|---|
| Labour | Mrs M. M. Rudlin | 1,299 | |||
| Conservative | L. J. Reilly | 116 | |||
| Communist | R. Cohen | 56 | |||
| Dwarf | C. G. Thomson | 22 | |||
| Liberal | T. W. Keeper | 21 | |||
| Turnout | 20.5% | ||||
| Party | Candidate | Votes | % | ±% | |
|---|---|---|---|---|---|
| Conservative | T. L. Kemp | 1,088 | |||
| Labour | Mrs I. S. Whysall | 437 | |||
| Independent Ratepayers | J. A. Bates | 241 | |||
| Liberal | B. G. Sell | 128 | |||
| Turnout | 17.9% | ||||
| Party | Candidate | Votes | % | ±% | |
|---|---|---|---|---|---|
| Labour | G. F. Cox | 1,249 | |||
| Conservative | Mrs W. L. Whittingham | 860 | |||
| Turnout | 27.1% | ||||
| Party | Candidate | Votes | % | ±% | |
|---|---|---|---|---|---|
| Independent Ratepayers | R. Knell | 1,708 | |||
| Conservative | Mrs M. E. Noyes | 707 | |||
| Labour | S. V. Jack | 633 | |||
| Liberal | A. E. Rabone | 154 | |||
| Turnout | 27.8% | ||||
| Party | Candidate | Votes | % | ±% | |
|---|---|---|---|---|---|
| Labour | Reginald J. Whiting | 1,195 | |||
| Conservative | Stephen G. Brabner | 326 | |||
| Liberal | David J. Ingle | 239 | |||
| Turnout | 25.0 | ||||
| Party | Candidate | Votes | % | ±% | |
|---|---|---|---|---|---|
| Conservative | Leonard J. Trott | 2,118 | |||
| Labour | John P. Scott | 325 | |||
| Liberal | Keith A. Brewington | 251 | |||
| Independent Ratepayers Association | Ian H. Wilkes | 80 | |||
| Turnout | 25.9 | ||||
| Party | Candidate | Votes | % | ±% | |
|---|---|---|---|---|---|
| Labour | Dereck A. Smith | 1,714 | 54.1 | ||
| Liberal Democrats | Terry Hurlestone | 845 | 26.7 | ||
| Conservative | Eric Nicholls | 607 | 19.2 | ||
| Turnout | 39.9 | ||||
| Labour hold | Swing | ||||
The by-election was called following the resignation of Cllr. Sean L. Willis.
| Party | Candidate | Votes | % | ±% | |
|---|---|---|---|---|---|
| Labour | Dennis J. Cook | 982 | 54.2 | ||
| Liberal Democrats | Terry E. Hurlstone | 441 | 24.4 | ||
| Conservative | John C. Nicholls | 388 | 21.4 | ||
| Turnout | 28.1 | ||||
| Labour hold | Swing | ||||
The by-election was called following the resignation of Cllr. Mark A. Flewitt.
| Party | Candidate | Votes | % | ±% | |
|---|---|---|---|---|---|
| Conservative | Marjorie F. Ramsey | 851 | 51.2 | ||
| Residents | Ian H. Wilkes | 427 | 25.7 | ||
| Labour | Francis E. Bland | 365 | 22.0 | ||
| Ind. Conservative | Malcom T. Brace | 18 | 1.1 | ||
| Turnout | 29.2 | ||||
| Conservative hold | Swing | ||||
The by-election was called following the resignation of Cllr. Alice E. Smith.
| Party | Candidate | Votes | % | ±% | |
|---|---|---|---|---|---|
| Residents | Jean H. Mitchell | 1,190 | 62.9 | ||
| Labour | Keith E. Darvill | 490 | 25.9 | ||
| Conservative | Ian M. Woodward | 212 | 11.2 | ||
| Turnout | 33.4 | ||||
| Residents hold | Swing | ||||
The by-election was called following the resignation of Cllr. William A. Remfry.
There were no by-elections. [12]
| Party | Candidate | Votes | % | ±% | |
|---|---|---|---|---|---|
| Conservative | Gordon Scott-Morris | 990 | 58.1 | +12.5 | |
| Havering Residents Association | John F. Shrimpton | 541 | 31.8 | +0.4 | |
| Labour | Leonard W. Street (Jnr) | 138 | 8.1 | -14.9 | |
| Socialist Alliance | Peter J. Alder | 34 | 2.0 | +2.0 | |
| Majority | 449 | 16.3 | |||
| Turnout | 1,703 | 29.0 | |||
| Conservative hold | Swing | ||||
The by-election was called following the death of Cllr. Norman F. Symonds.
| Party | Candidate | Votes | % | ±% | |
|---|---|---|---|---|---|
| Labour | Sean Willis | 582 | 46.2 | -14.4 | |
| Conservative | Edward C. Bates | 240 | 19.0 | -1.5 | |
| Havering Residents Association | Eric J. Staggs | 139 | 11.0 | +11.0 | |
| Independent | Neil R. M. Stanton | 135 | 10.7 | +10.7 | |
| Liberal Democrats | Henry J. Wilson | 91 | 7.2 | +7.2 | |
| UKIP | Terry P. Murray | 74 | 5.9 | +5.9 | |
| Majority | 342 | 27.2 | |||
| Turnout | 1,261 | 15.2 | |||
| Labour hold | Swing | ||||
The by-election was called following the death of Cllr. Ruby M. Latham.
| Party | Candidate | Votes | % | ±% | |
|---|---|---|---|---|---|
| Labour | Harry A. Webb | 771 | 35.3 | +2.3 | |
| Conservative | Maureen M. Carter | 640 | 29.3 | +15.8 | |
| Rainham & Wennington Independent Residents Group | Anthony J. J. Turvey | 491 | 22.5 | -31.1 | |
| Green | David J. Peacock | 127 | 5.8 | +5.8 | |
| National Liberal | David Durrant | 93 | 4.3 | +4.3 | |
| UKIP | Terry P. Murray | 62 | 2.8 | +2.8 | |
| Majority | 131 | 6.0 | |||
| Turnout | 2,184 | 23.6 | |||
| Labour gain from Rainham & Wennington Independent Residents Group | Swing | ||||
The by-election was called following the resignation of Cllr. Brian M. Clarke.
| Party | Candidate | Votes | % | ±% | |
|---|---|---|---|---|---|
| Labour | Anthony J. Ellis | 805 | 31.2 | -4.1 | |
| Conservative | Maureen M. Carter | 776 | 30.1 | +0.8 | |
| BNP | Mark Blunden | 549 | 21.3 | +21.3 | |
| Rainham & Wennington Independent Residents Group | Graham K. Croft | 265 | 10.3 | -12.2 | |
| National Liberal | David W. Durant | 93 | 3.6 | -0.7 | |
| Green | Martin Mannion | 89 | 3.5 | -2.3 | |
| Majority | 29 | 1.1 | |||
| Turnout | 2,577 | 28.5 | |||
| Labour gain from Rainham & Wennington Independent Residents Group | Swing | ||||
The by-election was called following the resignation of Cllr. Wayne A. Redgrave.
| Party | Candidate | Votes | % | ±% | |
|---|---|---|---|---|---|
| Havering Residents Association | Mike Winter | 993 | 32.0 | -3.6 | |
| Conservative | Gary G. Murphy | 583 | 18.8 | -15.7 | |
| BNP | Mark J. Logan | 580 | 18.7 | +18.7 | |
| Labour | Bryan T. Vincent | 511 | 16.5 | +0.7 | |
| National Liberal | David W. Durant | 184 | 5.9 | -0.8 | |
| UKIP | Lawrence J. Webb | 169 | 5.5 | +5.5 | |
| Liberal Democrats | Angela A. Kawa | 80 | 2.6 | +2.6 | |
| Majority | 410 | 13.2 | |||
| Turnout | 3,100 | 29.6 | |||
| Havering Residents Association hold | Swing | ||||
The by-election was called following the resignation of Cllr. Brenda J. Riddle.
| Party | Candidate | Votes | % | ±% | |
|---|---|---|---|---|---|
| Conservative | Lynden A. Thorpe | 1828 | |||
| Havering Residents Association | Denis H. Stevens | 310 | |||
| Labour | Peter J. Mcinerney | 210 | |||
| Liberal | Gregory H. Campbell | 170 | |||
| UKIP | Terry P. Murray | 134 | |||
| Turnout | |||||
| Conservative hold | Swing | ||||
The by-election was called following the death of Cllr. Edward Cahill.
| Party | Candidate | Votes | % | ±% | |
|---|---|---|---|---|---|
| BNP | Mark Logan | 865 | 38.0 | +9.8 | |
| Labour | Yve Cornell | 741 | 32.5 | +6.6 | |
| Conservative | Malcolm G. Fox | 489 | 21.5 | -5.5 | |
| UKIP | Lawrence J. Webb | 70 | 3.1 | -7.6 | |
| Liberal | David W. Durant | 62 | 2.7 | +2.7 | |
| Liberal Democrats | Ian V. Sanderson | 52 | 2.3 | +2.3 | |
| Majority | 124 | 5.5 | |||
| Turnout | 2,279 | 22.6 | |||
| BNP hold | Swing | ||||
The by-election was called following the resignation of Cllr. Alan H. Bailey.
| Party | Candidate | Votes | % | ±% | |
|---|---|---|---|---|---|
| Independent | Michael D. Burton | 661 | 27.0 | +7.9 | |
| BNP | Anthony A. Steff | 518 | 21.2 | +21.2 | |
| Conservative | Christopher P. R. Ryan | 438 | 17.9 | -4.7 | |
| Labour | Graham M. Carr | 416 | 17.0 | -5.9 | |
| South Hornchurch Independent Residents Group | Reg Whitney | 287 | 11.7 | -12.8 | |
| UKIP | Craig J. Litwin | 64 | 2.6 | +2.6 | |
| English Democrat | Dr. Peter Thorogood | 28 | 1.1 | +1.1 | |
| Residents' Association of London | Malvin P. Brown | 17 | 0.7 | -4.5 | |
| Independent | Mark R. Whitehead | 17 | 0.7 | +0.7 | |
| Majority | 143 | 5.8 | |||
| Turnout | 2,446 | 23.8 | |||
| Independent gain from Residents | Swing | ||||
The by-election was called following the death of Cllr. Leonard F. Long.
| Party | Candidate | Votes | % | ±% | |
|---|---|---|---|---|---|
| Havering Residents Association | John C. Wood | 1,413 | 32.0 | ||
| Conservative | Garry L. Pain | 891 | 20.2 | ||
| BNP | Michael Joyce | 771 | 17.5 | ||
| Labour | Graham M. Carr | 455 | 10.3 | ||
| Say No to European Union | Lawrence J. Webb | 433 | 9.8 | ||
| Liberal | David W. Durant | 291 | 6.6 | ||
| Liberal Democrats | Keith I. Taffs | 159 | 3.6 | ||
| Majority | 522 | 11.8 | |||
| Turnout | 4,413 | 42.6 | |||
| Havering Residents Association gain from Conservative | Swing | ||||
The by-election was called following the resignation of Cllr. David G. Charles.
| Party | Candidate | Votes | % | ±% | |
|---|---|---|---|---|---|
| UKIP | Lawrence James Webb | 831 | 38.95 | +24.6 | |
| Labour | Christine Anne McGeary | 569 | 26.67 | -1.8 | |
| Conservative | Marcus Christian Sebastian Llewellyn-Rothschild | 280 | 13.12 | -12.5 | |
| Havering Residents Association | Darren Christopher Wise | 227 | 10.64 | +1.2 | |
| BNP | Micky Braun | 202 | 9.47 | -12.6 | |
| Residents' Association of London | Malvin Paul Brown | 24 | 1.12 | +1.12 | |
| Majority | 262 | 12.28 | |||
| Turnout | 2,133 | 20.5 | |||
| UKIP gain from Conservative | Swing | ||||
The by-election was called following the death of Cllr. Dennis R. Bull.
| Party | Candidate | Votes | % | ±% | |
|---|---|---|---|---|---|
| Labour | Denis O'Flynn | 1,122 | 30.1 | +0.4 | |
| Conservative | Keith Frank Wells | 951 | 25.5 | +6.8 | |
| UKIP | John Thurtle | 864 | 23.3 | -14.9 | |
| Independent | Christopher John Cooper | 515 | 13.8 | +13.8 | |
| Green | Peter Caton | 107 | 2.9 | +2.9 | |
| Liberal Democrats | Jonathan Coles | 86 | 2.3 | +2.3 | |
| BNP | Denise Underwood | 73 | 2.0 | -11.7 | |
| National Front | Kevin Henry Layzell | 14 | 0.4 | +0.4 | |
| Majority | 171 | ||||
| Turnout | |||||
| Labour gain from UKIP | Swing | ||||
The by-election was triggered by the resignation of Councillor Phillip Hyde (Independent, elected as UK Independence Party) [20]
| Party | Candidate | Votes | % | ±% | |
|---|---|---|---|---|---|
| Residents | Jacqueline Ann Williams | 1,642 | |||
| Conservative | Edward Andrew Green | 421 | |||
| Labour | John Gregory Sullivan | 234 | |||
| Independent | David Warren Durant | 150 | |||
| Green | Melanie Jane Collins | 115 | |||
| Liberal Democrats | Thomas Patrick Clark | 35 | |||
| Turnout | |||||
| Majority | |||||
| Residents hold | Swing | ||||
The by-election was called following the death of Cllr. Linda Hawthorn (Havering Residents Association).

Elections for the Croydon London Borough Council are held every four years to elect 70 councillors. The last ward boundary changes came into force at the 2018 local elections.

Ealing Council is elected every four years.

Redbridge London Borough Council in London, England is elected every four years.

Harrow London Borough Council in London, England is elected every four years. Since the last boundary changes in 2022, 55 councillors are elected from 22 wards.

Lewisham London Borough Council is the local authority for the London Borough of Lewisham, in London, United Kingdom. Elections are held every four years using a plurality bloc vote electoral system for the councillors and the supplementary vote electoral system for the elected mayor.

Hounslow Council in London, England is elected every four years. 60 councillors are elected from 20 wards, with by-elections held to fill any vacancies between elections.

Tower Hamlets London Borough Council, the local authority for the London Borough of Tower Hamlets, is elected every four years.

Richmond upon Thames London Borough Council elections are held every four years for all 54 councillor seats in the 18 wards that make up the Borough Council. By-elections are held in individual wards when vacancies arise outside the four-year cycle.

Southwark London Borough Council is the local authority for the London Borough of Southwark in London, England. The council is elected every four years. Since the last boundary changes in 2018, 63 councillors have been elected from 23 wards.

Elections for Hackney Council in London take place every four years.

Waltham Forest London Borough Council in London is elected every four years. Since the last boundary changes in 2002, 60 councillors have been elected from 20 wards, with 3 councillors per ward.

Sutton London Borough Council in London, England is elected every four years.

Haringey London Borough Council is the local authority for the London Borough of Haringey in London, England. The council is elected every four years.

The members of the Hillingdon London Borough Council in London, England are elected every four years. Since the 2022 boundary changes, the council is composed of 53 councillors.
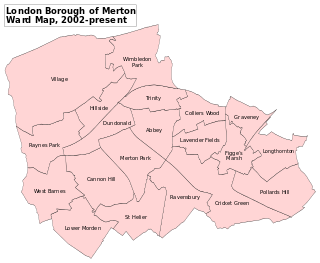
Merton London Borough Council in London, England is elected every four years; it has administrative control over the London Borough of Merton.

Kensington and Chelsea London Borough Council in London, England, is elected every four years. Since the last boundary changes in 2014, 50 councillors have been elected from 18 wards.

Islington London Borough Council in London, England is elected every four years. Since the last boundary changes in 2002, 48 councillors have been elected from 16 wards.

Greenwich London Borough Council is the local authority for the Royal Borough of Greenwich in London, England. The council is elected every four years. Since the last boundary changes in 2022, 55 councillors have been elected from 23 wards.
Wandsworth London Borough Council, England, is elected every four years. From 2002 to 2018, 60 councillors were elected from 20 wards. Following ward boundary changes, in 2022 58 councillors were elected in 22 wards returning either 2 or 3 councillors each.

Newham London Borough Council is elected every four years.