| |||||||||||||||||||||
All 60 seats to Barnet London Borough Council 31 seats needed for a majority | |||||||||||||||||||||
---|---|---|---|---|---|---|---|---|---|---|---|---|---|---|---|---|---|---|---|---|---|
Turnout | 50.0% | ||||||||||||||||||||
| |||||||||||||||||||||
Map of the results of the 1990 Barnet London Borough council election. Conservatives in blue and Labour in red. | |||||||||||||||||||||
|
The 1990 Barnet Council election took place on 3 May 1990 to elect members of Barnet London Borough Council in London, England. The whole council was up for election and the Conservative party stayed in overall control of the council.
This section is empty. You can help by adding to it. (February 2015) |
Overall turnout in the election was 50.0%.
Party | Seats | Gains | Losses | Net gain/loss | Seats % | Votes % | Votes | +/− | |
---|---|---|---|---|---|---|---|---|---|
Conservative | 39 | 3 | 3 | 0 | 65.00 | 49.80 | 141,815 | ||
Labour | 18 | 3 | 3 | 0 | 30.00 | 36.12 | 102,847 | ||
Liberal Democrats | 3 | 0 | 0 | 0 | 5.00 | 10.86 | 30,918 | ||
Green | 0 | 0 | 0 | 0.00 | 2.11 | 6,017 | |||
Independent | 0 | 0 | 0 | 0.00 | 0.59 | 1,671 | |||
Independent Resident | 0 | 0 | 0 | 0.00 | 0.25 | 705 | |||
Ind. Conservative | 0 | 0 | 0 | 0.00 | 0.21 | 595 | |||
SDP | 0 | 0 | 0 | 0.00 | 0.07 | 208 | |||
Total | 60 | 284,776 |
(*) - indicates an incumbent candidate
(†) - Indicates an incumbent candidate standing in a different ward
Party | Candidate | Votes | % | |
---|---|---|---|---|
Labour | Anita Campbell | 2,589 | 43.12 | |
Labour | Kevin Smith | 2,456 | ||
Labour | Pamela Coleman | 2,443 | ||
Conservative | Ian Balcombe* | 2,422 | 40.99 | |
Conservative | Arthur Beck* [n 1] | 2,374 | ||
Conservative | Philip Williams* [n 2] | 2,322 | ||
Liberal Democrats | David Keech | 768 | 12.68 | |
Liberal Democrats | Michael Cleal | 746 | ||
Liberal Democrats | Trevor Orr | 689 | ||
Green | Aniel Paranjpe | 186 | 3.21 | |
Registered electors | 11,975 | |||
Turnout | 6,037 | 50.41 | ||
Rejected ballots | 10 | 0.17 | ||
Labour gain from Conservative | ||||
Party | Candidate | Votes | % | |
---|---|---|---|---|
Conservative | Donald Goodman* | 2,643 | 56.04 | |
Conservative | Irene Palmer* | 2,507 | ||
Conservative | John Rawles* | 2,489 | ||
Labour | David Bloyce | 1,568 | 33.00 | |
Labour | Rita Brent | 1,471 | ||
Labour | Janet Heathfield | 1,458 | ||
Liberal Democrats | Alwena Lillywhite | 509 | 10.96 | |
Liberal Democrats | Peter Watkins | 503 | ||
Liberal Democrats | Andrew Hydon | 483 | ||
Registered electors | 10,580 | |||
Turnout | 4,913 | 46.44 | ||
Rejected ballots | 9 | 0.18 | ||
Conservative hold | ||||
Party | Candidate | Votes | % | |
---|---|---|---|---|
Labour | Alan Williams* | 2,548 | 55.45 | |
Labour | Malcolm Sargeant | 2,300 | ||
Labour | Gerald Shamash* | 2,183 | ||
Conservative | Oliver Stone | 1,172 | 27.02 | |
Conservative | Patricia Gammond | 1,153 | ||
Conservative | Robert Musik | 1,101 | ||
Green | Dorothy Lewis | 428 | 10.13 | |
Liberal Democrats | Albert Earley | 313 | 7.40 | |
Registered electors | 9,701 | |||
Turnout | 4,330 | 44.63 | ||
Rejected ballots | 0 | 0.00 | ||
Labour hold | ||||
Labour hold | ||||
Labour hold | ||||
Party | Candidate | Votes | % | |
---|---|---|---|---|
Liberal Democrats | Monroe Palmer* | 1,803 | 38.75 | |
Liberal Democrats | Jack Cohen* | 1,637 | ||
Liberal Democrats | Brian Stone* | 1,579 | ||
Conservative | Malcolm Harris | 1,420 | 32.49 | |
Conservative | Simone Plaut | 1,405 | ||
Conservative | Richard Martyn | 1,385 | ||
Labour | June Cort | 1,043 | 22.58 | |
Labour | David Gottlieb | 970 | ||
Labour | Anthony Hulstrom | 913 | ||
Green | Ashley Gunstock | 267 | 6.18 | |
Registered electors | 8,751 | |||
Turnout | 4,440 | 50.74 | ||
Rejected ballots | 0 | 0.00 | ||
Liberal Democrats hold | ||||
Party | Candidate | Votes | % | |
---|---|---|---|---|
Labour | Ellis Hillman* | 2,298 | 47.38 | |
Labour | Thomas McKendry* | 2,226 | ||
Labour | David Williams | 2,186 | ||
Conservative | Robert Linton | 1,050 | 22.16 | |
Conservative | William Nicholson | 1,041 | ||
Independent Resident | Eyo Nkune | 705 | 14.93 | |
Green | Simon Moroney | 424 | 8.98 | |
Liberal Democrats | Joy Manson | 341 | 6.55 | |
Liberal Democrats | Peter Lusher | 315 | ||
Liberal Democrats | Alfred Stone | 271 | ||
Registered electors | 9,854 | |||
Turnout | 4,252 | 43.15 | ||
Rejected ballots | 4 | 0.09 | ||
Labour hold | ||||
Labour hold | ||||
Labour hold | ||||
Party | Candidate | Votes | % | |
---|---|---|---|---|
Conservative | Olwen Evans* | 2,446 | 45.48 | |
Conservative | John Perry* | 2,370 | ||
Conservative | Jihad Anani | 2,193 | ||
Labour | Janet Donald | 2,068 | 39.62 | |
Labour | Janice Scott | 2,051 | ||
Labour | Jeffrey Leifer | 1,987 | ||
Liberal Democrats | Margaret Neil | 617 | 10.85 | |
Liberal Democrats | Nicholas Sullivan | 537 | ||
Liberal Democrats | Sonia McCabe | 516 | ||
SDP | Colin Shaw | 208 | 4.05 | |
Registered electors | 10,898 | |||
Turnout | 5,403 | 49.58 | ||
Rejected ballots | 10 | 0.19 | ||
Conservative hold | ||||
Party | Candidate | Votes | % | |
---|---|---|---|---|
Labour | John Davies* | 3,699 | 64.65 | |
Labour | Joan Ryan | 3,417 | ||
Labour | Rudolf, J. Vis † [n 3] | 3,269 | ||
Conservative | Franklin Evans | 1,986 | 35.35 | |
Conservative | Christopher Thompson | 1,892 | ||
Conservative | Harjinder Aujla | 1,800 | ||
Registered electors | 11,109 | |||
Turnout | 5,893 | 53.05 | ||
Rejected ballots | 37 | 0.63 | ||
Labour hold | ||||
Labour hold | ||||
Labour hold | ||||
Party | Candidate | Votes | % | |
---|---|---|---|---|
Conservative | Julian Czarny | 2,996 | 58.98 | |
Conservative | Malcolm Lester* | 2,938 | ||
Conservative | Archibald Smith* | 2,874 | ||
Labour | Elizabeth Kelly | 1,321 | 25.55 | |
Labour | Jack Jaffe | 1,253 | ||
Labour | Keith Hurcombe | 1,241 | ||
Liberal Democrats | Philip Benjamin | 443 | 7.61 | |
Green | Michael Walton | 391 | 7.86 | |
Liberal Democrats | Barbara Farbey | 349 | ||
Liberal Democrats | Dorothy Rollinson | 344 | ||
Registered electors | 11,176 | |||
Turnout | 5,092 | 45.56 | ||
Rejected ballots | 3 | 0.06 | ||
Conservative hold | ||||
Party | Candidate | Votes | % | |
---|---|---|---|---|
Conservative | Eva Greenspan | 3,160 | 56.70 | |
Conservative | Leslie Sussman* | 3,157 | ||
Conservative | Barbara Langstone* | 3,143 | ||
Labour | Katherine McGuirk | 1,641 | 28.70 | |
Labour | Ruth Montague | 1,584 | ||
Labour | Alan Schamroth | 1,563 | ||
Green | Laurie Thompson | 500 | 8.99 | |
Liberal Democrats | Malcolm Davis | 332 | 5.61 | |
Liberal Democrats | Michael Cole | 313 | ||
Liberal Democrats | Bernadette Cleal | 290 | ||
Registered electors | 9,757 | |||
Turnout | 5,533 | 56.71 | ||
Rejected ballots | 19 | 0.34 | ||
Conservative hold | ||||
Party | Candidate | Votes | % | |
---|---|---|---|---|
Conservative | John Tiplady* | 2,913 | 52.89 | |
Conservative | Christopher Platford* | 2,896 | ||
Conservative | Brian Salinger* | 2,895 | ||
Labour | John Ellis | 2,035 | 36.94 | |
Labour | Lorimer Mackenzie | 2,024 | ||
Labour | Philip O'Connor | 2,020 | ||
Liberal Democrats | Nick Harvey | 579 | 10.17 | |
Liberal Democrats | Timothy Tombs | 554 | ||
Liberal Democrats | Andrew Wade | 541 | ||
Registered electors | 10,796 | |||
Turnout | 5,860 | 54.28 | ||
Rejected ballots | 13 | 0.22 | ||
Conservative hold | ||||
Party | Candidate | Votes | % | |
---|---|---|---|---|
Conservative | Frank Davis* | 2,948 | 59.60 | |
Conservative | Roy Shutz* | 2,923 | ||
Conservative | Veronica Soskin* [n 4] | 2,891 | ||
Liberal Democrats | Majorie Harris | 966 | 19.28 | |
Liberal Democrats | Michael Pickering | 942 | ||
Liberal Democrats | Susette Palmer | 927 | ||
Labour | Penelope Grant | 569 | 11.35 | |
Labour | Jula Westman | 567 | ||
Labour | Ephraim Lesser | 531 | ||
Green | Janet Strangeways | 479 | 9.77 | |
Registered electors | 9,575 | |||
Turnout | 4,908 | 51.26 | ||
Rejected ballots | 3 | 0.06 | ||
Conservative hold | ||||
Party | Candidate | Votes | % | |
---|---|---|---|---|
Conservative | Melvin Cohen* | 1,874 | 38.76 | |
Conservative | Leslie Foster* | 1,762 | ||
Conservative | John Hedge | 1,627 | ||
Labour | Peter Theobold | 1,287 | 28.22 | |
Labour | Nicholas Kissen | 1,273 | ||
Labour | Ghada Karmi | 1,270 | ||
Liberal Democrats | Harold Wiesenfeld | 1,244 | 26.41 | |
Liberal Democrats | Mira Levy | 1,172 | ||
Liberal Democrats | Barrie Manson | 1,169 | ||
Green | Christopher Brown | 299 | 6.61 | |
Registered electors | 9,485 | |||
Turnout | 4,629 | 48.80 | ||
Rejected ballots | 7 | 0.15 | ||
Conservative hold | ||||
Party | Candidate | Votes | % | |
---|---|---|---|---|
Conservative | Gillian Bull* | 3,305 | 39.01 | |
Conservative | Ashley Newman | 3,031 | ||
Conservative | Hazel Mammatt | 2,864 | ||
Labour | David Clarke | 1,707 | 20.80 | |
Labour | Michael Campbell | 1,694 | ||
Independent | Anthony Freake | 1,671 | 21.26 | |
Labour | Michael Larcey | 1,503 | ||
Liberal Democrats | Rosemary Watkins | 855 | 9.24 | |
Liberal Democrats | David Smith | 789 | ||
Green | Kevin Pressland | 762 | 9.69 | |
Liberal Democrats | Brigid Povah | 533 | ||
Registered electors | 13,274 | |||
Turnout | 6,760 | 50.93 | ||
Rejected ballots | 5 | 0.07 | ||
Conservative hold | ||||
Party | Candidate | Votes | % | |
---|---|---|---|---|
Conservative | Leslie Pym* | 2,588 | 50.34 | |
Conservative | Sheila Scott | 2,507 | ||
Conservative | Jack Clarfelt* | 2,470 | ||
Labour | Marie Baker | 1,608 | 30.98 | |
Labour | Andrew Dickie | 1,545 | ||
Labour | William Parnaby | 1,504 | ||
Liberal Democrats | James Creighton | 516 | 9.24 | |
Green | Patricia Duncan | 473 | 9.44 | |
Liberal Democrats | Geoffrey Jacobs | 457 | ||
Liberal Democrats | Quintin Iwi | 415 | ||
Registered electors | 9,983 | |||
Turnout | 5,114 | 51.23 | ||
Rejected ballots | 3 | 0.06 | ||
Conservative hold | ||||
Party | Candidate | Votes | % | |
---|---|---|---|---|
Conservative | Anthony Finn | 2,789 | 58.19 | |
Conservative | Edward Bunn | 2,692 | ||
Conservative | Frederick Poole* | 2,641 | ||
Labour | Francis Deutsch | 1,520 | 32.03 | |
Labour | Colin Francombe | 1,518 | ||
Labour | Bryan Reith | 1,432 | ||
Liberal Democrats | Joan Beales | 491 | 9.78 | |
Liberal Democrats | Richard Coward | 454 | ||
Liberal Democrats | David Ive | 419 | ||
Registered electors | 10,722 | |||
Turnout | 5,055 | 47.15 | ||
Rejected ballots | 9 | 0.18 | ||
Conservative hold | ||||
Party | Candidate | Votes | % | |
---|---|---|---|---|
Conservative | Dennis Dippel* | 2,879 | 55.17 | |
Conservative | Anthony Antoniou* | 2,837 | ||
Conservative | John Hart* | 2,775 | ||
Labour | Ian Parker | 1,394 | 25.20 | |
Labour | Malcolm Perez | 1,275 | ||
Labour | Adrienne van Louen | 1,210 | ||
Liberal Democrats | Ruth Cohen | 591 | 10.35 | |
Liberal Democrats | Terry Rollinson | 510 | ||
Liberal Democrats | John Mitchell | 491 | ||
Green | Anthony Duncan | 476 | 9.28 | |
Registered electors | 11,024 | |||
Turnout | 5,205 | 47.22 | ||
Rejected ballots | 2 | 0.04 | ||
Conservative hold | ||||
Party | Candidate | Votes | % | |
---|---|---|---|---|
Conservative | Helena Hart | 2,600 | 40.38 | |
Conservative | Mike Freer | 2,585 | ||
Conservative | Mary Phillips | 2,428 | ||
Labour | Naren Dave* | 2,399 | 36.72 | |
Labour | Kitty Lyons* | 2,313 | ||
Labour | Melanie Packer | 2,212 | ||
Green | John Colmans | 845 | 13.44 | |
Ind. Conservative | John Fitzgibbon | 595 | 9.46 | |
Registered electors | 10,048 | |||
Turnout | 5,868 | 58.40 | ||
Rejected ballots | 16 | 0.27 | ||
Conservative gain from Labour | ||||
Party | Candidate | Votes | % | |
---|---|---|---|---|
Conservative | Cecile Levinson* | 2,949 | 55.25 | |
Conservative | Victor Usher* | 2,949 | ||
Conservative | Victor Lyon* | 2,946 | ||
Labour | Clare Abbott | 1,477 | 26.22 | |
Labour | Stuart Fuller | 1,383 | ||
Labour | Sean Wallace | 1,338 | ||
Liberal Democrats | Francoise Lewis | 506 | 9.41 | |
Liberal Democrats | Jennifer Keech | 503 | ||
Liberal Democrats | Peter Finlayson | 496 | ||
Green | Michael Baldock | 487 | 9.12 | |
Registered electors | 10,980 | |||
Turnout | 5,411 | 49.28 | ||
Rejected ballots | 11 | 0.20 | ||
Conservative hold | ||||
Party | Candidate | Votes | % | |
---|---|---|---|---|
Labour | Timothy Sims* | 2,132 | 49.63 | |
Labour | Doreen Neall* | 2,102 | ||
Labour | Agnes Slocombe* | 2,001 | ||
Conservative | Dennis Hope | 1,767 | 41.60 | |
Conservative | Jane Ellison | 1,763 | ||
Conservative | Jayandra Patel | 1,697 | ||
Liberal Democrats | Erika Coward | 395 | 8.77 | |
Liberal Democrats | John Beales | 383 | ||
Liberal Democrats | David Loxton | 322 | ||
Registered electors | 10,125 | |||
Turnout | 4,647 | 45.90 | ||
Rejected ballots | 12 | 0.26 | ||
Labour hold | ||||
Labour hold | ||||
Labour hold | ||||
Party | Candidate | Votes | % | |
---|---|---|---|---|
Labour | Stanley Cross | 3,002 | 51.09 | |
Labour | Michael Harris* | 2,987 | ||
Labour | Dennis Reed* | 2,979 | ||
Conservative | Richard Evans | 2,899 | 48.91 | |
Conservative | Donald Taylor | 2,885 | ||
Conservative | Graham Old | 2,801 | ||
Registered electors | 11,590 | |||
Turnout | 6,344 | 54.74 | ||
Rejected ballots | 39 | 0.61 | ||
Labour hold | ||||
Labour hold | ||||
Labour hold | ||||
Elections to Southwark Council were held in May 1990. The whole council was up for election. Turnout was 40.54%.
The 1990 Camden Council election took place on 3 May 1990 to elect members of Camden London Borough Council in London, England. The whole council was up for election. Labour comfortably stayed in overall control of the council, despite the Conservatives gaining three seats at their expense in Swiss Cottage. The Green Party came third in vote share with 13% of the vote, but won no seats.
The 1990 Barking and Dagenham Borough Council election took place on 3 May 1990 to elect members of Barking and Dagenham London Borough Council in London, England. The whole council was up for election and the Labour Party stayed overwhelmingly in overall control of the council.
The 1990 Bexley Council election took place on 3 May 1990 to elect members of Bexley London Borough Council in London, England. The whole council was up for election and the Conservative Party stayed in overall control of the council.
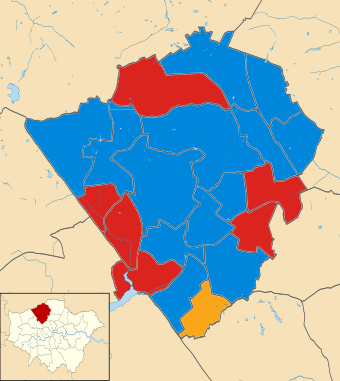
The 1990 Brent Council election took place on 3 May 1990 to elect members of Brent London Borough Council in London, England. The whole council was up for election and the council went in no overall control.
The 1990 Bromley Council election took place on 3 May 1990 to elect members of Bromley London Borough Council in London, England. The whole council was up for election and the Conservative party stayed in overall control of the council.
The 1990 Croydon Council election took place on 3 May 1990 to elect members of Croydon London Borough Council in London, England. The whole council was up for election and the Conservative party stayed in overall control of the council.
The 1990 Ealing Council election took place on 3 May 1990 to elect members of Ealing London Borough Council in London, England. The whole council was up for election and the Conservative party gained overall control of the council.
The 1990 Enfield Council election took place on 3 May 1990 to elect members of Enfield London Borough Council in London, England. The whole council was up for election and the Conservative party stayed in overall con89trol of the council.
The 1990 Greenwich Council election took place on 3 May 1990 to elect members of Greenwich London Borough Council in London, England. The whole council was up for election and the Labour party stayed in overall control of the council.
The 1990 Hackney Council election took place on 3 May 1990 to elect members of Hackney London Borough Council in London, England. The whole council was up for election and the council remained controlled by Labour.
The 1990 Hammersmith and Fulham Council election took place on 3 May 1990 to elect members of Hammersmith and Fulham London Borough Council in London, England. The whole council was up for election and the Labour party stayed in overall control of the council.
The 1990 Haringey Council election took place on 3 May 1990 to elect members of Haringey London Borough Council in London, England. The whole council was up for election and the Labour party stayed in overall control of the council.
The 1990 Havering Council election took place on 3 May 1990 to elect members of Havering London Borough Council in London, England. The whole council was up for election and the council stayed in no overall control.
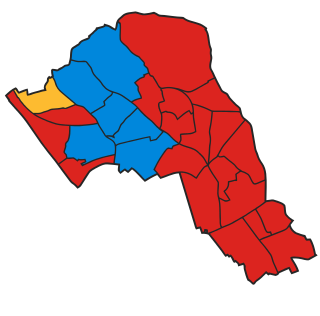
The 1990 Hillingdon Council election tooklace on 3 May 1990 to elect members of Hillingdon London Borough Council in London, Englaland. The whole council was up for election and the Conservative Party gained overall control of the council.
The 1990 Hounslow Council election took place on 3 May 1990 to elect members of Hounslow London Borough Council in London, England. The whole council was up for election and the Labour party stayed in overall control of the council.
The 1990 Kingston upon Thames Council election took place on 3 May 1990 to elect members of Kingston upon Thames London Borough Council in London, England. The whole council was up for election and the council stayed in no overall control.
The 1990 Richmond upon Thames Borough Council election took place on 3 May 1990 to elect members of Richmond upon Thames London Borough Council in London, England. The whole council was up for election and the Liberal Democrats stayed in overall control of the council.
The 1990 Sutton Council election took place on 3 May 1990 to elect members of Sutton London Borough Council in London, England. The whole council was up for election and the Liberal Democrats kept overall control of the council.
The 1990 Westminster Council election took place on 3 May 1990 to elect members of Westminster City Council in London, England. The whole council was up for election and the Conservative Party stayed in overall control of the council.