| |||||||||||||||||||||||||||||||||||||
All 52 council seats 27 seats needed for a majority | |||||||||||||||||||||||||||||||||||||
---|---|---|---|---|---|---|---|---|---|---|---|---|---|---|---|---|---|---|---|---|---|---|---|---|---|---|---|---|---|---|---|---|---|---|---|---|---|
Registered | 113,589 | ||||||||||||||||||||||||||||||||||||
Turnout | 43.9% | ||||||||||||||||||||||||||||||||||||
| |||||||||||||||||||||||||||||||||||||
|
The 1994 Islington Council election took place on 5 May 1994 to elect members of Islington London Borough Council in London, England. The whole council was up for election and the Labour party stayed in overall control of the council. [2]
This section is empty. You can help by adding to it. (March 2015) |
Party | Seats | Gains | Losses | Net gain/loss | Seats % | Votes % | Votes | +/− | |
---|---|---|---|---|---|---|---|---|---|
Labour | 39 | 0 | 8 | 8 | 75.00 | 52.49 | 63,475 | 0 | |
Liberal Democrats | 12 | 0 | 8 | 8 | 23.08 | 29.14 | 35,232 | 0 | |
Conservative | 1 | 0 | 0 | 1.92 | 12.47 | 15,083 | 0 | ||
Green | 0 | 0 | 0 | 0.00 | 3.06 | 3,697 | 0 | ||
Tenants and Residents | 0 | 0 | 0 | 0.00 | 2.17 | 2,624 | 0 | ||
Independents | 0 | 0 | 0 | 0.00 | 0.67 | 812 | 0 | ||
Total | 52 | 120,923 |
Prior to the election the composition of the council was: [3]
44 | 4 | 1 | 3 |
Labour | Lib Dem | Con | Vacant |
After the election the composition of the council was
39 | 12 | 1 |
Labour | Lib Dem | Con |
All percentages come from dividing the votes for every candidate of a single party by the total votes for every candidate, and are found in the official report for the 1994 election by the London Research Centre
Party | Candidate | Votes | % | ±% | |
---|---|---|---|---|---|
Labour | Winston J. Winston | 1,556 | 57.5 | {{{change}}} | |
Labour | Louisa J. Mallard | 1,555 | {{{change}}} | ||
Labour | Mark R. Stacey | 1,487 | {{{change}}} | ||
Liberal Democrats | Katherine F. Hall | 669 | 24.1 | ||
Liberal Democrats | Isobel J. Cox | 638 | |||
Liberal Democrats | Jonathan F. Wright | 617 | |||
Conservative | Aidan L. Langley | 505 | 18.4 | ||
Conservative | Charles J. Hoare | 494 | |||
Conservative | Martin R.C. Moyes | 472 | |||
Registered electors | 6,507 | ||||
Turnout | 2,869 | 44.09 | {{{change}}} | ||
Rejected ballots | 14 | 0.49 | |||
Labour hold | |||||
Labour hold | |||||
Labour hold | |||||
Party | Candidate | Votes | % | ±% | |
---|---|---|---|---|---|
Liberal Democrats | Joseph R. Trotter | 1,662 | 59.6 | {{{change}}} | |
Liberal Democrats | Rosetta E. Wooding | 1,537 | {{{change}}} | ||
Liberal Democrats | Ian L. Thorn | 1,495 | {{{change}}} | ||
Labour | Joan E. Herbert | 933 | 34.8 | ||
Labour | Terence J. Herbert | 924 | |||
Labour | Anne H.D. Gilman | 879 | |||
Conservative | Richard W. Edwards | 174 | 5.6 | ||
Conservative | Alam-Zeb Khan | 136 | |||
Conservative | Hugo H.F. Summerson | 130 | |||
Registered electors | 5,837 | ||||
Turnout | 2,804 | 48.04 | {{{change}}} | ||
Rejected ballots | 1 | 0.04 | |||
Liberal Democrats gain from Labour | |||||
Liberal Democrats gain from Labour |
Party | Candidate | Votes | % | ±% | |
---|---|---|---|---|---|
Labour | Andrew Bosi | 847 | 36.4 | {{{change}}} | |
Labour | James M.D. Purnell | 714 | {{{change}}} | ||
Tenants and Residents | Ernest J.W. Bayliss | 646 | 28.2 | {{{change}}} | |
Liberal Democrats | James A. Doyle | 595 | 22.9 | ||
Tenants and Residents | John E. Plummer | 564 | {{{change}}} | ||
Liberal Democrats | Jamshid Arfa | 387 | |||
Green | Susan Wilkinson | 135 | 6.3 | ||
Conservative | Alan Johnson | 90 | 3.7 | ||
Conservative | James A. Rooke | 68 | |||
Independent | Colin M. Dent | 54 | 2.5 | ||
Registered electors | 4,969 | ||||
Turnout | 2,249 | 45.26 | {{{change}}} | ||
Rejected ballots | 4 | 0.18 | |||
Labour hold | |||||
Labour hold | |||||
Party | Candidate | Votes | % | ±% | |
---|---|---|---|---|---|
Labour | Caroline L. Baggs | 878 | 50.2 | {{{change}}} | |
Labour | Thomas J. Simpson | 875 | {{{change}}} | ||
Conservative | John E. Cable | 429 | 23.9 | ||
Conservative | Margaret D. Reese | 405 | |||
Liberal Democrats | Gerald Sattin | 350 | 19.4 | ||
Liberal Democrats | John Tasker | 326 | |||
Green | Adrian R. Williams | 113 | 6.3 | ||
Registered electors | 4,182 | ||||
Turnout | 1,824 | 43.62 | {{{change}}} | ||
Rejected ballots | 4 | 0.22 | |||
Labour hold | |||||
Labour hold | |||||
Party | Candidate | Votes | % | ±% | |
---|---|---|---|---|---|
Liberal Democrats | Sarah A. Ludford | 2,213 | 59.1 | {{{change}}} | |
Liberal Democrats | Bruce G. Neave | 1,952 | {{{change}}} | ||
Liberal Democrats | David V. Tibbs | 1,805 | {{{change}}} | ||
Labour | Joseph Harris | 936 | 26.9 | ||
Labour | Valda L. James | 913 | |||
Labour | Piers M. Herbert | 871 | |||
Tenants and Residents | Eileen E. O'Keefe | 362 | 10.0 | {{{change}}} | |
Tenants and Residents | Helen | 315 | {{{change}}} | ||
Conservative | Jane C. Langley | 136 | 3.9 | ||
Conservative | Mark Eldridge | 135 | |||
Conservative | Reginald H. Brown | 128 | |||
Registered electors | 7,267 | ||||
Turnout | 3,474 | 47.81 | {{{change}}} | ||
Rejected ballots | 13 | 0.37 | |||
Liberal Democrats gain from Labour | |||||
Liberal Democrats hold | |||||
Party | Candidate | Votes | % | ±% | |
---|---|---|---|---|---|
Labour | Jenette Golding | 1,138 | 65.2 | {{{change}}} | |
Labour | Richard Greening | 1,104 | {{{change}}} | ||
Liberal Democrats | Philip D. Middleton | 257 | 13.4 | ||
Green | Sara Meidan | 208 | 12.1 | ||
Liberal Democrats | Philip G. Moss | 205 | |||
Conservative | Anthony N. Williamson | 171 | 9.2 | ||
Conservative | Mahendra Oza | 146 | |||
Registered electors | 4,018 | ||||
Turnout | 1,721 | 42.83 | {{{change}}} | ||
Rejected ballots | 5 | 0.29 | |||
Labour hold | |||||
Labour hold | |||||
Party | Candidate | Votes | % | ±% | |
---|---|---|---|---|---|
Labour | Stewart Cross | 1,318 | 43.6 | {{{change}}} | |
Labour | Milton K. Babulall | 1,213 | {{{change}}} | ||
Labour | Ansar J. Khan | 1,182 | {{{change}}} | ||
Green | Christopher Ashby | 759 | 26.7 | ||
Liberal Democrats | Bridget C. Fox | 399 | 12.6 | ||
Liberal Democrats | Nicholas Carlisle | 381 | |||
Tenants and Residents | Edward G. Beford | 349 | 8.6 | {{{change}}} | |
Liberal Democrats | Nigel J. Grinyer | 297 | |||
Conservative | Caroline R. Blackwood | 266 | 8.5 | ||
Conservative | Simon R. Matthews | 234 | |||
Conservative | Nicholas P. Canty | 221 | |||
Tenants and Residents | William A. Maffrett | 214 | {{{change}}} | ||
Tenants and Residents | Daniel McMillan | 174 | {{{change}}} | ||
Registered electors | 6,255 | ||||
Turnout | 2,572 | 41.12 | {{{change}}} | ||
Rejected ballots | 4 | 0.16 | |||
Labour hold | |||||
Labour hold | |||||
Labour hold | |||||
Party | Candidate | Votes | % | ±% | |
---|---|---|---|---|---|
Labour | Maureen Leigh | 1,077 | 69.6 | {{{change}}} | |
Labour | Robert A. Mowle | 967 | {{{change}}} | ||
Conservative | Theresa J. Aldis | 160 | 10.2 | ||
Green | Timothy S. Weekes | 150 | 10.2 | ||
Liberal Democrats | Michael J.R. Verrier | 148 | 9.9 | ||
Liberal Democrats | Sheila Verrier | 144 | |||
Conservative | Barry J. Gibbs | 140 | |||
Registered electors | 3,753 | ||||
Turnout | 1,516 | 40.39 | {{{change}}} | ||
Rejected ballots | 8 | 0.53 | |||
Labour hold | |||||
Labour hold | |||||
Party | Candidate | Votes | % | ±% | |
---|---|---|---|---|---|
Labour | Arthur L. Bell | 1,317 | 65.2 | {{{change}}} | |
Labour | Philip J. Kelly | 1,237 | {{{change}}} | ||
Liberal Democrats | Tim Johnson | 410 | 19.9 | ||
Liberal Democrats | Martin Case-Jones | 369 | |||
Conservative | Martin O. Hutchinson | 295 | 14.9 | ||
Conservative | Roy P.C. Taft | 288 | |||
Registered electors | 5,135 | ||||
Turnout | 2,085 | 40.60 | {{{change}}} | ||
Rejected ballots | 4 | 0.19 | |||
Labour hold | |||||
Labour hold | |||||
Party | Candidate | Votes | % | ±% | |
---|---|---|---|---|---|
Labour | Alan M. Clinton | 1,631 | 62.0 | {{{change}}} | |
Labour | John J. Burke | 1,591 | {{{change}}} | ||
Labour | Ruth N. Steigman | 1,378 | {{{change}}} | ||
Liberal Democrats | Penelope A. Aitken | 436 | 15.1 | ||
Liberal Democrats | Heather Eggins | 372 | |||
Liberal Democrats | James R.K. Upson | 312 | |||
Green | Judith E. Kleinman | 232 | 9.4 | ||
Conservative | Neil P. Taylor | 202 | 7.9 | ||
Conservative | Oriel S. Hutchinson | 195 | |||
Conservative | Jennifer Moody | 189 | |||
Residents Association | Derrick E. Heath | 140 | 5.7 | {{{change}}} | |
Registered electors | 6,324 | ||||
Turnout | 2,419 | 38.25 | {{{change}}} | ||
Rejected ballots | 6 | 0.25 | |||
Labour hold | |||||
Labour hold | |||||
Labour hold | |||||
Party | Candidate | Votes | % | ±% | |
---|---|---|---|---|---|
Liberal Democrats | Margot J. Dunn | 1,493 | 48.2 | {{{change}}} | |
Liberal Democrats | Douglas A. Taylor | 1,344 | {{{change}}} | ||
Liberal Democrats | Barry J. Kempton | 1,316 | {{{change}}} | ||
Labour | Edna Griffiths | 1,236 | 42.8 | ||
Labour | Sheila A. Camp | 1,235 | |||
Labour | Leo J.C. McKinstry | 1,210 | |||
Green | Charmaine S. Charrier | 146 | 5.1 | ||
Conservative | Evelyn Johnson | 135 | 3.9 | ||
Conservative | Alan J.M. Reese | 107 | |||
Conservative | Mark A.H. Rittner | 96 | |||
Registered electors | 6,055 | ||||
Turnout | 2,998 | 49.51 | {{{change}}} | ||
Rejected ballots | 3 | 0.10 | |||
Liberal Democrats gain from Labour | |||||
Liberal Democrats gain from Labour |
Party | Candidate | Votes | % | ±% | |
---|---|---|---|---|---|
Labour | Sandra Marks | 1,656 | 62.4 | {{{change}}} | |
Labour | Taha T. Karim | 1,630 | {{{change}}} | ||
Labour | Tal Michael | 1,497 | {{{change}}} | ||
Liberal Democrats | Jane Little | 415 | 14.0 | ||
Liberal Democrats | Pauline M. Callow | 355 | |||
Green | Angela Royston | 338 | 13.2 | ||
Liberal Democrats | Alford T. Reeves | 300 | |||
Conservative | Victoria H.C. Lloyd | 280 | 10.5 | ||
Conservative | Anthea D. Ward | 268 | |||
Conservative | Edward J. Scilloe | 255 | |||
Registered electors | 6,488 | ||||
Turnout | 2,584 | 39.83 | {{{change}}} | ||
Rejected ballots | 12 | 0.46 | |||
Labour hold | |||||
Labour hold | |||||
Labour hold | |||||
Party | Candidate | Votes | % | ±% | |
---|---|---|---|---|---|
Labour | Patrick E. Haynes | 1,595 | 51.7 | {{{change}}} | |
Labour | Michael Boye-Anawomah | 1,468 | {{{change}}} | ||
Labour | Neil S. Mercer | 1,438 | {{{change}}} | ||
Conservative | Simon N. Cooper | 674 | 22.8 | ||
Conservative | David M. Evans | 669 | |||
Conservative | Jose M. Chans | 647 | |||
Liberal Democrats | Anna Berent | 423 | 13.4 | ||
Liberal Democrats | Derek R. Jackson | 404 | |||
Green | Karen S. Stack | 352 | 12.1 | ||
Liberal Democrats | Adam A.R. Macgill | 338 | |||
Registered electors | 7,589 | ||||
Turnout | 2,914 | 38.40 | {{{change}}} | ||
Rejected ballots | 7 | 0.24 | |||
Labour hold | |||||
Labour hold | |||||
Labour hold | |||||
Party | Candidate | Votes | % | ±% | |
---|---|---|---|---|---|
Conservative | Clive D. Blackwood | 1,218 | 44.3 | {{{change}}} | |
Labour | David P. Barnes | 1,095 | 42.5 | {{{change}}} | |
Labour | Jennifer M. Sands | 1,027 | |||
Conservative | Christopher J. Pincher | 992 | |||
Liberal Democrats | Elizabeth J. Rorison | 182 | 6.9 | ||
Liberal Democrats | Raymond C. James | 160 | |||
Green | John H. Ackers | 159 | 6.4 | ||
Registered electors | 5,099 | ||||
Turnout | 2,573 | 50.46 | {{{change}}} | ||
Rejected ballots | 9 | 0.35 | |||
Conservative hold | |||||
Labour hold | |||||
Party | Candidate | Votes | % | ±% | |
---|---|---|---|---|---|
Labour | Peter D. Chalk | 1,528 | 49.5 | {{{change}}} | |
Labour | Claire R.J. Gontier | 1,402 | {{{change}}} | ||
Labour | Paul Munim | 1,207 | {{{change}}} | ||
Liberal Democrats | Andrew Adonis | 424 | 12.6 | ||
Independent | John F. Gallagher | 399 | 14.3 | ||
Green | Mary H. Adshead | 363 | 13.0 | ||
Liberal Democrats | Helen J.L. Thorn | 327 | |||
Conservative | Andrew J. McHallam | 316 | 10.5 | ||
Liberal Democrats | Hilary M. Nimmo | 305 | |||
Conservative | Rifat Bairam | 294 | |||
Conservative | Charles J.R. Sharman | 270 | |||
Registered electors | 6,621 | ||||
Turnout | 2,574 | 38.88 | {{{change}}} | ||
Rejected ballots | 3 | 0.12 | |||
Labour hold | |||||
Labour hold | |||||
Labour hold | |||||
Party | Candidate | Votes | % | ±% | |
---|---|---|---|---|---|
Labour | Paul A. Jackson | 1,195 | 52.2 | {{{change}}} | |
Labour | Clare E. Jeapes | 1,184 | {{{change}}} | ||
Labour | Paul E. Convery | 1,171 | {{{change}}} | ||
Conservative | Tracey A. Braddick | 528 | 22.4 | ||
Conservative | Alexandra C. Eldridge | 500 | |||
Conservative | Claire H. Denison | 498 | |||
Liberal Democrats | Nicola-Jane Taylor | 421 | 17.3 | ||
Liberal Democrats | David T. Sterrett | 383 | |||
Liberal Democrats | Sidney T. Kimbrough | 374 | |||
Green | Jeremy R. Monson | 184 | 8.1 | ||
Registered electors | 5,362 | ||||
Turnout | 2,336 | 43.57 | {{{change}}} | ||
Rejected ballots | 6 | 0.26 | |||
Labour hold | |||||
Labour hold | |||||
Labour hold | |||||
Party | Candidate | Votes | % | ±% | |
---|---|---|---|---|---|
Liberal Democrats | Maria Powell | 1,891 | 62.1 | {{{change}}} | |
Liberal Democrats | Stephen Hitchins | 1,826 | {{{change}}} | ||
Liberal Democrats | Christopher J. Pryce | 1,807 | {{{change}}} | ||
Labour | Lloyd G.T. Child | 1,028 | 33.3 | ||
Labour | Doreen Prichard | 969 | |||
Labour | Carol A Rawlings | 966 | |||
Conservative | Thomas R.M. Duke | 156 | 4.5 | ||
Conservative | Stephen M. McMinnies | 128 | |||
Conservative | Barry F. Mason | 119 | |||
Registered electors | 6.407 | ||||
Turnout | 3,129 | 48.84 | {{{change}}} | ||
Rejected ballots | 7 | 0.22 | |||
Liberal Democrats hold | |||||
Party | Candidate | Votes | % | ±% | |
---|---|---|---|---|---|
Labour | Meg Hiller | 1,160 | 57.0 | {{{change}}} | |
Labour | Stephen Twigg | 1,156 | {{{change}}} | ||
Liberal Democrats | Matthew T.M. Ryan | 671 | 32.1 | ||
Liberal Democrats | Sylvia A. Keenan | 634 | |||
Green | Paul j. Ward | 127 | 6.2 | ||
Conservative | Juliet Blick | 103 | 4.7 | ||
Conservative | Nigel V.A. Shervey | 86 | |||
Registered electors | 4,395 | ||||
Turnout | 2,123 | 48.31 | {{{change}}} | ||
Rejected ballots | 8 | 0.38 | |||
Labour hold | |||||
Labour hold | |||||
Party | Candidate | Votes | % | ±% | |
---|---|---|---|---|---|
Labour | Ian P. Perry | 1,140 | 63.6 | {{{change}}} | |
Labour | Alan J. Laws | 1,132 | {{{change}}} | ||
Liberal Democrats | Patricia M. Peel | 319 | 16.4 | ||
Liberal Democrats | Neil A. Buckley | 268 | |||
Conservative | Richard Campbell | 259 | 12.5 | ||
Conservative | David M. Pittaway | 189 | |||
Green | Robin W. Latimer | 133 | 7.4 | ||
Registered electors | 4,489 | ||||
Turnout | 1,913 | 42.62 | {{{change}}} | ||
Rejected ballots | 6 | 0.31 | |||
Labour hold | |||||
Labour hold | |||||
Party | Candidate | Votes | % | ±% | |
---|---|---|---|---|---|
Labour | Elizabeth M. Davies | 1,644 | 58.2 | {{{change}}} | |
Labour | Roger A. McKenzie | 1,606 | {{{change}}} | ||
Labour | Derek A. Sawyer | 1,379 | {{{change}}} | ||
Independent | Michael J. Rosenbaum | 354 | 13.4 | ||
Liberal Democrats | Charles P. Cohen | 353 | 11.0 | ||
Liberal Democrats | Elizabeth J.F. Mayer | 314 | |||
Green | Judith Benli | 298 | 11.2 | ||
Liberal Democrats | Mark C. Thatcher | 209 | |||
Conservative | Raymond L.J. Muggeridge | 192 | 6.1 | ||
Conservative | Joseph D. Owino | 151 | |||
Conservative | Allan j. Saile | 144 | |||
Registered electors | 6,837 | ||||
Turnout | 2,531 | 37.02 | {{{change}}} | ||
Rejected ballots | 8 | 0.32 | |||
Labour hold | |||||
Labour hold | |||||
Labour hold | |||||
Eileen Gordon is a former Labour Member of Parliament in the United Kingdom, who represented Romford from 1997 to 2001.
Islington South and Finsbury is a constituency created in 1974 and represented in the House of Commons of the UK Parliament since 2005 by Emily Thornberry of the Labour Party. Thornberry served as Shadow Foreign Secretary from 2016 until 2020 and is currently Shadow Attorney General for England and Wales.
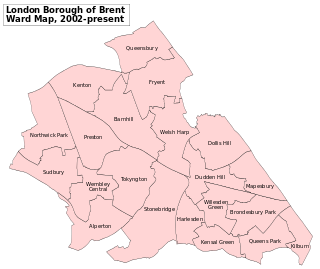
Brent London Borough Council in London, England is elected every four years. Since the last boundary changes in 2022 the council has comprised 57 councillors representing 22 wards, with each ward electing two or three councillors.
The 1994 United Kingdom local elections were held on Thursday 5 May 1994. The results showed a continued decline for the governing Conservatives — who were now in their 15th successive year of government at Westminster — with the third-placed party, the Liberal Democrats, as the main beneficiaries.
The 2002 Islington Council election took place on 2 May 2002 to elect members of Islington London Borough Council in London, England. The whole council was up for election with boundary changes since the last election in 1998 reducing the number of seats by 4. The Liberal Democrats stayed in overall control of the council.
The 2014 Enfield Council election took place on 22 May 2014 to elect members of Enfield London Borough Council in London, England. The whole council was up for election and the Labour party retained overall control of the council, increasing their majority over the Conservative party by five seats.
The 2014 Havant Borough Council election took place on 22 May 2014 to elect members of Havant Borough Council in Hampshire, England. One third of the council was up for election and the Conservative Party stayed in overall control of the council.
The 1964 Islington Council election took place on 7 May 1964 to elect members of Islington London Borough Council in London, England. The whole council was up for election and the Labour party gained control of the council.
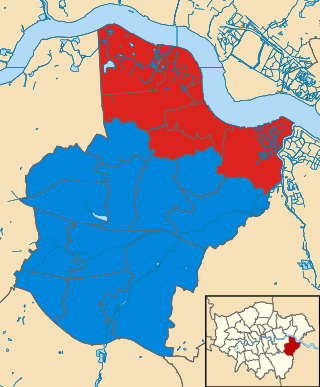
The 1994 Hammersmith and Fulham Borough Council election took place on 5 May 1994 to elect members of Hammersmith and Fulham London Borough Council in London, England. The whole council was up for election and the Labour Party regained overall control of the council, which it had lost during the previous council term.
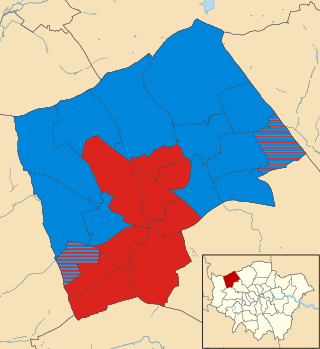
Elections for the London Borough of Merton were held on 5 May 1994 to elect members of Merton London Borough Council in London, England. This was on the same day as other local elections in England.
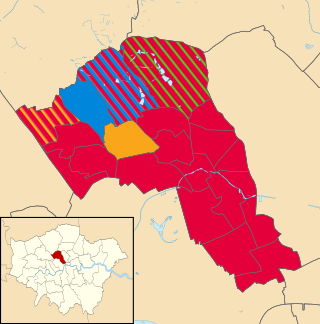
The 1994 Sutton Council election took place on 5 May 1994 to elect members of Sutton London Borough Council in London, England. The whole council was up for election and the Liberal Democrats stayed in overall control of the council.
The 2022 London local elections took place on 5 May 2022, as part of the 2022 United Kingdom local elections. All London borough councillor seats were up for election. Mayoral elections took place in Hackney, Lewisham, Newham and Tower Hamlets, with Croydon electing a mayor for the first time following a local referendum in October 2021.
The 2022 Barnet London Borough Council election took place on 5 May 2022, alongside local elections in the other London boroughs and elections to local authorities across the United Kingdom. All 63 members of Barnet London Borough Council were elected. The Labour Party took overall control, winning 41 of the seats to the Conservative Party's 22. This was the first time Labour had won the council outright; previously, the Conservatives had always won the most seats, usually with an overall majority.
The 2022 Bexley London Borough Council election took place on 5 May 2022. 45 members of Bexley London Borough Council were elected. The elections took place alongside local elections in the other London boroughs and elections to local authorities across the United Kingdom.
The 2022 Camden London Borough Council election took place on 5 May 2022. All 55 members of Camden London Borough Council were elected. The elections took place alongside local elections in the other London boroughs and elections to local authorities across the United Kingdom.
The 2022 Hackney London Borough Council election took place on 5 May 2022. All 57 members of Hackney London Borough Council were up for election. The elections took place alongside the election for the mayor of Hackney, local elections in the other London boroughs, and elections to local authorities across the United Kingdom.
The 2022 Harrow London Borough Council election took place on 5 May 2022. All 55 members of Harrow London Borough Council were elected. The elections took place alongside local elections in the other London boroughs and elections to local authorities across the United Kingdom.
The 2022 Islington London Borough Council election took place on 5 May 2022. All 51 members of Islington London Borough Council were to be elected. The elections took place alongside local elections in the other London boroughs and elections to local authorities across the United Kingdom.
Elections for the London Borough of Merton were held on 5 May 2022 to elect all 57 members of Merton London Borough Council in England. The elections took place alongside local elections in the other London boroughs and elections to local authorities across the United Kingdom.
The 2022 Waltham Forest London Borough Council election was on 5 May 2022. All 60 members of Waltham Forest London Borough Council were elected. The elections took place alongside local elections in the other London boroughs and elections to local authorities across the United Kingdom. the Labour Party maintained its control of the council, winning 47 out of the 60 seats with the Conservative Party forming the council opposition with the remaining 13 seats.