1994 Southwark London Borough Council election

Last updated

1994 Southwark London Borough Council election
Flag of Greater London.svg
  1990 5 May 1994 (1994-05-05) 1998  

All 64 seats up for election to Southwark London Borough Council
33 seats needed for a majority
Registered176,850 [1]
Turnout66,373, 37.53% [1] (Decrease2.svg 3.01)
 First partySecond partyThird party
  No image wide.svg No image wide.svg No image wide.svg
LeaderJeremy S. FraserUnknownUnknown
Party Labour Liberal Democrats Conservative
Leader since1993UnknownUnknown
Leader's seat Newington UnknownUnknown
Last election37 seats, 49.89%21 seats, 26.29%6 seats, 20.41%
Seats before37216
Seats won34273
Seat changeDecrease2.svg 3Increase2.svg 6Decrease2.svg 3
Popular vote75,94462,54320,074
Percentage47.56%39.16%12.57%
SwingDecrease2.svg 2.33Increase2.svg 12.87Decrease2.svg 7.84

Council Control before election


Labour

Council Control


Labour

Elections to Southwark Council were held on 5 May 1994, on the same day as other local elections happening around the country. The whole council was up for election. Turnout was 37.53%.

Contents

Election results

1994 Southwark London Borough Council election seat result.svg

Southwark Local Election Result 1994 [2] [3]
PartySeatsGainsLossesNet gain/lossSeats %Votes %Votes+/−
  Labour 3436Decrease2.svg 353.1347.5675,944Decrease2.svg 2.33
  Liberal Democrats 2760Increase2.svg 642.1939.1662,543Increase2.svg12.87
  Conservative 303Decrease2.svg34.6912.5720,074Decrease2.svg 7.84
  Militant Labour 000Steady2.svg0.000.30482New
  Green 000Steady2.svg0.000.26410Decrease2.svg 1.74
  Independent 000Steady2.svg0.000.0699New
  Communist 000Steady2.svg0.000.0688Steady2.svg
  Third Way 000Steady2.svg00.0353New
Total64 159,693

Despite losing 3 net seats, Labour remained in control of the council with a 2 seat majority.

Ward results

(*) - Indicates an incumbent candidate

(†) - Indicates an incumbent candidate standing in a different ward

Abbey

Abbey (2) [2] [3]
PartyCandidateVotes%±%
Liberal Democrats Alan S. Blake* 1,252 67.78 Increase2.svg13.93
Liberal Democrats Steven H. Gauge* 1,188
Labour John D. Johnson [n 1] 49226.72Decrease2.svg13.43
Labour Richard J. Livingstone470
Third WayFrederick C.T. Gerrens532.94New
Conservative Philip Hammond 522.56Decrease2.svg 3.44
Conservative Jon D. van der Walt40
Registered electors 4,817Decrease2.svg 18
Turnout 1,87538.92Increase2.svg 2.13
Rejected ballots00.00Decrease2.svg 0.28
Liberal Democrats hold

Alleyn

Alleyn (2) [2] [3]
PartyCandidateVotes%±%
Labour Cecile V. Lothian* 1,175 58.78 Increase2.svg 9.18
Labour Harry Canagasabey 1,126
Conservative Percy Gray43322.06Decrease2.svg 9.98
Conservative William P. Rowe430
Liberal Democrats Shirley P. Theiner37919.15Increase2.svg10.92
Liberal Democrats John J. Egan370
Registered electors 5,704Increase2.svg 97
Turnout 2,11137.01Decrease2.svg 5.95
Rejected ballots00.00Decrease2.svg 0.25
Labour hold
Labour hold

Barset

Barset (2) [2] [3]
PartyCandidateVotes%±%
Labour Christine D. Claridge 1,158 70.91 Decrease2.svg 6.95
Labour Svetlana Kirov 1,049
Liberal Democrats Deborah M. Jones29418.62New
Liberal Democrats David Ramsey286
Conservative Gladys Cobley16410.47Decrease2.svg11.67
Conservative Roy Taylor161
Registered electors 4,789Decrease2.svg 65
Turnout 1,57332.85Increase2.svg 0.13
Rejected ballots60.38Decrease2.svg 0.56
Labour hold
Labour hold

Bellenden

Bellenden (3) [2] [3]
PartyCandidateVotes%±%
Labour Howard A. Latham 2,080 68.07 Increase2.svg11.37
Labour Mike Lee 2,044
Labour Anne V. Worsley 1,971
Liberal Democrats Alexander Baker63017.89Increase2.svg 9.46
Liberal Democrats Robert J. Elbert487
Liberal Democrats Frank J. Brean486
Conservative Miranda Hardie46414.04Decrease2.svg 4.05
Conservative Angus J.C. Pritchard-Gordon404
Conservative Sharon F. Spiers388
Registered electors 8,537Decrease2.svg 150
Turnout 3,27238.33Decrease2.svg 1.72
Rejected ballots40.12Decrease2.svg 0.11
Labour hold
Labour hold
Labour hold

Bricklayers

Bricklayers (2) [2] [3]
PartyCandidateVotes%±%
Liberal Democrats Graham Nash* 1,754 69.81 Increase2.svg 6.46
Liberal Democrats Anne Scovell* 1,677
Labour Robert J. Cornall63625.63Decrease2.svg 5.45
Labour Rosemary L. Whitlock623
Conservative John A. Williams1184.56Decrease2.svg 1.01
Conservative Susan C. Hammond105
Registered electors 6,791Increase2.svg 704
Turnout 2,62238.61Decrease2.svg 6.24
Rejected ballots40.15Decrease2.svg 0.03
Liberal Democrats hold

Browning

Browning (3) [2] [3]
PartyCandidateVotes%±%
Liberal Democrats Geoffrey M.A. Goldie* 1,582 60.70 Increase2.svg 3.61
Liberal Democrats Paul Cheesman* 1,574
Liberal Democrats James R. Munday 1,566
Labour Martin K. Green92434.44Decrease2.svg 2.61
Labour Peter S. Hore885
Labour Michael F. Yates869
Conservative Elizabeth E. Buckland1374.86Decrease2.svg 1.00
Conservative Alan Sheridan133
Conservative Lilian M. Prince107
Registered electors 7,953Increase2.svg 463
Turnout 2,60032.69Decrease2.svg 5.15
Rejected ballots110.42Increase2.svg 0.21
Liberal Democrats hold

Brunswick

Brunswick (3) [2] [3]
PartyCandidateVotes%±%
Labour Ian D. Driver* 1,482 65.92 Decrease2.svg 6.83
Labour Lilian V. Naish* 1,427
Labour John J. Friary 1,413
Liberal Democrats Vivien D. Maurice* [n 2] 62627.63New
Liberal Democrats Philip J. Bonnington617
Liberal Democrats Wendy E. O'Dowd568
Conservative Anna-Louise McKinney1546.45Decrease2.svg16.29
Conservative Douglas J. Mitchell142
Conservative Douglas Pearce128
Registered electors 7,665Increase2.svg 291
Turnout 2,42731.66Decrease2.svg 0.37
Rejected ballots50.21Decrease2.svg 0.51
Labour hold
Labour gain from Liberal Democrats
Labour hold

Burgess

Burgess (2) [2] [3]
PartyCandidateVotes%±%
Liberal Democrats Rose E. Colley* 887 52.45 Decrease2.svg 6.15
Liberal Democrats Eileen J. Neale 782
Labour Simon J. McKeown70343.78Increase2.svg 5.73
Labour Josephine E. Clark [n 3] 690
Conservative Christina A. Coyle733.77Increase2.svg 0.42
Conservative Roger G. Prince47
Registered electors 4,565Increase2.svg 226
Turnout 1,67136.60Decrease2.svg 3.96
Rejected ballots90.54Increase2.svg 0.26
Liberal Democrats hold

Cathedral

Cathedral (2) [2] [3]
PartyCandidateVotes%±%
Liberal Democrats Hilary Wines* 1,604 76.00 Increase2.svg15.03
Liberal Democrats Richard Shearman* 1,442
Labour Robert Smeath41219.31Decrease2.svg12.24
Labour Nicola Kutapan361
Conservative Susan Hardy733.14Decrease2.svg 4.34
Conservative Peter Randall Johnson53
Communist Marcella Fitzgerald311.54New
Registered electors 5,148Decrease2.svg 267
Turnout 2,14741.71Increase2.svg 0.16
Rejected ballots60.28Decrease2.svg 0.30
Liberal Democrats hold

Chaucer

Chaucer (3) [2] [3]
PartyCandidateVotes%±%
Liberal Democrats Robert A. Bayne 1,461 47.54 Increase2.svg 4.89
Liberal Democrats Jennifer Thompson 1,415
Labour Stephan D.O. Lancashire 1,410 46.07 Increase2.svg 2.75
Liberal Democrats David C. Buxton [n 4] 1,404
Labour Matt Tee1,375
Labour Rebecca Tee1,363
Conservative Ann E. Buckland1704.50Decrease2.svg 0.66
Conservative Lorraine A. Sheridan125
Conservative Charles C. Hayward110
Communist Joyce Fairchild571.90New
Registered electors 8,264Increase2.svg 296
Turnout 3,21538.90Increase2.svg 1.93
Rejected ballots00.00Decrease2.svg 0.10
Liberal Democrats hold
Liberal Democrats gain from Labour
Labour hold

College

College (2) [2] [3]
PartyCandidateVotes%±%
Conservative Mark E.K. Humphreys 1,202 41.25 Decrease2.svg 9.66
Conservative Stephen P. Charge [n 5] 1,124
Labour Sara E. Ives94732.39Decrease2.svg 4.13
Labour Alan Sharples878
Liberal Democrats Patricia M. Mynott75226.36Increase2.svg13.79
Liberal Democrats Jonathan S. Price733
Registered electors 6,121Increase2.svg 32
Turnout 2,93147.88Decrease2.svg 3.97
Rejected ballots20.07Decrease2.svg 0.12
Conservative hold
Conservative hold

Consort

Consort (2) [2] [3]
PartyCandidateVotes%±%
Labour Ian Ritchie 1,040 64.91 Decrease2.svg10.54
Labour Hassan Vahib [n 6] 858
Liberal Democrats Jacqueline E. Tomkins35623.46New
Liberal Democrats Graham Salt329
Conservative Leslie N. Brown19811.63Decrease2.svg12.92
Conservative Edmund Franc141
Registered electors 5,126Decrease2.svg 28
Turnout 1,61831.56Decrease2.svg 3.91
Rejected ballots100.62Decrease2.svg 0.15
Labour hold
Labour hold

Dockyard

Dockyard (3) [2] [3]
PartyCandidateVotes%±%
Liberal Democrats Nicholas Baar 2,650 68.45 Increase2.svg20.20
Liberal Democrats Elizabeth Denton* 2,634
Liberal Democrats Derek W. Partridge 2,479
Labour Benjamin H. Marshall1,00225.57Decrease2.svg 7.43
Labour Aveen E. McHugh996
Labour Lindsay N.P. Thomas902
Conservative Stephen C. Holmes2735.98Decrease2.svg12.77
Conservative Anne Peirce213
Conservative Mark J.R. Tunstill192
Registered electors 11,939Increase2.svg3,024
Turnout 4,14134.68Decrease2.svg 8.79
Rejected ballots120.29Increase2.svg 0.01
Liberal Democrats hold

Faraday

Faraday (3) [2] [3]
PartyCandidateVotes%±%
Liberal Democrats Ruth K. Clark 1,762 49.83 Increase2.svg21.09
Liberal Democrats Alfred C. Langley 1,735
Liberal Democrats Donnachadh McCarthy 1,719
Labour Charles Cherrill*1,58844.35Decrease2.svg13.16
Labour John J. Lauder*1,529
Labour Lorraine Lauder1,527
Conservative Robert A. Hayward 2075.82Decrease2.svg 7.93
Conservative Lucy M. Newmark205
Conservative Jennifer J. Handscomb197
Registered electors 9,531Increase2.svg 168
Turnout 3,80439.91Increase2.svg 7.71
Rejected ballots130.34Increase2.svg 0.21
Liberal Democrats gain from Labour

Friary

Friary (3) [2] [3]
PartyCandidateVotes%±%
Labour Linda Bailey 1,086 52.99 Increase2.svg 2.80
Labour Joan C. Khachik 972
Labour Sonya J.H. Murison [n 7] 968
Liberal Democrats Christopher J. Berry82841.18Increase2.svg35.12
Liberal Democrats Rand J. Guebert763
Liberal Democrats Jonathan N. Hunt761
Conservative Ivy A. Brown1295.83Decrease2.svg 5.17
Conservative May Beaumont104
Conservative Nicola A. Eldridge101
Registered electors 6,332Decrease2.svg 81
Turnout 2,10633.26Decrease2.svg 2.56
Rejected ballots50.24Decrease2.svg 0.37
Labour hold
Labour hold
Labour hold

Liddle

Liddle (3) [2] [3]
PartyCandidateVotes%±%
Labour Mary Ellery* 1,315 74.22 Decrease2.svg13.81
Labour Daniel McCarthy* 1,191
Labour Abdur-Rahman O. Olayiwola 1,111
Liberal Democrats David Banks22612.61New
Liberal Democrats John Landels205
Liberal Democrats Rachel Ogunsanya183
Green Jennifer H. Wilson1197.32New
Conservative Dennis Herbert1105.85Decrease2.svg 6.12
Conservative Vassos Christodoulou79
Registered electors 8,526Increase2.svg 39
Turnout 1,72020.17Decrease2.svg 2.06
Rejected ballots40.23Decrease2.svg 0.81
Labour hold
Labour hold
Labour hold

Lyndhurst

Lyndhurst (3) [2] [3]
PartyCandidateVotes%±%
Labour Aubyn Graham* 1,933 62.59 Increase2.svg13.83
Labour Dermot McInerney 1,881
Labour Nick Dolezal 1,878
Liberal Democrats Alistair Milne60319.23Increase2.svg 9.41
Liberal Democrats Paul Heatley591
Conservative Eleanor Gayler56518.18Decrease2.svg10.38
Conservative Olga Grant556
Liberal Democrats Richard Newby 556
Conservative Doris Pearce533
Registered electors 8,647Decrease2.svg 133
Turnout 3,27837.91Decrease2.svg 1.82
Rejected ballots80.24Increase2.svg 0.15
Labour hold
Labour hold
Labour hold

Newington

Newington (3) [2] [3]
PartyCandidateVotes%±%
Labour Jeremy S. Fraser* 1,876 60.64 Increase2.svg 0.37
Labour Hannah J. McDonald 1,764
Labour Robert I. Wingfield [n 8] 1,642
Liberal Democrats Gillian I. Clemens91629.89Increase2.svg18.66
Liberal Democrats Ann Christmas904
Liberal Democrats Sarah M. Gurling783
Conservative Philip M. Dixon2939.47Decrease2.svg 7.68
Conservative Felicity E. Malyon271
Conservative Richard J. Malyon262
Registered electors 8,902Increase2.svg 127
Turnout 3,24036.40Decrease2.svg 3.16
Rejected ballots110.34Increase2.svg 0.14
Labour hold
Labour hold
Labour hold

Riverside

Riverside (3) [2] [3]
PartyCandidateVotes%±%
Liberal Democrats George H. Dunk* 1,461 54.33 Increase2.svg 3.89
Liberal Democrats Betty Olliffe 1,374
Liberal Democrats Linda Manchester 1,326
Labour Coral A. Newell1,00236.74Decrease2.svg 3.99
Labour Charles A. Sawer926
Labour John T. Howard885
Conservative Robert G. Hughes3648.93Increase2.svg 0.10
Conservative Jacqueline L. Newbury165
Conservative William Woods154
Registered electors 7,473Increase2.svg 726
Turnout 2,90138.82Decrease2.svg 3.85
Rejected ballots80.28Increase2.svg 0.14
Liberal Democrats hold

Rotherhithe

Rotherhithe (3) [2] [3]
PartyCandidateVotes%±%
Liberal Democrats Frank Pemberton* 1,537 67.39 Increase2.svg 3.19
Liberal Democrats Victor D. Jones* 1,480
Liberal Democrats Jacqueline E. Bassom* 1,454
Labour David C. Brasier53621.66Decrease2.svg 3.38
Labour William J.R. Griffiths497
Labour Carl A. Upsall403
Militant Labour Joan Francis1687.28New
Militant Labour Lynn Kelly159
Militant Labour Julie Donovan155
Conservative Joyce S. Coomber883.66Decrease2.svg 0.08
Conservative Frances M. Gray84
Conservative Sarah J. Phillips70
Registered electors 6,108Increase2.svg 208
Turnout 2,44640.05Decrease2.svg 6.24
Rejected ballots130.53Increase2.svg 0.35
Liberal Democrats hold

Ruskin

Ruskin (3) [2] [3]
PartyCandidateVotes%±%
Labour Michelle Pearce 1,651 36.79 Increase2.svg 1.20
Labour Alan Firminger 1,594
Conservative Tobias W.H. Eckersley* 1,584 36.47 Decrease2.svg 4.71
Conservative David S. Bradbury*1,577
Conservative David J. Harvey1,486
Labour Usman Khalid1,445
Liberal Democrats Gareth P. Martin86619.89Increase2.svg10.52
Liberal Democrats Anna McGettigan [n 9] 841
Liberal Democrats Jonathan S. Mitchell829
Green Robert N. Goodman2916.85Decrease2.svg 7.01
Registered electors 7,488Decrease2.svg 171
Turnout 4,21156.24Decrease2.svg 1.55
Rejected ballots00.00Decrease2.svg 0.14
Labour gain from Conservative
Conservative hold

Rye

Rye (2) [2] [3]
PartyCandidateVotes%±%
Labour Niall T. Duffy 1,493 49.03 Increase2.svg 6.11
Labour Dominic J. Thorncroft 1,329
Conservative Irene A. Kimm*1,04534.92Decrease2.svg 7.73
Conservative Alan J. Buddles964
Liberal Democrats Alison Farrow38212.61Increase2.svg 6.75
Liberal Democrats Christine M. Watson344
Independent Garth P.W. Robertson993.44New
Registered electors 6,311Decrease2.svg 254
Turnout 2,98647.31Decrease2.svg 3.26
Rejected ballots150.50Increase2.svg 0.38
Labour gain from Conservative
Labour hold

St Giles

St Giles (3) [2] [3]
PartyCandidateVotes%±%
Labour Vincent C. Feiner 1,654 67.87 Increase2.svg 9.47
Labour Anthony G. Ritchie* 1,627
Labour William Skelly 1,579
Liberal Democrats Mark Allen49620.57Increase2.svg 9.44
Liberal Democrats Sandra R. Mason489
Liberal Democrats Roy F. Ashworth487
Conservative Clive W. Jones28311.56Decrease2.svg 4.89
Conservative Hugh P. McKinney280
Conservative Peter Lengyel264
Registered electors 8,918Increase2.svg 38
Turnout 2,62629.45Decrease2.svg 3.07
Rejected ballots130.50Increase2.svg 0.33
Labour hold
Labour hold
Labour hold

The Lane

The Lane (2) [2] [3]
PartyCandidateVotes%±%
Liberal Democrats Sarah J. Harrison 1,201 51.07 Increase2.svg37.91
Liberal Democrats Nigel P. Williams 1,177
Labour Leslie H. Alden*1,00243.04Decrease2.svg18.40
Labour Ann P. Bernadt*1,001
Conservative John G. Davenport1385.88Decrease2.svg19.52
Conservative Andrew M. Mitchell135
Registered electors 5,726Decrease2.svg 3
Turnout 2,48343.36Increase2.svg 3.88
Rejected ballots60.24Decrease2.svg 0.03
Liberal Democrats gain from Labour

Waverley

Waverley (2) [2] [3]
PartyCandidateVotes%±%
Labour Michael A. Gibson* 1,252 52.39 Increase2.svg 0.75
Labour Fycsene Sheilds 1,046
Liberal Democrats Neil C. Watson89239.40Increase2.svg 8.81
Liberal Democrats Robert J. Skelly835
Conservative Heather Kirby [n 10] 1918.21Decrease2.svg 9.56
Conservative Diana M. Ladas168
Registered electors 5,469Decrease2.svg 44
Turnout 2,36943.32Decrease2.svg 4.62
Rejected ballots150.63Increase2.svg 0.52
Labour hold
Labour hold

Notes

  1. Johnson was a sitting councillor representing the Chaucer ward
  2. Maurice replaced Cllr. John E. Maurice after his death in 1991
  3. Clark was a sitting councillor reprsenting the Alleyn ward
  4. Buxton was a sitting councillor representing the Dockyard ward
  5. Charge was a sitting councillor representing the Ruskin ward
  6. Vahib was a sitting councillor representing the Lyndhurst ward
  7. Murison was a sitting councillor representing the Chaucer ward
  8. Wingfield was a sitting councillor representing the Friary ward
  9. McGettigan was a sitting councillor representing the Chaucer ward
  10. Kirby was a sitting councillor representing the College ward

Related Research Articles

Elections to Tower Hamlets London Borough Council were held on 5 May 1994. The whole council was up for election and the Labour party gained overall control of the council from the Liberal Democrats.

Elections to Southwark Council were held in May 1990. The whole council was up for election. Turnout was 40.54%.

The 1990 Newham London Borough Council election to the Newham London Borough Council was held on 3 May 1990. The whole council was up for election. turnout no change was 33.0%. Labour maintained its overwhelming majority.

Elections to Tower Hamlets London Borough Council were held on 3 May 1990. The whole council was up for election. Turnout was 42.9%.
<span class="mw-page-title-main">1990 Camden London Borough Council election</span> 1990 local election in England

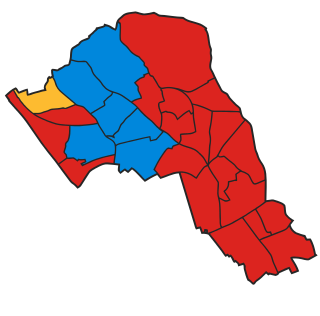
The 1990 Camden Council election took place on 3 May 1990 to elect members of Camden London Borough Council in London, England. The whole council was up for election. Labour comfortably stayed in overall control of the council, despite the Conservatives gaining three seats at their expense in Swiss Cottage. The Green Party came third in vote share with 13% of the vote, but won no seats.

The 1990 Barking and Dagenham Borough Council election took place on 3 May 1990 to elect members of Barking and Dagenham London Borough Council in London, England. The whole council was up for election and the Labour Party stayed overwhelmingly in overall control of the council.

The 1990 Bexley Council election took place on 3 May 1990 to elect members of Bexley London Borough Council in London, England. The whole council was up for election and the Conservative Party stayed in overall control of the council.

The 1990 Brent Council election took place on 3 May 1990 to elect members of Brent London Borough Council in London, England. The whole council was up for election and the council went in no overall control.

<span class="mw-page-title-main">1990 Croydon London Borough Council election</span> 1990 local election in England

The 1990 Croydon Council election took place on 3 May 1990 to elect members of Croydon London Borough Council in London, England. The whole council was up for election and the Conservative party stayed in overall control of the council.

The 1990 Ealing Council election took place on 3 May 1990 to elect members of Ealing London Borough Council in London, England. The whole council was up for election and the Conservative party gained overall control of the council.

<span class="mw-page-title-main">1990 Hammersmith and Fulham London Borough Council election</span> 1990 local election in England

The 1990 Hammersmith and Fulham Council election took place on 3 May 1990 to elect members of Hammersmith and Fulham London Borough Council in London, England. The whole council was up for election and the Labour party stayed in overall control of the council.

The 1990 Haringey Council election took place on 3 May 1990 to elect members of Haringey London Borough Council in London, England. The whole council was up for election and the Labour party stayed in overall control of the council.

The 1990 Havering Council election took place on 3 May 1990 to elect members of Havering London Borough Council in London, England. The whole council was up for election and the council stayed in no overall control.

The 1990 Hillingdon Council election tooklace on 3 May 1990 to elect members of Hillingdon London Borough Council in London, Englaland. The whole council was up for election and the Conservative Party gained overall control of the council.

The 1990 Hounslow Council election took place on 3 May 1990 to elect members of Hounslow London Borough Council in London, England. The whole council was up for election and the Labour party stayed in overall control of the council.

The 1994 Sutton Council election took place on 5 May 1994 to elect members of Sutton London Borough Council in London, England. The whole council was up for election and the Liberal Democrats stayed in overall control of the council.

The 1994 Waltham Forest Council election took place on 5 May 1994 to elect members of Waltham Forest London Borough Council in London, England. The whole council was up for election and the council went into no overall control.

The 1994 Wandsworth Council election took place on 5 May 1994 to elect members of Wandsworth London Borough Council in London, England. The whole council was up for election and the Conservative party stayed in overall control of the council.

The 1994 Westminster Council election took place on 5 May 1994 to elect members of Westminster City Council in London, England. The whole council was up for election and the Conservative party stayed in overall control of the council.

The 1990 Westminster Council election took place on 3 May 1990 to elect members of Westminster City Council in London, England. The whole council was up for election and the Conservative Party stayed in overall control of the council.

References

  1. 1 2 Minors, Michael; Grenham, Dennis. "London Borough Council Elections - 5 May 1994 - Ward Voting Statistics" (PDF). London Datastore. London Research Centre. p. 216. Retrieved 17 May 2024.
  2. 1 2 3 4 5 6 7 8 9 10 11 12 13 14 15 16 17 18 19 20 21 22 23 24 25 26 Minors, Michael; Grenham, Dennis. "London Borough Council Elections - 5 May 1994" (PDF). London Datastore. London Research Centre. pp. 155–158, 216–217. Retrieved 15 May 2024.
  3. 1 2 3 4 5 6 7 8 9 10 11 12 13 14 15 16 17 18 19 20 21 22 23 24 25 26 Rallings, Colin; Thrasher, Michael. "London Borough of Southwark Election Results 1964-2010" (PDF). London Datastore. Plymouth University. pp. 9–11. Retrieved 15 May 2024.