1994 Barnet London Borough Council election

Last updated

1994 Barnet London Borough Council election
  1990 5 May 1994 1998  

All 60 seats to Barnet London Borough Council
31 seats needed for a majority
Turnout50.0%
 First partySecond partyThird party
  No image wide.svg No image wide.svg No image wide.svg
Party Conservative Labour Liberal Democrats
Seats before39183
Seats won29256
Seat changeDecrease2.svg10Increase2.svg7Increase2.svg3
Percentage36.7%40.1%19.4%

Barnet UK local election 1994 map.svg
Map of the results of the 1994 Barnet London Borough council election. Conservatives in blue, Labour in red and Liberal Democrats in yellow..

Council control before election

Conservative

Council control after election

No overall control

The 1994 Barnet Council election took place on 5 May 1994 to elect members of Barnet London Borough Council in London, England. The whole council was up for election and the council went in no overall control.

Contents

Following the elections, a Labour-Liberal Democrat coalition was formed, replacing the previous Conservative majority. [1]

Background

Election result

Overall turnout in the election was 45.4%.

Barnet Local Election Result 1994 [2]
PartySeatsGainsLossesNet gain/lossSeats %Votes %Votes+/−
  Conservative 2936.7
  Labour 2540.1
  Liberal Democrats 619.4

Ward results

Arkley

Arkley (3 seats)
PartyCandidateVotes%±%
Labour Anita Campbell* 2,852 49.9
Labour Pamela Coleman* 2,701 47.2
Labour Linda McFadyen 2,574 45.0
Conservative Jonathan Kay1,85432.4
Conservative Jeremy Cameron1,83832.1
Conservative Arik Yacobi1,74430.5
Liberal Democrats Mary Barnett97517.0
Liberal Democrats Victor Godman86915.2
Liberal Democrats Michael Cleal86715.2
Turnout
Labour hold Swing
Labour hold Swing
Labour hold Swing

Brunswick Park

Brunswick Park (3 seats)
PartyCandidateVotes%±%
Conservative Donald Goodman* 1,985 44.9 -9.0
Conservative Irene Palmer* 1,834 41.5 -9.6
Conservative John Rawles* 1,817 41.1 -9.7
Labour Jeffrey Cohen1,57635.7+3.7
Labour Bridget Griffin1,50534.1+4.1
Labour Ian Wallace1,47233.3+3.6
Liberal Democrats Peter Finlayson78517.8+7.5
Liberal Democrats Alwena Lillywhite72316.4+6.0
Liberal Democrats Yvonne Wicksteed68815.6+5.8
Turnout
Conservative hold Swing

Burnt Oak

Burnt Oak (3 seats)
PartyCandidateVotes%±%
Labour Rosemary Carney 2,754 68.2 +15.1
Labour Alan Williams* 2,722 67.4 +8.6
Labour Allan Turner* 2,703 67.0 +16.6
Conservative Keith Dyall52513.0-24.1
Conservative Patricia Sparrow50412.5-14.1
Conservative Alan Maund48111.9-13.5
Liberal Democrats Barbara Farbey3408.4+1.2
Liberal Democrats Cyril Harris3248.0N/A
Liberal Democrats Diana Pattison3017.5N/A
Green Anne Doyle2255.6-4.3
Turnout
Labour hold Swing
Labour hold Swing
Labour hold Swing

Childs Hill

Childs Hill (3 seats)
PartyCandidateVotes%±%
Liberal Democrats Jack Cohen* 1,986 51.2 +14.3
Liberal Democrats Susette Palmer 1,887 48.7 +7.1
Liberal Democrats Jonathan Davies 1,765 45.5 +9.9
Conservative Abraham Dunner1,17230.2-1.8
Conservative Dineshwar Singh98625.4-6.2
Conservative Robert Halfon 98425.4-5.8
Labour Anthony Hulstrom76019.6-3.9
Labour Ghada Karmi73218.9-2.9
Labour Bryan Reith71018.3-2.3
Turnout
Liberal Democrats hold Swing

Colindale

Colindale (3 seats)
PartyCandidateVotes%±%
Labour Ellis Hillman* 2,588 63.2 +9.1
Labour David Williams* 2,553 62.3 +10.8
Labour Gillian Sargeant 2,450 59.8 +7.4
Conservative Alan Scott74718.2-6.3
Conservative Philip Williams69016.8N/A
Conservative Robert Linton68816.8-7.9
Liberal Democrats Mary Dodd43010.5+2.5
Liberal Democrats Arthur Roycroft3899.5+2.1
Liberal Democrats David Keech3689.0+2.6
Green Norman Crisp2736.7-3.3
Turnout
Labour hold Swing
Labour hold Swing
Labour hold Swing

East Barnet

East Barnet (3 seats)
PartyCandidateVotes%±%
Labour Elizabeth Jarvis 2,331 43.4 +5.1
Labour Usha Chopra 2,222 41.4 +3.4
Labour Richard Soer 2,175 40.5 +3.7
Conservative Olwen Evans*1,99237.1-8.3
Conservative Jihad Anani*1,77933.1-7.6
Conservative Frixos Tombolis1,74032.4-11.5
Liberal Democrats Margaret Neil1,12020.9+9.5
Liberal Democrats Peter Watkins1,01018.8+8.8
Liberal Democrats Charles Wicksteed92217.2+7.6
Turnout
Labour gain from Conservative Swing

East Finchley

East Finchley (3 seats)
PartyCandidateVotes%±%
Labour Joan Ryan* 3,416 61.0 +2.6
Labour Helen Gordon 3,340 59.6 -3.6
Labour Rudi Vis* 3,203 57.2 +1.4
Conservative Daniel Finkelstein 1,18721.2-12.7
Conservative Barry Antoniou1,13820.3-12.0
Conservative Marc Landsman1,11519.9-10.8
Green Noel Lynch62411.1N/A
Liberal Democrats Elinor Edwards59510.6N/A
Liberal Democrats Diana Darrer58210.4N/A
Liberal Democrats Thomas Darrer5349.5N/A
Turnout
Labour hold Swing
Labour hold Swing
Labour hold Swing

Edgware

Edgware (3 seats)
PartyCandidateVotes%±%
Conservative Julian Czarny* 2,098 47.8 -11.1
Conservative Malcolm Lester* 1,986 45.3 -12.4
Conservative Joan Scannell 1,934 44.1 -12.4
Labour Alan Sloam1,43032.6+6.6
Labour Keith Hurcombe1,38731.6+7.2
Labour Zena Sloam1,33630.5+5.9
Liberal Democrats Susanne Gregory75417.2+8.5
Liberal Democrats June Burton74116.9+10.0
Liberal Democrats Kathleen Lamprell68115.5+8.7
Turnout
Conservative hold Swing

Finchley

Finchley (3 seats)
PartyCandidateVotes%±%
Conservative Eva Greenspan* 2,285 50.1 -7.2
Conservative Leslie Sussman* 2,176 47.7 -9.6
Conservative Barbara Langstone* 2,149 47.1 -9.9
Labour Denis Calnan1,38430.3+1.6
Labour Josephine Cuttell1,36930.0+1.7
Labour Mary McGuirk1,33729.3-0.5
Liberal Democrats Malcolm Blount72115.8+9.8
Liberal Democrats Jasbir Singh66414.5+8.8
Green Gustav Clarkson3166.9-2.2
Green Janet Strangeways2174.8N/A
Turnout
Conservative hold Swing

Friern Barnet

Friern Barnet (3 seats)
PartyCandidateVotes%±%
Conservative Thomas Carter 2,242 44.9 -4.6
Conservative Brian Salinger* 2,198 44.0 -5.5
Conservative John Tiplady* 2,179 43.6 -6.2
Labour Roger Chapman1,83536.7+1.9
Labour Simon Montague1,74134.9+0.3
Labour Michael Harris1,61732.4-2.1
Liberal Democrats Matthew Harris82716.6+6.7
Liberal Democrats Jonathan Griffiths77415.5+6.0
Liberal Democrats Steven Deller75815.2+5.9
Turnout
Conservative hold Swing

Garden Suburb

Garden Suburb (3 seats)
PartyCandidateVotes%±%
Conservative Frank Davis* 1,748 42.6 -17.5
Conservative Roy Shutz* 1,724 42.0 -17.6
Conservative Mohammed Khamisa* 1,665 40.5 -18.4
Liberal Democrats Majorie Harris1,64540.1+20.4
Liberal Democrats Millicent Watkins1,55237.8+18.6
Liberal Democrats David Ive1,52037.0+18.1
Labour Naomi Angell66816.3+4.7
Labour Jula Westman64815.8+4.2
Labour Carol Kohll63415.4+4.6
Turnout
Conservative hold Swing

Golders Green

Golders Green (3 seats)
PartyCandidateVotes%±%
Conservative Melvin Cohen* 1,758 43.3 +2.8
Conservative John Hedge* 1,495 36.8 +1.6
Conservative Michele Moulin 1,415 34.9 -3.2
Labour Michael Doyle1,21830.0+2.2
Labour Montague Miller1,13728.0+0.5
Liberal Democrats Barrie Manson1,10627.2+0.3
Labour Dorothy Macedo1,08326.7-0.8
Liberal Democrats Michael Green1,00924.9-0.5
Liberal Democrats Rita Druiff95923.6-1.7
Green Miranda Dunn1253.1-3.4
Green Karen Lansdowne972.4N/A
Turnout
Conservative hold Swing

Hadley

Hadley (3 seats)
PartyCandidateVotes%±%
Conservative Mark Hayball 2,377 37.8 -11.1
Conservative Hazel Mammatt* 2,339 37.2 -5.2
Conservative Kantilal Patel 2,037 32.4 -12.5
Labour Michael Campbell1,96131.2+6.1
Labour Jean Feldman1,91530.4+8.2
Labour David Clarke1,88530.0+4.7
Liberal Democrats Sean Hooker1,52324.2+11.5
Liberal Democrats Trevor Orr1,47923.5+11.8
Liberal Democrats Brigid Povah1,26320.1+12.2
Green Timothy Riley6129.7-1.6
Independent Christopher Johnson4066.5N/A
Turnout
Conservative hold Swing

Hale

Hale (3 seats)
PartyCandidateVotes%±%
Conservative Leslie Pym* 1,914 41.3 -9.3
Conservative Sheila Scott* 1,859 40.2 -8.9
Labour Andrew Dickie 1,820 39.3 +9.1
Conservative Graham Old1,72637.3-11.0
Labour Janet Heathfield1,70136.7+5.2
Labour William Parnaby1,65335.7+6.3
Liberal Democrats James Creighton78817.0+6.9
Liberal Democrats Guy Patton73015.8+7.7
Liberal Democrats Geoffrey Jacobs72315.6+6.7
Turnout
Conservative hold Swing
Labour gain from Conservative Swing

Hendon

Hendon (3 seats)
PartyCandidateVotes%±%
Conservative Anthony Finn* 2,036 45.8 -9.5
Conservative Frederick Poole* 1,823 41.0 -11.3
Conservative Edward Bunn* 1,791 40.3 -13.0
Labour Colin Francombe1,46432.9+2.8
Labour David Simons1,30229.3-0.8
Labour Alan Killingback1,26028.3-0.1
Liberal Democrats Fiona Palmer85219.2+9.5
Liberal Democrats Harold Defries82518.6+9.6
Liberal Democrats Martin Rodwell70015.7+7.4
Green Graham White3257.3N/A
Turnout
Conservative hold Swing

Mill Hill

Mill Hill (3 seats)
PartyCandidateVotes%±%
Liberal Democrats Sheila Gottsche 1,836 38.7 +27.3
Liberal Democrats Jeremy Davies 1,830 38.6 +28.8
Liberal Democrats Wayne Casey 1,817 38.3 +28.9
Conservative John Hart*1,79537.8-15.5
Conservative Jane Ellison*1,78137.5-17.8
Conservative Peter Holland1,70135.8-18.7
Labour Jean Smith93919.8-7.0
Labour George Janeway92319.5-5.0
Labour Michael Epstein91019.2-4.1
Turnout
Liberal Democrats gain from Conservative Swing

St Paul’s

St Paul’s (3 seats)
PartyCandidateVotes%±%
Labour Kitty Lyons 2,553 45.1 +5.6
Labour Katherine McGuirk 2,476 43.7 +2.7
Labour James Tierney 2,428 42.9 +5.1
Conservative Helena Hart*2,14837.9-6.5
Conservative Mike Freer*2,14337.9-6.3
Conservative Mary Phillips*2,12637.6-3.9
Liberal Democrats Joan Beales5149.1N/A
Liberal Democrats John Beales5038.9N/A
Liberal Democrats David Loxton4738.4N/A
Green Maureen Colmans3225.7-8.7
Green Ashley Gunstock3145.5N/A
Green Dennis Vigay2223.9N/A
Turnout
Labour gain from Conservative Swing

Totteridge

Totteridge (3 seats)
PartyCandidateVotes%±%
Conservative Victor Lyon* 2,259 46.9 -7.7
Conservative Victor Usher* 2,218 46.0 -8.6
Conservative Kevin Edson 2,180 45.3 -9.3
Labour Timothy Roberts1,49231.0+3.6
Labour David Saxon1,44129.9+4.3
Labour Victoria Spawls1,43929.9+5.1
Liberal Democrats Jennifer Keech86317.9+8.6
Liberal Democrats Bernadette Cleal85317.7+8.3
Liberal Democrats Nicholas Sullivan85317.7+8.5
Natural Law Diane Derksen1202.5N/A
Turnout
Conservative hold Swing

West Hendon

West Hendon (3 seats)
PartyCandidateVotes%±%
Labour Gina Marks* 2,008 50.9 +4.9
Labour Agnes Slocombe* 1,968 49.9 +6.7
Labour Nicholas Kissen 1,941 49.2 +3.8
Conservative David Berens1,07027.1-11.0
Conservative David Twomey1,00425.5-12.5
Conservative Susan Twomey95724.3-12.3
Liberal Democrats Erika Coward50012.7+4.2
Liberal Democrats Richard Coward50012.7+4.4
Liberal Democrats Shirley Rodwell45511.5+4.6
Green Fiona Clode2686.8N/A
Turnout
Labour hold Swing
Labour hold Swing
Labour hold Swing

Woodhouse

Woodhouse (3 seats)
PartyCandidateVotes%±%
Labour Stanley Cross* 3,084 48.9 +1.3
Labour Melanie Packer 2,928 46.5 -0.9
Labour Joanna Salsbury 2,915 46.3 -0.9
Conservative Brian Coleman 2,09333.2-12.8
Conservative Mary Russell2,03632.3-13.5
Conservative Peter Yallouros1,98631.5-12.9
Liberal Democrats Rosalind Abrahams66610.6N/A
Liberal Democrats Geoffrey Lee6149.7N/A
Liberal Democrats Joy Manson5859.3N/A
Turnout
Labour hold Swing
Labour hold Swing
Labour hold Swing

By-elections between 1994 and 1998

Colindale

Colindale by-election, 14 March 1996 [3]
PartyCandidateVotes%±%
Labour Thomas A. McKendry 1,962 70.6
Conservative Alan R. Maund42515.3
Liberal Democrats Roger L. Axworthy2579.2
Green Norman D. Crisp712.6
UKIP Bernard P. Wright652.3
Majority1,53755.3
Turnout 2,780
Labour hold Swing

The by-election was called following the death of Cllr. Ellis S. Hillman.

Colindale

Colindale by-election, 14 November 1996 [3]
PartyCandidateVotes%±%
Labour Danish Chopra 1,339 71.0 +0.4
Conservative Alan R. Maund38620.5+5.2
Liberal Democrats Roger L. Axworthy1608.5-0.7
Majority95350.5-4.8
Turnout 1,88516.8
Labour hold Swing

The by-election was called following the death of Cllr. Thomas A. McKendry.

Edgware

Edgware by-election, 14 November 1996 [3]
PartyCandidateVotes%±%
Conservative Anthony P. Spencer 1,189 48.4
Labour Alan M. Sloam1,12946.0
Liberal Democrats Geoffrey A. Jacobs1385.6
Majority602.4
Turnout 2,45621.1
Conservative hold Swing

The by-election was called following the resignation of Cllr. Julian D. Czarny.

Hendon

Hendon by-election, 14 November 1996 [3]
PartyCandidateVotes%±%
Conservative Andrew M. Sherling 970 36.2
Labour Colin S. Francome88533.1
Liberal Democrats Susan J. Palin82130.7
Majority853.1
Turnout 2,67622.7
Conservative hold Swing

The by-election was called following the resignation of Cllr. Edward P. Bunn.

Related Research Articles

<span class="mw-page-title-main">Kingston upon Thames London Borough Council elections</span>

Kingston upon Thames London Borough Council is elected every four years.

<span class="mw-page-title-main">Barking and Dagenham London Borough Council elections</span>

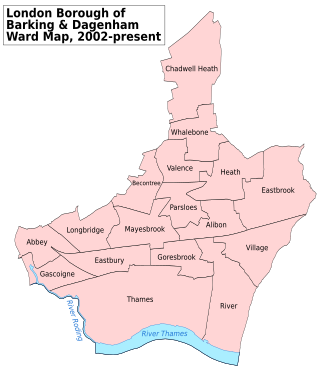
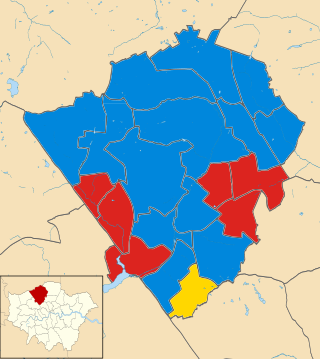
Barking and Dagenham London Borough Council in London, England is elected every four years. Since the last boundary changes in 2002, 51 councillors have been elected from 17 wards.

<span class="mw-page-title-main">1998 Barnet London Borough Council election</span> 1998 local election in England

The 1998 Barnet Council election took place on 7 May 1998 to elect members of Barnet London Borough Council in London, England. The whole council was up for election and the council stayed under no overall control.

<span class="mw-page-title-main">Bexley London Borough Council elections</span>

Bexley London Borough Council is the local authority for the London Borough of Bexley in London, England. The council is elected every four years.

<span class="mw-page-title-main">Bromley London Borough Council elections</span>

Bromley London Borough Council is the local authority for the London Borough of Bromley. The council is elected every four years.

The Camden London Borough Council in London, England is elected every four years. Since the last boundary changes in 2002, 54 councillors have been elected from 18 wards.

<span class="mw-page-title-main">Ealing London Borough Council elections</span>

Ealing Council is elected every four years.

<span class="mw-page-title-main">Redbridge London Borough Council elections</span>

Redbridge London Borough Council in London, England is elected every four years.

<span class="mw-page-title-main">Harrow London Borough Council elections</span>

Harrow London Borough Council in London, England is elected every four years. Since the last boundary changes in 2002, 63 councillors are elected from 21 wards.

<span class="mw-page-title-main">Hounslow London Borough Council elections</span>

Hounslow Council in London, England is elected every four years. 60 councillors are elected from 20 wards, with by-elections held to fill any vacancies between elections.

<span class="mw-page-title-main">Waltham Forest London Borough Council elections</span>

Waltham Forest London Borough Council in London is elected every four years. Since the last boundary changes in 2002, 60 councillors have been elected from 20 wards, with 3 councillors per ward.

<span class="mw-page-title-main">Sutton London Borough Council elections</span>

Sutton London Borough Council in London, England is elected every four years.

<span class="mw-page-title-main">Haringey London Borough Council elections</span>

Haringey London Borough Council is the local authority for the London Borough of Haringey in London, England. The council is elected every four years.

<span class="mw-page-title-main">Havering London Borough Council elections</span>

Havering London Borough Council in London, England is elected every four years. Since the last boundary changes in 2002, 54 councillors have been elected from 18 wards.

<span class="mw-page-title-main">Greenwich London Borough Council elections</span>

Greenwich London Borough Council is the local authority for the Royal Borough of Greenwich in London, England. The council is elected every four years. Since the last boundary changes in 2022, 55 councillors have been elected from 23 wards.

<span class="mw-page-title-main">Newham London Borough Council elections</span>

Newham London Borough Council is elected every four years.

<span class="mw-page-title-main">1978 Barnet London Borough Council election</span> 1978 local election in England

The 1978 Barnet Council election took place on 4 May 1978 to elect members of Barnet London Borough Council in London, England. The whole council was up for election and the Conservative party stayed in overall control of the council.

<span class="mw-page-title-main">1982 Barnet London Borough Council election</span> 1982 local election in England

The 1982 Barnet Council election took place on 6 May 1982 to elect members of Barnet London Borough Council in London, England. The whole council was up for election and the Conservative party stayed in overall control of the council.

<span class="mw-page-title-main">1986 Barnet London Borough Council election</span> 1986 local election in England

The 1986 Barnet Council election took place on 8 May 1986 to elect members of Barnet London Borough Council in London, England. The whole council was up for election and the Conservative party stayed in overall control of the council.

<span class="mw-page-title-main">1990 Barnet London Borough Council election</span> 1990 local election in England

The 1990 Barnet Council election took place on 3 May 1990 to elect members of Barnet London Borough Council in London, England. The whole council was up for election and the Conservative party stayed in overall control of the council.

References

  1. Mason, Rowena; Stewart, Heather (30 April 2022). "Rebel Tory MPs fear Boris Johnson could trigger autumn general election". The Guardian . London. Archived from the original on 1 May 2022. Retrieved 2 May 2022.
  2. Minors, Michael; Grenham, Dennis. "London Borough Council Elections 7 May 1998 including the Greater London Authority Referendum results" (PDF). Demographic and Statistical Studies. London Research Centre. Archived (PDF) from the original on 22 February 2015. Retrieved 22 February 2015.
  3. 1 2 3 4 "London Borough Council Elections 7 May 1998 including the Greater London Authority Referendum results" (PDF). London Datastore. London Research Centre. Archived (PDF) from the original on 22 February 2015. Retrieved 8 March 2015.