2010 Merton London Borough Council election

Last updated

2010 Merton London Borough Council election
  2006 6 May 2010 2014  

All 60 council seats on Merton London Borough Council
Turnout66.3% (Increase2.svg23.4%) [1] [2]
 First partySecond party
 
Party Labour Conservative
Last election27 seats, 34.8%30 seats, 44.6%
Seats won2827
Seat changeIncrease2.svg1Decrease2.svg3
Popular vote101,95994,893
Percentage39.0%36.3%
SwingIncrease2.svg4.2%Decrease2.svg8.3%

 Third partyFourth party
 
Party Merton Park Residents Liberal Democrats
Last election3 seats, 3.0%0 seats, 12.0%
Seats won32
Seat changeSteady2.svgIncrease2.svg2
Popular vote7,57247,291
Percentage2.9%18.1%
SwingDecrease2.svg0.1%Increase2.svg6.1%

Merton London UK local election 2010 map.svg
Map of the results of the 2010 Merton council election. Conservatives in blue, Labour in red, Liberal Democrats in yellow and Merton Park Ward Residents Association in white.

Council leader before election

David Williams
Conservative

Council leader after election

Stephen Alambritis
Labour

Elections for the London Borough of Merton were held on 6 May 2010. This was on the same day as other local elections in England and a national general election. [1]

Contents

Following the elections, a Labour minority administration was formed with the support of the three Merton Park Ward Residents Association councillors, this replaced the previous Conservative administration. [3] [4]

Results

Labour became the largest party in Merton, defeating the incumbent minority Conservative administration. However, Labour fell three seats short of a majority, so the council remained under no overall control.

The Liberal Democrats regained two seats in West Barnes from the Conservatives and the Merton Park Ward Residents' Association maintained its three councillors in Merton Park. [1]

Merton Local Election Result 2010 [5]
PartySeatsGainsLossesNet gain/lossSeats %Votes %Votes+/−
  Labour 2810Increase2.svg146.7%39.0%101,959Increase2.svg4.2%
  Conservative 2703Decrease2.svg345.0%36.3%94,893Decrease2.svg8.3%
  Merton Park Residents 30005.0%2.9%7,572Decrease2.svg0.1%
  Liberal Democrats 220Increase2.svg23.3%18.1%47,291Increase2.svg6.1%
  Green 00000%1.7%4,331Decrease2.svg2.2%
  BNP 00000%0.9%2,439Increase2.svg0.3%
  Independent 00000%0.6%1,445n/a
  UKIP 00000%0.5%1,206Increase2.svg0.2%
  CPA 00000%0.1%149n/a

UKIP defections

On 15 May 2013, four Conservative councillors defected to the UK Independence Party (UKIP). This included Suzanne Evans, who later became a national UKIP spokeswoman. [6] No by-elections were called as a result of the defections.

Results by Ward

Abbey

Abbey
PartyCandidateVotes%±%
Conservative Diane Neil Mills* 1,888 39.6 -1.6
Conservative Henry Nelless* 1,758 36.8 -1.7
Labour Andrew Judge 1,733 36.3 -0.1
Conservative Abdul Latif1,63434.2-6.5
Labour Pauline Cowper1,54232.3-2.2
Labour Emma Nye1,48431.1-3.0
Liberal Democrats Adam Towner1,22925.7+7.7
Liberal Democrats Mohammad Karim1,10323.1+8.3
Liberal Democrats Lesley Warne1,06822.4+9.3
Turnout 4,77366.3
Conservative hold Swing
Labour gain from Conservative Swing

Cannon Hill

Cannon Hill
PartyCandidateVotes%±%
Conservative Deborah Shears* 2,195 44.0 -9.7
Conservative Miles Windsor 1,967 39.5 -15.1
Conservative Logie Lohendran 1,860 37.3 -14.4
Labour Leslie Boodram1,35527.2+2.2
Liberal Democrats Helen Carter1,19524.0+10.2
Labour Shelley McNicol1,16923.5-1.5
Labour Aejaz Khanzada1,09422.0+1.2
Liberal Democrats Hazel Rutledge1,05021.1+8.1
Liberal Democrats Barrie Lambert1,00720.2+8.1
Independent Ray Skinner49810.0N/A
BNP Paul Laws3787.6N/A
CPA Samuel Jayakrishna1493.0N/A
Turnout 4,98371.2
Conservative hold Swing

Colliers Wood

Colliers Wood
PartyCandidateVotes%±%
Labour Nick Draper* 2,608 55.8 +5.8
Labour Laxmi Attawar 2,367 50.6 +3.1
Labour Gam Gurung 2,261 48.3 +2.2
Conservative Amelia East1,00121.4+9.8
Conservative Daisy Meyland-Smith96020.5+9.6
Liberal Democrats Elizabeth Barker 88819.0+11.3
Conservative Cesar Sepulveda84818.1+7.8
Liberal Democrats Christopher Archer80417.2N/A
Green Michael Dees62213.3-22.4
Liberal Democrats Rosemary Wynes-Devlin60813.0N/A
Turnout 4,67761.5
Labour hold Swing
Labour hold Swing
Labour hold Swing

Cricket Green

Cricket Green
PartyCandidateVotes%±%
Labour Ian Munn* 2,928 61.7 +7.4
Labour Russell Makin* 2,748 57.9 +6.1
Labour Judy Saunders* 2,714 57.2 +6.0
Conservative Barbara Mansfield1,20725.4-7.5
Conservative Denise March96620.4-8.5
Conservative William Brierly93719.7-7.0
Liberal Democrats Nicholas Pizey75716.0-0.9
BNP Brian Wilkes3988.4N/A
Turnout 4,74662.6
Labour hold Swing
Labour hold Swing
Labour hold Swing

Dundonald

Dundonald
PartyCandidateVotes%±%
Conservative David Dean 2,130 43.7 +1.0
Conservative Chris Edge* 2,028 41.6 +0.7
Conservative Suzanne Grocott 1,888 38.7 -3.0
Liberal Democrats Martin Crosby1,74835.9+12.1
Liberal Democrats Anthony Fairclough1,61133.1+12.3
Liberal Democrats Alain Desmier1,56232.0+15.1
Labour Christine Bickerstaff95319.6-1.8
Labour Paul Parkinson77015.8-5.6
Labour Bishara Torossian65713.5-7.1
Green Ian Christie58211.9-7.4
Turnout 4,87470.5
Conservative hold Swing

Figge’s Marsh

Figge's Marsh
PartyCandidateVotes%±%
Labour Agatha Akyigyina* 3,271 69.3 +13.4
Labour Geraldine Stanford* 3,245 68.8 +15.6
Labour Peter Walker 2,972 63.0 +5.7
Conservative Gregory Capper83817.8-6.0
Conservative Hugh Lenon81717.3-5.5
Conservative John Telford74115.7-7.8
Liberal Democrats Usaama Kaweesa73315.5+0.9
UKIP Henry Pringle3357.1-1.5
Turnout 4,71862.1
Labour hold Swing
Labour hold Swing
Labour hold Swing

Graveney

Graveney
PartyCandidateVotes%±%
Labour Linda Kirby* 3,008 69.4 +11.1
Labour John Dehaney* 2,937 67.7 +9.6
Labour Greg Udeh* 2,539 58.6 +10.8
Conservative Sally Hammond 87820.2-6.0
Liberal Democrats Benedict Fletcher82919.1-1.6
Conservative Beth Mitchell75517.4-7.6
Conservative Eleanor Mill74117.1-5.8
Turnout 4,33661.7
Labour hold Swing
Labour hold Swing
Labour hold Swing

Hillside

Hillside
PartyCandidateVotes%±%
Conservative Suzanne Evans 2,258 52.1 -6.8
Conservative David Williams* 2,041 47.1 -9.8
Conservative David Simpson* 2,006 46.3 -10.4
Liberal Democrats Elizabeth Bowers1,26329.1+10.6
Liberal Democrats John Houlihan1,10525.5+8.6
Liberal Democrats Richard Tibbetts1,00023.1+7.3
Labour Peter McGinity77117.8+3.2
Labour Ailsa Williams63414.6-2.1
Labour Ross Savill60113.9+0.7
Green Nick Robins4279.9-4.9
UKIP Jimmy Stewart1393.2-0.5
Turnout 4,33465.9
Conservative hold Swing

Lavender Fields

Lavender Fields
PartyCandidateVotes%±%
Labour Co-op Mark Allison* 2,226 55.3 +1.0
Labour Co-op Edith Macauley* 2,192 54.5 +4.1
Labour Co-op Mark Betteridge* 2,158 53.6 -1.3
Conservative Richard Aitken-Davies85721.3-3.7
Conservative Gordon Southcott77919.4-2.2
Liberal Democrats Peter Hardy75818.8+0.7
Conservative Ron Wilson75618.8-2.7
Liberal Democrats Nadeem Mirza62115.4N/A
Liberal Democrats Eliane Patton58314.5N/A
Green John Barker3418.5-12.4
Turnout 4,02557.5
Labour hold Swing
Labour hold Swing
Labour hold Swing

Longthornton

Longthornton
PartyCandidateVotes%±%
Labour Brenda Fraser 2,906 63.9 +10.4
Labour David Chung* 2,828 62.2 +9.8
Labour Sam Thomas 2,391 52.6 +6.5
Conservative Richard Hayward1,26127.7-9.4
Conservative Jeya Nadanakumaran1,05223.1-12.9
Conservative Kaunain Nurani1,02822.6-12.7
Liberal Democrats Sally Harlow83218.3+6.2
UKIP Andrew Mills3016.6N/A
Turnout 4,54864.8
Labour hold Swing
Labour hold Swing
Labour hold Swing

Lower Morden

Lower Morden
PartyCandidateVotes%±%
Conservative Maurice Groves* 2,413 50.4 -12.6
Conservative Richard Hilton 2,110 44.1 -18.0
Conservative Ray Tindle 1,869 39.1 -18.9
Labour Terry Daniels1,58233.1+8.3
Labour Mark Inger1,45430.4+6.6
Labour Muzaffar Mansoor1,21725.4+4.9
Liberal Democrats Patricia Pearce90719.0+5.0
Liberal Democrats Asif Ashraf79816.7N/A
BNP Patricia Donelson4569.5N/A
Turnout 4,78370.8
Conservative hold Swing

Merton Park

Merton Park
PartyCandidateVotes%±%
Merton Park Residents Karin Forbes* 2,538 50.5 +1.6
Merton Park Residents John Sargeant 2,519 50.2 +2.9
Merton Park Residents Peter Southgate* 2,515 50.1 +1.4
Conservative Pete Digger1,35927.1-7.8
Conservative Eleanor Sturge1,17023.3-11.0
Conservative Linda Taylor1,10622.0-11.8
Labour Christopher McKeon86217.2+6.1
Liberal Democrats Duncan Burch69013.7+5.3
Labour Charles Ocansey67113.4+3.8
Labour Teresa Ocansey63612.7+3.7
UKIP Graham Mills2274.5+0.4
Turnout 5,02172.2
Merton Park Residents hold Swing

Pollards Hill

Pollards Hill
PartyCandidateVotes%±%
Labour Martin Whelton* 2,820 47.4 -2.0
Labour Jeffrey Hanna 2,718 46.4 -1.9
Labour Richard Williams* 2,574 46.2 +1.5
Conservative Ralph Smith1,17025.3-14.8
Conservative Andrew Vaughan-Payne91219.7-15.5
Conservative Aaron Wood87719.0-14.5
Liberal Democrats Sharon Ajakaiye49610.7-2.1
Liberal Democrats Hamish Norbrook47610.3N/A
Independent John Cole2976.4N/A
Independent Mike Tilcock2695.8N/A
Turnout 4,62664.8
Labour hold Swing
Labour hold Swing
Labour hold Swing

Ravensbury

Ravensbury
PartyCandidateVotes%±%
Labour Philip Jones* 2,389 52.7 +9.9
Labour Stephen Alambritis* 2,367 52.2 +8.2
Labour Peter McCabe* 2,221 49.0 +8.6
Conservative Margaret Groves1,36430.1-3.8
Conservative Adam Bush1,24727.5-9.6
Conservative Deryck Ross1,03522.8-7.6
Liberal Democrats Joan Pyke-Lees71915.9+1.6
BNP Robert Holmes4239.3-7.2
Turnout 4,53664.2
Labour hold Swing
Labour hold Swing
Labour hold Swing

Raynes Park

Raynes Park
PartyCandidateVotes%±%
Conservative Margaret Brierly* 2,466 49.4 -10.4
Conservative Linda Scott* 2,217 44.5 -13.1
Conservative Rod Scott* 2,117 42.5 -13.6
Liberal Democrats David Amer1,60132.1+12.3
Liberal Democrats Francesca Woodhouse1,41528.3+12.5
Liberal Democrats Kieron Faller-Mead1,21924.4+9.7
Labour Margaret Tulloch90918.2+1.0
Labour Charles Lucas86317.3+0.6
Labour Geeta Nargrund77815.6+1.2
Green Richard Evans57211.5-2.8
Turnout 4,98769.4
Conservative hold Swing

St Helier

St Helier
PartyCandidateVotes%±%
Labour Maxi Martin* 2,385 53.4 +10.2
Labour Stan Anderson 2,206 49.4 +11.1
Labour Dennis Pearce* 2,185 48.9 +9.0
Conservative Stephen Crowe1,37330.8-0.4
Conservative Thomas Lazur1,18926.6-3.2
Conservative Gary Watkinson1,16126.0+1.1
Liberal Democrats Maximilian Camplin76217.1+3.3
BNP Edward Atkins4269.5-9.7
BNP Brian Wilkes3588.0N/A
Turnout 4,46463.9
Labour hold Swing
Labour hold Swing
Labour hold Swing

Trinity

Trinity
PartyCandidateVotes%±%
Conservative James Holmes 2,036 43.2 -8.5
Conservative Krystal Miller* 1,980 42.0 -9.3
Conservative Simon Withey* 1,836 39.0 -9.5
Liberal Democrats Matthew Payne1,28727.3+9.6
Labour Katherine Cowling1,21525.8-6.7
Liberal Democrats Ewa Mieczkowska1,13824.2+6.5
Labour Clare Antenen1,07722.9-5.5
Liberal Democrats Nicolas Webb1,06822.7+7.0
Labour Alison Fletcher Rogers1,04222.1-4.8
Green Liz Matthews64113.6N/A
Turnout 4,71265.5
Conservative hold Swing

Village

Village
PartyCandidateVotes%±%
Conservative Samantha George* 3,213 69.3 -11.1
Conservative John Bowcott* 3,200 69.0 -11.0
Conservative Richard Chellew* 3,115 67.2 -11.0
Liberal Democrats Anne Blanchard96020.7+8.9
Liberal Democrats Simon McGrath78116.8+7.4
Liberal Democrats David Willis70215.1+6.3
Labour William Bottriell54311.7+2.4
Labour Michael Norman-Smith4479.6+2.4
Labour Brian Paul4038.7+2.0
Turnout 4,63872.6
Conservative hold Swing

West Barnes

West Barnes
PartyCandidateVotes%±%
Liberal Democrats Mary-Jane Jeanes 1,970 39.0 -1.0
Liberal Democrats Iain Dysart 1,915 38.0 -0.3
Conservative Gilli Lewis-Lavender* 1,900 37.7 -8.2
Conservative Brian Lewis-Lavender1,85436.7-7.5
Conservative Sarah McAlister1,72834.2-8.1
Liberal Democrats Nazir Malik1,67533.2-2.5
Labour Ruth Bailham90017.8+4.5
Labour Danny Connellan81216.1+3.1
Labour Michael Somerville69013.7+2.5
Independent Angela Caldara*3817.6-36.6
Green Francis Cluer3577.1N/A
Turnout 5,04671.8
Liberal Democrats gain from Conservative Swing
Conservative hold Swing

Wimbledon Park

Wimbledon Park
PartyCandidateVotes%±%
Conservative Tariq Ahmad* 2,310 43.1 -13.3
Conservative Janice Howard 2,293 42.8 -14.6
Conservative Oonagh Moulton* 2,198 41.0 -16.5
Liberal Democrats Dave Busby1,54828.9+8.5
Liberal Democrats Alice Munro1,44026.9+9.5
Liberal Democrats Edward Doran1,38025.7+8.7
Labour Hugh Constant1,10420.6-0.5
Labour Tony Mendes96017.9-2.7
Labour Anthony Draper86716.2-2.6
Green Samantha Guy4408.2N/A
Green Richmond Crowhurst3496.5N/A
UKIP Mark McAleer2043.8N/A
Turnout 5,36068.7
Conservative hold Swing

By-Elections

Wimbledon Park by-election, 3 May 2012 [7]
PartyCandidateVotes%±%
Conservative Ms. Linda Taylor 1,837 47.6 +4.5
Labour Ms. Louise Deegan93124.1+3.5
Liberal Democrats Dave Busby83821.7-7.2
Green Richmond Crowhurst2536.6+0.1
Turnout 48.0-20.7
Conservative hold Swing

The by-election was called following the resignation of Cllr. Tariq Ahmad.

Colliers Wood by-election, 8 August 2013 [7]
PartyCandidateVotes%±%
Labour Ms. Caroline Cooper-Marbiah 1,685 72.2 +23.9
Conservative Peter Lord44118.9-2.5
UKIP Shafqat Janjua1576.7N/A
Liberal Democrats Phil Ling522.2-16.8
Turnout 29.9-31.6
Labour hold Swing

The by-election was called following the death of Cllr. Gam Gurung.

Related Research Articles

<span class="mw-page-title-main">Lambeth London Borough Council elections</span>

Lambeth London Borough Council is elected every four years.

<span class="mw-page-title-main">Barking and Dagenham London Borough Council elections</span>

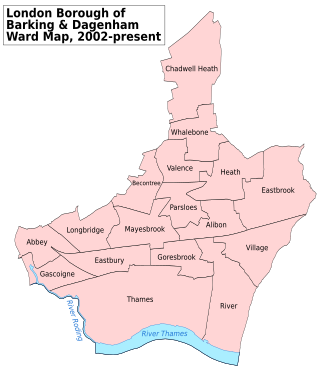
Barking and Dagenham London Borough Council in London, England is elected every four years. Since the last boundary changes in 2002, 51 councillors have been elected from 17 wards.

<span class="mw-page-title-main">Croydon London Borough Council elections</span>

Elections for the Croydon London Borough Council are held every four years to elect 70 councillors. The last ward boundary changes came into force at the 2018 local elections.

<span class="mw-page-title-main">Brent London Borough Council elections</span> Local elections in London

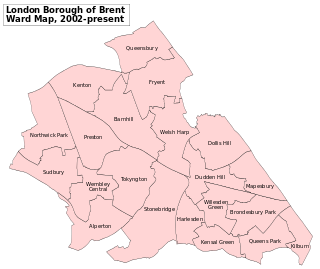
Brent London Borough Council in London, England is elected every four years. Since the last boundary changes in 2002, 63 councillors have been elected from 21 wards.

The Camden London Borough Council in London, England is elected every four years. Since the last boundary changes in 2002, 54 councillors have been elected from 18 wards.

<span class="mw-page-title-main">Enfield London Borough Council elections</span>

Enfield London Borough Council in London, England is elected every four years. Since the last boundary changes in 2002, 63 councillors have been elected from 21 wards.

<span class="mw-page-title-main">Harrow London Borough Council elections</span>

Harrow London Borough Council in London, England is elected every four years. Since the last boundary changes in 2022, 55 councillors are elected from 22 wards.

<span class="mw-page-title-main">Lewisham London Borough Council elections</span>

Lewisham London Borough Council is the local authority for the London Borough of Lewisham, in London, United Kingdom. Elections are held every four years using a plurality bloc vote electoral system for the councillors and the supplementary vote electoral system for the elected mayor.

<span class="mw-page-title-main">Richmond upon Thames London Borough Council elections</span> Class of UK elections

Richmond upon Thames London Borough Council elections are held every four years for all 54 councillor seats in the 18 wards that make up the Borough Council. By-elections are held in individual wards when vacancies arise outside the four-year cycle.

<span class="mw-page-title-main">Sutton London Borough Council elections</span>

Sutton London Borough Council in London, England is elected every four years.

<span class="mw-page-title-main">Merton London Borough Council elections</span> Political party in the United Kingdom

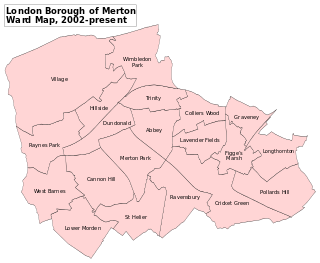
Merton London Borough Council in London, England is elected every four years; it has administrative control over the London Borough of Merton.

<span class="mw-page-title-main">Greenwich London Borough Council elections</span>

Greenwich London Borough Council is the local authority for the Royal Borough of Greenwich in London, England. The council is elected every four years. Since the last boundary changes in 2022, 55 councillors have been elected from 23 wards.

Wandsworth London Borough Council, England, is elected every four years. From 2002 to 2018, 60 councillors were elected from 20 wards. Following ward boundary changes, in 2022 58 councillors were elected in 22 wards returning either 2 or 3 councillors each.

<span class="mw-page-title-main">2014 Merton London Borough Council election</span> 2014 local election in England

Elections for the London Borough of Merton were held on 22 May 2014 to elect members of Merton London Borough Council in England. This was on the same day as other local elections in England and an election to the European Parliament.

<span class="mw-page-title-main">2014 Westminster City Council election</span> 2014 local election in England

The 2014 Westminster City Council election took place on 22 May 2014 to elect members of Westminster City Council in England. This was on the same day as other local elections.

<span class="mw-page-title-main">2018 Newham London Borough Council election</span> 2018 local election in England, UK

The 2018 Newham London Borough Council election was held on 3 May 2018 to elect members of Newham London Borough Council in England. This was on the same day as other local elections.

<span class="mw-page-title-main">2018 Barking and Dagenham London Borough Council election</span> 2018 local election in England, UK

The 2018 Barking and Dagenham Council election took place on 3 May 2018 to elect members of Barking and Dagenham Council in London. This was on the same day as other local elections. The Labour Party won every available council seat for the third election in a row, winning 74% of the popular vote. The Conservatives saw their vote share rise by 13 percentage points, but failed to win any seats.

<span class="mw-page-title-main">2018 Merton London Borough Council election</span> 2018 local election in England

Elections for the London Borough of Merton were held on 3 May 2018 to elect members of Merton London Borough Council in England. This was on the same day as other local elections in England.

<span class="mw-page-title-main">2006 Merton London Borough Council election</span>

Elections for the London Borough of Merton were held on 4 May 2006. This was on the same day as other local elections in England.

<span class="mw-page-title-main">2002 Merton London Borough Council election</span>

Elections for the London Borough of Merton were held on 2 May 2002. This was on the same day as other local elections in England. These elections were held under new ward boundaries, which increased the number of councillors to sixty from fifty-seven. Labour remained in overall control of the council with a reduced majority.

References

  1. 1 2 3 "Merton". London Councils. 7 May 2010. Archived from the original on 10 May 2010. Retrieved 9 May 2010.
  2. "London Datastore". data.london.gov.uk. Retrieved 24 May 2018.
  3. "The particularities of Merton | Dave Hill". TheGuardian.com . 18 May 2014.
  4. "The Home Page".
  5. "Merton Council Election Results 2010". Local Elections Archive Project. Retrieved 14 June 2018.
  6. May, Lauren (16 May 2013). "Councillors left 'open mouthed' by shock resignation of four senior Tories". Your Local Guardian. Retrieved 22 May 2018.
  7. 1 2 "London Borough Council Elections 22 May 2014" (PDF). London Datastore. Greater London Authority. Retrieved 26 February 2015.