| |||||||||||||||||||||||||||||||||||||||||
All 60 seats for election to Bromley London Borough Council 31 seats needed for a majority | |||||||||||||||||||||||||||||||||||||||||
---|---|---|---|---|---|---|---|---|---|---|---|---|---|---|---|---|---|---|---|---|---|---|---|---|---|---|---|---|---|---|---|---|---|---|---|---|---|---|---|---|---|
Registered | 229,850 [1] | ||||||||||||||||||||||||||||||||||||||||
Turnout | 114,460, 49.80% [1] | ||||||||||||||||||||||||||||||||||||||||
| |||||||||||||||||||||||||||||||||||||||||
|
The 1990 Bromley Council election took place on 3 May 1990 to elect members of Bromley London Borough Council in London, England. The whole council was up for election and the Conservative party stayed in overall control of the council. [2]
This section is empty. You can help by adding to it. (March 2015) |
Party | Seats | Gains | Losses | Net gain/loss | Seats % | Votes % | Votes | +/− | |
---|---|---|---|---|---|---|---|---|---|
Conservative | 43 | 1 | 2 | 1 | 71.67 | 50.13 | 132,398 | ||
Labour | 11 | 1 | 0 | 1 | 18.33 | 23.80 | 62,856 | ||
Liberal Democrats | 6 [n 1] | 1 | 1 | 10.00 | 24.22 | 63,978 | |||
Green | 0 | 0 | 0 | 0.00 | 0.92 | 2,429 | |||
SDP | 0 | 0 | 0 | 0.00 | 0.65 | 1,708 | |||
Ind. Conservative | 0 | 0 | 0 | 0.00 | 0.28 | 741 | |||
Total | 60 | 264,110 |
(*) - Indicates an incumbent candidate
Party | Candidate | Votes | % | |
---|---|---|---|---|
Liberal Democrats | Christopher R. Gaster* | 1,873 | 43.64 | |
Liberal Democrats | William A.Mac. Maccormick | 1,679 | ||
Labour | Laurence G.M. Arterton | 1,544 | 35.63 | |
Labour | Mark C. Mason | 1,356 | ||
Conservative | David E. Burch | 571 | 12.92 | |
Conservative | Philip J. Haslop | 480 | ||
Green | Howard J. Fuller | 318 | 7.81 | |
Registered electors | 8,574 | |||
Turnout | 4,131 | 48.18 | ||
Rejected ballots | 5 | 0.12 | ||
Liberal Democrats hold | ||||
Party | Candidate | Votes | % | |
---|---|---|---|---|
Conservative | David M. Dear* | 3,212 | 62.23 | |
Conservative | Margaret D. Moir* | 3,174 | ||
Conservative | Simon J.C. Randall* | 3,109 | ||
Liberal Democrats | Michael D. Chuter | 1,137 | 22.10 | |
Lib Dem Focus Team | Keith G. Room | 1,129 | ||
Lib Dem Focus Team | Raymond P. Warner` | 1,107 | ||
Labour | Karen A. Benton | 805 | 15.67 | |
Labour | Michael J. D'Arcy | 799 | ||
Labour | Gwendoline I. Mansfield | 787 | ||
Registered electors | 10,482 | |||
Turnout | 5,297 | 50.53 | ||
Rejected ballots | 6 | 0.11 | ||
Conservative hold | ||||
Party | Candidate | Votes | % | |
---|---|---|---|---|
Conservative | David R. Haslam* | 2,092 | 56.40 | |
Conservative | Arthur R. Edgington* | 2,066 | ||
Liberal Democrats | Geoffrey C. Gostt | 845 | 22.36 | |
Lib Dem Focus Team | Robert F. Hatch | 802 | ||
Labour | Keith A. Galley | 620 | 16.82 | |
Labour | John C. Lewis | 620 | ||
SDP | Joan E. Welfare | 163 | 4.42 | |
Registered electors | 8,183 | |||
Turnout | 3,804 | 46.49 | ||
Rejected ballots | 5 | 0.13 | ||
Conservative hold | ||||
Party | Candidate | Votes | % | |
---|---|---|---|---|
Lib Dem Focus Team | Paul J.H. Booth* [n 2] | 2,876 | 43.41 | |
Conservative | Catherine A. Bustard | 2,514 | 41.26 | |
Lib Dem Focus Team | Anthony R. Phillips | 2,483 | ||
Conservative | John Hawes* | 2,465 | ||
Lib Dem Focus Team | Walter R. Shekyls | 2,407 | ||
Conservative | Rose M. Covell | 2,404 | ||
Labour | David R. Blackman | 980 | 15.33 | |
Labour | Mark Cole | 919 | ||
Labour | Stephen J. Mesure | 844 | ||
Registered electors | 12,612 | |||
Turnout | 6,388 | 50.65 | ||
Rejected ballots | 11 | 0.17 | ||
Lib Dem Focus Team hold | ||||
Conservative hold | ||||
Lib Dem Focus Team gain from Conservative | ||||
Party | Candidate | Votes | % | |
---|---|---|---|---|
Conservative | Reginald G. Adams* | 3,164 | 49.60 | |
Conservative | Judith E. Ellis | 3,090 | ||
Conservative | Julian P.G. Grainger | 3,035 | ||
Liberal Democrats | Martyn P. McLennan | 2,508 | 39.28 | |
Liberal Democrats | Justin D.C. Cockett | 2,425 | ||
Liberal Democrats | Violet M. Terrett | 2,424 | ||
Labour | Gillian A. Collins | 730 | 11.12 | |
Labour | Ernest A. Roberts | 687 | ||
Labour | David N. Humphreys | 665 | ||
Registered electors | 11,904 | |||
Turnout | 6,508 | 54.67 | ||
Rejected ballots | 8 | 0.12 | ||
Conservative hold | ||||
Conservative gain from Liberal Democrats | ||||
Conservative hold | ||||
Party | Candidate | Votes | % | |
---|---|---|---|---|
Conservative | Joan Bryant* | 3,855 | 65.14 | |
Conservative | Kathleen A. Boughey | 3,792 | ||
Conservative | Joan K. Wykes* | 3,717 | ||
Labour | Andrew R. Amos | 1,215 | 20.79 | |
Labour | Charles F. Phillips | 1,210 | ||
Labour | Paul E. Falkingham | 1,203 | ||
Liberal Democrats | John G. Kensit | 855 | 14.07 | |
Liberal Democrats | Peter H. Kreps | 817 | ||
Liberal Democrats | Ian M. Magrath | 783 | ||
Registered electors | 12,766 | |||
Turnout | 6,131 | 48.03 | ||
Rejected ballots | 10 | 0.16 | ||
Conservative hold | ||||
Party | Candidate | Votes | % | |
---|---|---|---|---|
Conservative | David J. Harding* | 1,695 | 38.62 | |
Labour | Nicholas D. Field | 1,475 | ||
Conservative | Geoffrey J. Winnard | 1,454 | 35.24 | |
Labour | Richard J. Jones | 1,398 | ||
Lib Dem Focus Team | Elisabeth Gee | 1,100 | 26.14 | |
Lib Dem Focus Team | Kathleen I. Milward | 1,031 | ||
Registered electors | 8,115 | |||
Turnout | 4,279 | 52.73 | ||
Rejected ballots | 11 | 0.26 | ||
Conservative hold | ||||
Labour gain from Conservative | ||||
Party | Candidate | Votes | % | |
---|---|---|---|---|
Conservative | Christopher J. Elgar* | 1,798 | 64.90 | |
Conservative | Charles G. Priest* | 1,674 | ||
Labour | Charlotte J.S. Atkins | 533 | 19.10 | |
Labour | Eric H. Turner | 489 | ||
Liberal Democrats | David A. Evans | 465 | 16.00 | |
Liberal Democrats | Jonathan R. Coninx | 391 | ||
Registered electors | 6,273 | |||
Turnout | 2,798 | 44.60 | ||
Rejected ballots | 6 | 0.21 | ||
Conservative hold | ||||
Party | Candidate | Votes | % | |
---|---|---|---|---|
Conservative | Paul M. Bonter* | 2,361 | 52.96 | |
Conservative | Peter Sturdy* | 2,359 | ||
Liberal Democrats | Gillian M. Chamarette | 1,455 | 32.43 | |
Liberal Democrats | Harry A. Silvester | 1,434 | ||
Labour | Geoffrey J. Ball | 553 | 11.78 | |
Labour | Neil Thomas | 497 | ||
SDP | Christopher W. Taylor | 126 | 2.83 | |
Registered electors | 8,250 | |||
Turnout | 4,597 | 55.72 | ||
Rejected ballots | 7 | 0.15 | ||
Conservative hold | ||||
Party | Candidate | Votes | % | |
---|---|---|---|---|
Conservative | Peter J. Bloomfield* | 1,343 | 73.15 | |
Labour | Sylvia M. Whitlock | 273 | 14.87 | |
Liberal Democrats | Malcolm B. Westbrook | 220 | 11.98 | |
Registered electors | 3,401 | |||
Turnout | 1,839 | 54.07 | ||
Rejected ballots | 3 | 0.16 | ||
Conservative hold | ||||
Party | Candidate | Votes | % | |
---|---|---|---|---|
Conservative | Francis J.D. Cooke* | 1,941 | 57.69 | |
Conservative | Albert G. Miles* | 1,844 | ||
Labour | Janice M. Cooke | 892 | 25.33 | |
Labour | Jeremiah M. Mondry | 769 | ||
Liberal Democrats | Jeremy V. Cope | 585 | 16.98 | |
Liberal Democrats | Mark Soady | 529 | ||
Registered electors | 7,376 | |||
Turnout | 3,448 | 46.75 | ||
Rejected ballots | 6 | 0.17 | ||
Conservative hold | ||||
Party | Candidate | Votes | % | |
---|---|---|---|---|
Conservative | Eric N. Goodman* | 2,393 | 68.45 | |
Conservative | Jennifer M. Hiller* | 2,348 | ||
Liberal Democrats | Constance S. Baker | 657 | 18.50 | |
Liberal Democrats | Eric A. Spencer | 625 | ||
Labour | Odette V. Coram | 458 | 13.05 | |
Labour | George A. Cox | 445 | ||
Registered electors | 7,306 | |||
Turnout | 3,611 | 49.42 | ||
Rejected ballots | 3 | 0.08 | ||
Conservative hold | ||||
Party | Candidate | Votes | % | |
---|---|---|---|---|
Conservative | Ernest D. Barkway* | 3,372 | 56.01 | |
Conservative | Philip G. Jones* | 3,211 | ||
Conservative | Nigel G. Kelsh* | 3,157 | ||
Labour | Daniel Carrigan | 1,056 | ||
Labour | Stephen J. Clarke | 1,044 | 17.46 | |
Labour | Roy D. Shufflebotham | 935 | ||
Liberal Democrats | Jennifer M. Fitch | 791 | 12.44 | |
Liberal Democrats | Catherine F. Stokes | 700 | ||
Liberal Democrats | Roy S.H. Southgate | 672 | ||
Green | Donald G. Baldwin | 562 | 9.69 | |
SDP | William I.H. Faulder | 255 | 4.40 | |
Registered electors | 11,179 | |||
Turnout | 5,570 | 49.83 | ||
Rejected ballots | 2 | 0.04 | ||
Conservative hold | ||||
Party | Candidate | Votes | % | |
---|---|---|---|---|
Conservative | Maurice J. Mason* | 2,397 | 70.56 | |
Conservative | Michael J. Tickner* | 2,356 | ||
Liberal Democrats | Hilary E-A Gaster | 548 | 15.76 | |
Liberal Democrats | Edward H. Whitaker | 514 | ||
Labour | Wheldon J. Roberts | 463 | 13.68 | |
Labour | Neil W. Entwistle | 459 | ||
Registered electors | 6,850 | |||
Turnout | 3,478 | 50.77 | ||
Rejected ballots | 17 | 0.49 | ||
Conservative hold | ||||
Party | Candidate | Votes | % | |
---|---|---|---|---|
Conservative | Richard D. Foister* | 1,498 | 39.09 | |
Conservative | John A.M. Lewis* | 1,455 | ||
Labour | Kenneth G.H. Ritchie | 1,182 | 30.31 | |
Labour | David L. Sawkins | 1,108 | ||
Lib Dem Focus Team | Peter White | 929 | 23.85 | |
Lib Dem Focus Team | Gerald A. Williams | 872 | ||
Green | James T.G. Strachan | 255 | 6.75 | |
Registered electors | 7,380 | |||
Turnout | 3,832 | 51.92 | ||
Rejected ballots | 1 | 0.03 | ||
Conservative hold | ||||
Party | Candidate | Votes | % | |
---|---|---|---|---|
Conservative | Philip T. Hollobone | 1,532 | 45.21 | |
Conservative | Anthony M. Wilkinson* | 1,431 | ||
Labour | Cecil R. Dean | 886 | 26.45 | |
Labour | Susan L. Yates | 847 | ||
Green | Ederyn Williams | 435 | 13.27 | |
Liberal Democrats | John R. Maydwell | 287 | 8.72 | |
Liberal Democrats | Gordon J. Stephens | 284 | ||
SDP | Terence E. Simpson | 208 | 6.35 | |
Registered electors | 7,375 | |||
Turnout | 3,204 | 43.44 | ||
Rejected ballots | 3 | 0.09 | ||
Conservative hold | ||||
Party | Candidate | Votes | % | |
---|---|---|---|---|
Labour | Ernest W. Dyer | 1,953 | 52.85 | |
Labour | Gordon T. Yates | 1,866 | ||
Conservative | Michael J. Hennessey | 1,201 | 33.23 | |
Liberal Democrats | Brian H. Taylor | 524 | 13.92 | |
Liberal Democrats | John R. Hassall | 481 | ||
Registered electors | 7,433 | |||
Turnout | 3,894 | 52.39 | ||
Rejected ballots | 8 | 0.21 | ||
Labour hold | ||||
Labour hold | ||||
Party | Candidate | Votes | % | |
---|---|---|---|---|
Liberal Democrats | Christopher S. Maines* | 2,011 | 51.34 | |
Liberal Democrats | Michael J. Norris* | 1,978 | ||
Conservative | Linda M. Archer | 1,142 | 28.05 | |
Conservative | Martin R. Reef | 1,038 | ||
Labour | Richard T. Harcourt | 825 | 20.61 | |
Labour | Grahame J. Kean | 777 | ||
Registered electors | 7,333 | |||
Turnout | 4,051 | 55.24 | ||
Rejected ballots | 7 | 0.17 | ||
Liberal Democrats hold | ||||
Party | Candidate | Votes | % | |
---|---|---|---|---|
Labour | Patricia Mansfield* [n 3] | 1,610 | 50.07 | |
Labour | Peter T. Fookes | 1,463 | ||
Conservative | Malcolm P. Hyland | 905 | 27.65 | |
Conservative | Khalid Sharif | 793 | ||
Green | Simonm P. Clayton | 376 | 12.25 | |
Liberal Democrats | Tina J. Boultbee | 327 | 10.03 | |
Liberal Democrats | Reginald W. Adams | 288 | ||
Registered electors | 7,408 | |||
Turnout | 3,150 | 42.52 | ||
Rejected ballots | 7 | 0.22 | ||
Labour hold | ||||
Labour hold | ||||
Party | Candidate | Votes | % | |
---|---|---|---|---|
Conservative | Joan Hatcher* | 3,797 | 52.86 | |
Conservative | Peter C. Woods | 3,666 | ||
Conservative | Anthony M. Owen* [n 4] | 3,589 | ||
Liberal Democrats | Jean K. Dearle | 1,216 | 16.71 | |
Liberal Democrats | Christopher R. Bratt | 1,186 | ||
Liberal Democrats | Jean F. Tinsley | 1,092 | ||
Labour | Rosalie Huzzard | 958 | 12.87 | |
Labour | Marcus R. Shellard | 872 | ||
Labour | Richard F. Watts | 860 | ||
Ind. Conservative | Brian V. Atkinson | 741 | 10.63 | |
Green | Heli I. Williams | 483 | 6.93 | |
Registered electors | 11,910 | |||
Turnout | 6,467 | 54.30 | ||
Rejected ballots | 4 | 0.06 | ||
Conservative hold | ||||
Party | Candidate | Votes | % | |
---|---|---|---|---|
Conservative | Raymond L. Ainsby | 2,926 | 56.03 | |
Conservative | Dorothy J. Laird* | 2,843 | ||
Conservative | Paul L. Jemetta | 2,797 | ||
Labour | Robert Armstrong | 1,343 | 25.36 | |
Labour | Michael T. King | 1,298 | ||
Labour | Nicholas A. Wright | 1,234 | ||
Liberal Democrats | Michael F. Deves | 959 | 18.61 | |
Liberal Democrats | William A. Scally | 944 | ||
Liberal Democrats | Lennard D. Woods | 941 | ||
Registered electors | 11,555 | |||
Turnout | 5,427 | 46.97 | ||
Rejected ballots | 15 | 0.28 | ||
Conservative hold | ||||
Party | Candidate | Votes | % | |
---|---|---|---|---|
Labour | John R. Holbrook* | 2,541 | 49.62 | |
Labour | Mark J. Smith* | 2,362 | ||
Labour | Susan A. Polydorou | 2,320 | ||
Conservative | Richard B. Jackson | 1,764 | 35.24 | |
Conservative | Timothy C. Stevens | 1,691 | ||
Conservative | Lionel H. O'Hara | 1,675 | ||
Liberal Democrats | Duncan K. Borrowman | 772 | 15.14 | |
Liberal Democrats | Elizabeth Lander | 742 | ||
Liberal Democrats | Robert R.V. Woollett | 692 | ||
Registered electors | 11,382 | |||
Turnout | 5,213 | 45.80 | ||
Rejected ballots | 9 | 0.17 | ||
Labour hold | ||||
Labour hold | ||||
Labour hold | ||||
Party | Candidate | Votes | % | |
---|---|---|---|---|
Labour | Selwyn H. Ward* | 2,350 | 41.07 | |
Labour | Colin Willetts | 2,312 | ||
Labour | Christopher A. Purnell | 2,195 | ||
Lib Dem Focus Team | Thomas W. Hawthorne | 2,083 | 36.31 | |
Lib Dem Focus Team | George H. Watson | 2,035 | ||
Lib Dem Focus Team | Stephen J. Wilson | 1,946 | ||
Conservative | Bernard J. Cobley | 1,273 | 22.62 | |
Conservative | Gladys P. Hobbs | 1,253 | ||
Conservative | Edna P. Bensaid | 1,250 | ||
Registered electors | 12,270 | |||
Turnout | 6,027 | 49.12 | ||
Rejected ballots | 10 | 0.17 | ||
Labour hold | ||||
Labour hold | ||||
Labour hold | ||||
Party | Candidate | Votes | % | |
---|---|---|---|---|
Conservative | John Charnley* | 2,699 | 68.61 | |
Conservative | Brian R. Reading* | 2,560 | ||
Liberal Democrats | Jane E. Green | 746 | 18.63 | |
Liberal Democrats | Olive M. Chapman | 682 | ||
Labour | Robert N. Hughes | 491 | 12.76 | |
Labour | Richard Seabrook | 486 | ||
Registered electors | 7,715 | |||
Turnout | 3,928 | 50.91 | ||
Rejected ballots | 8 | 0.20 | ||
Conservative hold | ||||
Party | Candidate | Votes | % | |
---|---|---|---|---|
Conservative | Montague I. Blazey* | 2,184 | 64.98 | |
Conservative | Brian C. Humphrys* | 2,175 | ||
Lib Dem Briefing Team | Graham F.K. Radford | 715 | 20.77 | |
Lib Dem Briefing Team | Peter N. Ward | 679 | ||
Labour | Russell L. Miller | 492 | 14.25 | |
Labour | Richard Richards | 463 | ||
Registered electors | 7,054 | |||
Turnout | 3,470 | 49.19 | ||
Rejected ballots | 7 | 0.20 | ||
Conservative hold | ||||
Party | Candidate | Votes | % | |
---|---|---|---|---|
Conservative | Kenneth V. Crask* | 2,452 | 64.12 | |
Conservative | John F.I. Gray* | 2,366 | ||
Labour | Jean F. Gibbons | 527 | 13.84 | |
Labour | Peter W. Rance | 512 | ||
SDP | Richard J. Cox | 492 | 12.72 | |
SDP | Richard H. Redden | 464 | ||
Liberal Democrats | Clive J. Barton | 360 | 9.32 | |
Liberal Democrats | Susan J. Ford | 340 | ||
Registered electors | 7,764 | |||
Turnout | 3,918 | 50.46 | ||
Rejected ballots | 5 | 0.13 | ||
Conservative hold | ||||
Elections to Southwark Council were held in May 1990. The whole council was up for election. Turnout was 40.54%.
Elections to Tower Hamlets London Borough Council were held on 3 May 1990. The whole council was up for election. Turnout was 42.9%.
The 1990 Camden Council election took place on 3 May 1990 to elect members of Camden London Borough Council in London, England. The whole council was up for election. Labour comfortably stayed in overall control of the council, despite the Conservatives gaining three seats at their expense in Swiss Cottage. The Green Party came third in vote share with 13% of the vote, but won no seats.
The 1990 Barnet Council election took place on 3 May 1990 to elect members of Barnet London Borough Council in London, England. The whole council was up for election and the Conservative party stayed in overall control of the council.
The 1990 Bexley Council election took place on 3 May 1990 to elect members of Bexley London Borough Council in London, England. The whole council was up for election and the Conservative Party stayed in overall control of the council.
The 1990 Brent Council election took place on 3 May 1990 to elect members of Brent London Borough Council in London, England. The whole council was up for election and the council went in no overall control.
The 1990 Croydon Council election took place on 3 May 1990 to elect members of Croydon London Borough Council in London, England. The whole council was up for election and the Conservative party stayed in overall control of the council.
The 1990 Ealing Council election took place on 3 May 1990 to elect members of Ealing London Borough Council in London, England. The whole council was up for election and the Conservative party gained overall control of the council.
The 1990 Greenwich Council election took place on 3 May 1990 to elect members of Greenwich London Borough Council in London, England. The whole council was up for election and the Labour party stayed in overall control of the council.
The 1990 Hammersmith and Fulham Council election took place on 3 May 1990 to elect members of Hammersmith and Fulham London Borough Council in London, England. The whole council was up for election and the Labour party stayed in overall control of the council.
The 1990 Harrow Council election took place on 3 May 1990 to elect members of Harrow London Borough Council in London, England. The whole council was up for election and the Conservative party stayed in overall control of the council.
The 1990 Havering Council election took place on 3 May 1990 to elect members of Havering London Borough Council in London, England. The whole council was up for election and the council stayed in no overall control.
The 1990 Hillingdon Council election tooklace on 3 May 1990 to elect members of Hillingdon London Borough Council in London, Englaland. The whole council was up for election and the Conservative Party gained overall control of the council.
The 1990 Hounslow Council election took place on 3 May 1990 to elect members of Hounslow London Borough Council in London, England. The whole council was up for election and the Labour party stayed in overall control of the council.
The 1990 Redbridge Council election took place on 3 May 1990 to elect members of Redbridge London Borough Council in London, England. The whole council was up for election and the Conservative party stayed in overall control of the council.
The 1990 Richmond upon Thames Borough Council election took place on 3 May 1990 to elect members of Richmond upon Thames London Borough Council in London, England. The whole council was up for election and the Liberal Democrats stayed in overall control of the council.
The 1990 Waltham Forest Council election took place on 3 May 1990 to elect members of Waltham Forest London Borough Council in London, England. The whole council was up for election and the Labour party stayed in overall control of the council.
The 1990 Wandsworth Council election took place on 3 May 1990 to elect members of Wandsworth London Borough Council in London, England. The whole council was up for election and the Conservative Party stayed in overall control of the council.
The 1990 Westminster Council election took place on 3 May 1990 to elect members of Westminster City Council in London, England. The whole council was up for election and the Conservative Party stayed in overall control of the council.
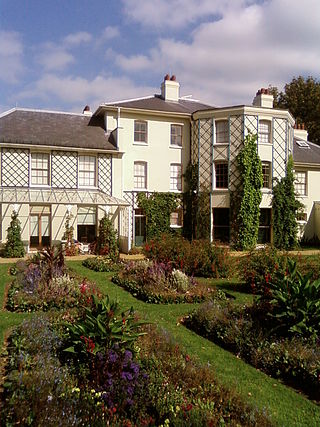
Darwin is an electoral ward in the London Borough of Bromley. The ward has existed since the creation of the borough on 1 April 1965 and was first used in the 1964 elections. It returns one councillor to Bromley London Borough Council. To date, the ward has only been represented by the Conservative Party. The ward covers the most rural part of the borough consisting a number of hamlets. It is the largest electoral ward in Greater London. As originally created in 1965 it included Downe, Cudham, Luxted, Single Street, Berry's Green, Horns Green and Knockholt. Leaves Green, Pratt's Bottom and South Street have also formed part of the ward at certain times. Since 2022 it has covered an area of 32.74 square kilometres (12.64 sq mi). The current elected political party's website for 2022, (Conservative), states that the Ward is the most southerly Ward within the London Borough of Bromley. And, that it comprisies Downe, Cudham, Leaves Green, Leavesden Estate, Westerham Hill, Beechwood, and Pratts Bottom.