| ||||||||||||||||||||||||||||||||||||||||||||||||||||||||||||||||||||||||
All 48 council seats up for election to Barking and Dagenham London Borough Council 25 seats needed for a majority | ||||||||||||||||||||||||||||||||||||||||||||||||||||||||||||||||||||||||
---|---|---|---|---|---|---|---|---|---|---|---|---|---|---|---|---|---|---|---|---|---|---|---|---|---|---|---|---|---|---|---|---|---|---|---|---|---|---|---|---|---|---|---|---|---|---|---|---|---|---|---|---|---|---|---|---|---|---|---|---|---|---|---|---|---|---|---|---|---|---|---|---|
Registered | 104,676 [1] | |||||||||||||||||||||||||||||||||||||||||||||||||||||||||||||||||||||||
Turnout | 40,402, 38.60% [1] | |||||||||||||||||||||||||||||||||||||||||||||||||||||||||||||||||||||||
| ||||||||||||||||||||||||||||||||||||||||||||||||||||||||||||||||||||||||
|
The 1990 Barking and Dagenham Borough Council election took place on 3 May 1990 to elect members of Barking and Dagenham London Borough Council in London, England. The whole council was up for election and the Labour Party stayed overwhelmingly in overall control of the council. [2]
102 candidates nominated in total. Labour again ran a full slate and was the only party to do so. By contrast the Conservative Party ran only 33 candidates whilst the Liberal Democrats and the Liberal Democratic Focus Team ran a combined 17.
Labour continued to win the overwhelming majority of seats - 44 out of 48. The Residents Association held their 3 seats. The Liberal Democratic Focus Team won 1 seat.
Party | Seats | Gains | Losses | Net gain/loss | Seats % | Votes % | Votes | +/− | |
---|---|---|---|---|---|---|---|---|---|
Labour | 44 | 7 | 0 | 7 | 91.7 | 73.5 | 69,223 | ||
Residents | 3 | 0 | 0 | 6.2 | 4.5 | 4,272 | |||
Liberal Democrats | 1 [n 1] | 0 | 3 | 3 | 2.1 | 7.8 | 7,372 | ||
Conservative | 0 | 0 | 3 | 3 | 0.0 | 14.0 | 13,233 | ||
Ind. Lib Dem | 0 | 0 | 1 | 1 | 0.0 | 0.1 | 74 | ||
Communist | 0 | 0 | 0 | 0.0 | 0.1 | 66 | |||
Total | 48 | 94,240 |
(*) - Indicates an incumbent candidate
(†) - Indicates an incumbent candidate standing in a different ward
Party | Candidate | Votes | % | ±% | |
---|---|---|---|---|---|
Labour | Terence Bird* | 1,678 | 64.3 | -9.4 | |
Labour | Graham Bramley* | 1,581 | |||
Labour | Mohammed Fani* [n 2] | 1,449 | |||
Conservative | Danielle Flynn | 454 | 18.6 | +2.1 | |
Liberal Democrats | Robert Porter | 417 | 17.1 | -3.0 | |
Rejected ballots | 11 | 0.4 | N/A | ||
Turnout | 2,455 | 35.2 | -1.9 | ||
Registered electors | 6,983 | ||||
Labour hold | Swing | ||||
Party | Candidate | Votes | % | ±% | |
---|---|---|---|---|---|
Labour | Ernest White* | 1,283 | 79.3 | +7.4 | |
Labour | Trevor Watson | 1,259 | |||
Conservative | Leonard Pullen | 211 | 12.7 | +0.6 | |
Conservative | Lillian Pullen | 197 | |||
Liberal Democrats | John Kelly | 127 | 7.9 | -4.2 | |
Rejected ballots | 3 | 0.2 | |||
Turnout | 1,697 | 37.5 | +5.6 | ||
Registered electors | 4,526 | ||||
Labour hold | Swing | ||||
Party | Candidate | Votes | % | ±% | |
---|---|---|---|---|---|
Labour | Mable Arnold | 2,024 | 85.9 | +5.7 | |
Labour | Wendola Bomberg | 1,853 | |||
Labour | Ronald Whitbread† [n 3] | 1,842 | |||
Conservative | Charles Bond | 361 | 14.1 | -5.7 | |
Conservative | David Izzard | 263 | |||
Rejected ballots | 11 | 0.4 | N/A | ||
Turnout | 2,558 | 36.8 | +5.2 | ||
Registered electors | 6,958 | ||||
Labour hold | Swing | ||||
Party | Candidate | Votes | % | ±% | |
---|---|---|---|---|---|
Residents | Albert Gibbs* | 1,456 | 51.8 | -18.7 | |
Residents | Raymond Gowland* | 1,456 | |||
Residents | Robert Jeyes* | 1,360 | |||
Labour | Violet Gasson | 1,120 | 36.4 | +6.9 | |
Labour | Hilda Jones | 942 | |||
Labour | Julie West | 938 | |||
Conservative | David Jackson | 353 | 11.9 | N/A | |
Conservative | Karen Smith | 328 | |||
Conservative | Nicholas Smith | 298 | |||
Rejected ballots | 2 | 0.1 | N/A | ||
Turnout | 2,913 | 42.3 | +4.7 | ||
Registered electors | 6,881 | ||||
Residents hold | Swing | ||||
Party | Candidate | Votes | % | ±% | |
---|---|---|---|---|---|
Labour | Richard Blackburn* | 1,860 | 80.1 | +21.2 | |
Labour | Frederick Tibble* | 1,804 | |||
Labour | Lawrence Bunn* | 1,758 | |||
Conservative | Malcolm Beatty | 485 | 19.9 | +2.6 | |
Conservative | Reginald Williams | 436 | |||
Conservative | Charles McGinley | 428 | |||
Rejected ballots | 4 | 0.2 | N/A | ||
Turnout | 2,478 | 35.6 | +3.0 | ||
Registered electors | 6,963 | ||||
Labour hold | Swing | ||||
Party | Candidate | Votes | % | ±% | |
---|---|---|---|---|---|
Labour | Patrick Manley | 1,240 | 52.7 | +11.4 | |
Labour | Gordon Mayor | 1,131 | |||
Lib Dem Focus Team | Stephen Churchman* | 922 | 37.8 | -20.9 | |
Lib Dem Focus Team | Daniel Felton | 780 | |||
Conservative | Peter Burch | 151 | 6.3 | N/A | |
Conservative | Robert Whitton | 131 | |||
Ind. Lib Dem | David Smith* | 74 | 3.3 | N/A | |
Rejected ballots | 3 | 0.1 | N/A | ||
Turnout | 2,378 | 51.6 | -0.4 | ||
Registered electors | 4,607 | ||||
Labour gain from Lib Dem Focus Team | Swing | ||||
Labour gain from Ind. Lib Dem | Swing | ||||
Party | Candidate | Votes | % | ±% | |
---|---|---|---|---|---|
Labour | Frederick Jones* | 1,956 | 85.4 | +14.4 | |
Labour | Raymond Parkin* [n 4] | 1,827 | |||
Labour | John Thomas* | 1,799 | |||
Conservative | Robert Brownless | 277 | 11.6 | -12.8 | |
Conservative | Edward Holt | 256 | |||
Conservative | William Whiter | 225 | |||
Communist | Alfred Ott | 66 | 3.0 | -1.6 | |
Rejected ballots | 11 | 0.5 | N/A | ||
Turnout | 2,380 | 35.9 | +6.6 | ||
Registered electors | 6,620 | ||||
Labour hold | Swing | ||||
Party | Candidate | Votes | % | ||
---|---|---|---|---|---|
Labour | Jeanette Alexander | 1,152 | 51.88 | ||
Lib Dem Focus Team | Ronwen Beadle* | 1,118 | 48.12 | ||
Labour | Simon Bremner | 1,055 | |||
Labour | Kathleen Flint | 1,023 | |||
Lib Dem Focus Team | Alan Cooper* | 959 | |||
Lib Dem Focus Team | Elaine Lloyd | 920 | |||
Registered electors | 6,151 | ||||
Turnout | 2,308 | 37.52 | |||
Rejected ballots | 2 | 0.1 | N/A | ||
Labour gain from Lib Dem Focus Team | Swing | ||||
Lib Dem Focus Team hold | Swing | ||||
Labour gain from Lib Dem Focus Team | Swing | ||||
Party | Candidate | Votes | % | ||
---|---|---|---|---|---|
Labour | Alan Thomas* | 1,546 | 78.03 | ||
Labour | Terence Power | 1,507 | |||
Conservative | Ivy Blanchard | 226 | 11.55 | ||
Liberal Democrats | Roger Sparrow | 204 | 10.42 | ||
Registered electors | 4,950 | ||||
Turnout | 1,869 | 37.76 | |||
Rejected ballots | 0 | 0.0 | N/A | ||
Labour hold | |||||
Labour hold | |||||
Party | Candidate | Votes | % | ||
---|---|---|---|---|---|
Labour | Charles Fairbrass* | 1,994 | 80.97 | ||
Labour | Sidney Kallar | 1,832 | |||
Labour | John Lawrence* | 1,830 | |||
Conservative | Sharon Keefe | 491 | 19.03 | ||
Conservative | Joan Preston | 423 | |||
Conservative | William Preston | 414 | |||
Registered electors | 7,157 | ||||
Turnout | 2,585 | 36.12 | |||
Rejected ballots | 15 | 0.6 | N/A | ||
Labour hold | Swing | ||||
Party | Candidate | Votes | % | ||
---|---|---|---|---|---|
Labour | Robin Dixon | 1,398 | 47.16 | ||
Labour | June van Roten | 1,318 | |||
Labour | Nirmal Gill | 1,290 | |||
Conservative | Brian Cook* | 1,264 | 43.27 | ||
Conservative | Janice Izzard* | 1,228 | |||
Conservative | John Seaman* | 1,184 | |||
Lib Dem Focus Team | Brian Beadle | 304 | 9.57 | ||
Liberal Democrats | Jayne Cooper | 264 | |||
Lib Dem Focus Team | Richard Felton | 246 | |||
Registered electors | 6,935 | ||||
Turnout | 3,038 | 43.81 | |||
Rejected ballots | 7 | 0.2 | N/A | ||
Labour gain from Conservative | Swing | ||||
Party | Candidate | Votes | % | ||
---|---|---|---|---|---|
Labour | Alistair Hannah-Rogers* | 1,550 | 80.61 | ||
Labour | Rita Hannah-Rogers | 1,483 | |||
Conservative | Kay Needham | 232 | 11.69 | ||
Conservative | Marcus Needham | 207 | |||
Liberal Democrats | Peter Downs | 145 | 7.70 | ||
Registered electors | 4,732 | ||||
Turnout | 1,915 | 40.47 | |||
Rejected ballots | 0 | 0.0 | N/A | ||
Labour hold | Swing | ||||
Party | Candidate | Votes | % | ||
---|---|---|---|---|---|
Labour | Maureen Worby* [n 5] | 785 | 83.33 | ||
Conservative | Ernest Blackborow | 157 | 16.67 | ||
Registered electors | 2,114 | ||||
Turnout | 947 | 44.80 | |||
Rejected ballots | 4 | 0.4 | N/A | ||
Labour hold | Swing | ||||
Party | Candidate | Votes | % | ||
---|---|---|---|---|---|
Labour | John Dias-Broughton* | 1,506 | 72.44 | ||
Labour | Brian Walker* | 1,490 | |||
Conservative | Barry Taylor | 323 | 15.62 | ||
Liberal Democrats | Wendy Churchman | 247 | 11.94 | ||
Registered electors | 5,109 | ||||
Turnout | 1,992 | 38.99 | |||
Rejected ballots | 6 | 0.3 | N/A | ||
Labour hold | Swing | ||||
Party | Candidate | Votes | % | ||
---|---|---|---|---|---|
Labour | John Wainwright* | 1,224 | 80.33 | ||
Labour | Inder Jamu* [n 6] | 1,103 | |||
Conservative | John Dutton | 296 | 19.67 | ||
Conservative | Peter Dutton | 273 | |||
Registered electors | 4,885 | ||||
Turnout | 1,621 | 33.18 | |||
Rejected ballots | 9 | 0.6 | N/A | ||
Labour hold | Swing | ||||
Party | Candidate | Votes | % | ||
---|---|---|---|---|---|
Labour | George Shaw | 1,714 | 89.8 | ||
Labour | Royston Patient | 1,680 | |||
Liberal Democrats | Samuel Hodge | 193 | 10.2 | ||
Registered electors | 4,564 | ||||
Turnout | 1,913 | 41.91 | |||
Rejected ballots | 9 | 0.5 | N/A | ||
Labour hold | Swing | ||||
Party | Candidate | Votes | % | ||
---|---|---|---|---|---|
Labour | George Brooker | 2,052 | 71.56 | ||
Labour | John Davis | 1,885 | |||
Labour | Cameron Geddes | 1,672 | |||
Conservative | Leonard Dutton | 441 | 16.88 | ||
Liberal Democrats | David Evans | 302 | 11.56 | ||
Registered electors | 6,993 | ||||
Turnout | 2,703 | 38.65 | |||
Rejected ballots | 0 | 0.0 | N/A | ||
Labour hold | Swing | ||||
Party | Candidate | Votes | % | ||
---|---|---|---|---|---|
Labour | Jean Bruce* | Unopposed | |||
Labour | Leonard Collins* | Unopposed | |||
Labour | Bryan Osborn* | Unopposed | |||
Registered electors | 6,930 [n 7] | ||||
Turnout | 0 | 0.00 | |||
Rejected ballots | 0 | 0.0 | N/A | ||
Labour hold | Swing | ||||
Party | Candidate | Votes | % | ||
---|---|---|---|---|---|
Labour | Darrin Best | 1,956 | 75.36 | ||
Labour | Katherine Golden | 1,920 | |||
Labour | William Dale | 1,914 | |||
Conservative | Kenneth Coombs | 457 | 15.89 | ||
Conservative | Terence Mallindine | 396 | |||
Conservative | Royston Oliver | 367 | |||
Liberal Democrats | Carole Sparrow | 224 | 8.75 | ||
Registered electors | 7,448 | ||||
Turnout | 2,652 | 35.61 | |||
Rejected ballots | 5 | 0.2 | N/A | ||
Labour hold | Swing | ||||
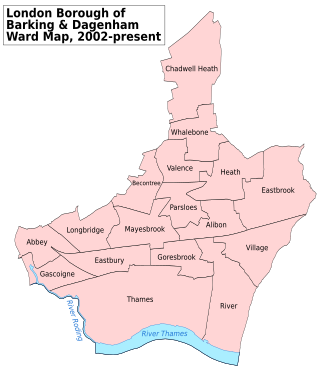
Barking and Dagenham London Borough Council in London, England is elected every four years. Since the last boundary changes in 2022 the council has comprised 51 councillors representing 19 wards, with each ward electing two or three councillors. Elections are held every four years.
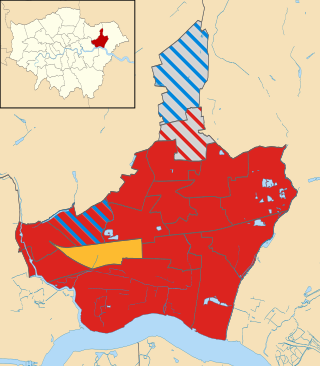
Elections for Barking and Dagenham London Borough Council, UK were held on 2 May 2002 to elect members to the council. All seats were up for election following boundary changes since the last election in 1998. The Labour Party kept overall control of the council, but lost 5 seats. Overall turnout was 22.76%.
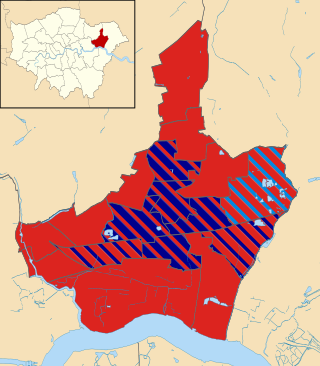
Elections for Barking and Dagenham London Borough Council were held on Thursday 4 May 2006. The whole council was up for election. Barking and Dagenham is split up into 17 wards, each electing 3 councillors, so a total of 51 seats were up for election.
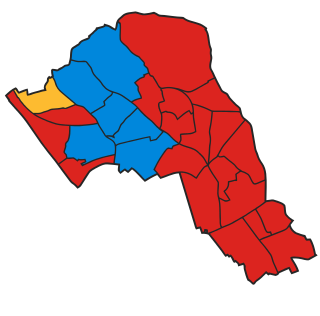
The 2010 Barking and Dagenham Council election took place on 6 May 2010 to elect members of Barking and Dagenham London Borough Council in London, England.
Elections to Tower Hamlets London Borough Council were held on 5 May 1994. The whole council was up for election and the Labour party gained overall control of the council from the Liberal Democrats.
The 1990 Newham London Borough Council election to the Newham London Borough Council was held on 3 May 1990. The whole council was up for election. turnout no change was 33.0%. Labour maintained its overwhelming majority.
Elections to Tower Hamlets London Borough Council were held on 3 May 1990. The whole council was up for election. Turnout was 42.9%.
The 1990 Camden Council election took place on 3 May 1990 to elect members of Camden London Borough Council in London, England. The whole council was up for election. Labour comfortably stayed in overall control of the council, despite the Conservatives gaining three seats at their expense in Swiss Cottage. The Green Party came third in vote share with 13% of the vote, but won no seats.
The 1982 Barking and Dagenham Borough Council election took place on 6 May 1982 to elect members of Barking and Dagenham London Borough Council in London, England. The whole council was up for election and the Labour Party stayed in overall control of the council.
The 1986 Barking and Dagenham Borough Council election took place on 8 May 1986 to elect members of Barking and Dagenham London Borough Council in London, England. The whole council was up for election and the Labour Party stayed in overall control of the council.
The 1994 Barking and Dagenham Borough Council election took place on 5 May 1994 to elect members of Barking and Dagenham London Borough Council in London, England. The whole council was up for election and the Labour Party stayed in overall control of the council.
The 1990 Bexley Council election took place on 3 May 1990 to elect members of Bexley London Borough Council in London, England. The whole council was up for election and the Conservative Party stayed in overall control of the council.
The 1990 Brent Council election took place on 3 May 1990 to elect members of Brent London Borough Council in London, England. The whole council was up for election and the council went in no overall control.
The 1990 Bromley Council election took place on 3 May 1990 to elect members of Bromley London Borough Council in London, England. The whole council was up for election and the Conservative party stayed in overall control of the council.
The 1990 Croydon Council election took place on 3 May 1990 to elect members of Croydon London Borough Council in London, England. The whole council was up for election and the Conservative party stayed in overall control of the council.
The 1990 Ealing Council election took place on 3 May 1990 to elect members of Ealing London Borough Council in London, England. The whole council was up for election and the Conservative party gained overall control of the council.
The 1990 Hackney Council election took place on 3 May 1990 to elect members of Hackney London Borough Council in London, England. The whole council was up for election and the council remained controlled by Labour.
The 1990 Hammersmith and Fulham Council election took place on 3 May 1990 to elect members of Hammersmith and Fulham London Borough Council in London, England. The whole council was up for election and the Labour party stayed in overall control of the council.
The 1990 Havering Council election took place on 3 May 1990 to elect members of Havering London Borough Council in London, England. The whole council was up for election and the council stayed in no overall control.
The 1994 Sutton Council election took place on 5 May 1994 to elect members of Sutton London Borough Council in London, England. The whole council was up for election and the Liberal Democrats stayed in overall control of the council.