| |||||||||||||||||||||||||||||||||||||||||
All 70 seats, in 27 wards in the London Borough of Croydon 36 seats needed for a majority | |||||||||||||||||||||||||||||||||||||||||
---|---|---|---|---|---|---|---|---|---|---|---|---|---|---|---|---|---|---|---|---|---|---|---|---|---|---|---|---|---|---|---|---|---|---|---|---|---|---|---|---|---|
Registered | 232,371 [1] | ||||||||||||||||||||||||||||||||||||||||
Turnout | 106,375 [1] | ||||||||||||||||||||||||||||||||||||||||
| |||||||||||||||||||||||||||||||||||||||||
Map of the results of the 1990 Croydon Council election. | |||||||||||||||||||||||||||||||||||||||||
|
The 1990 Croydon Council election took place on 3 May 1990 to elect members of Croydon London Borough Council in London, England. The whole council was up for election and the Conservative party stayed in overall control of the council.
This section is empty. You can help by adding to it. (March 2015) |
Party | Seats | Gains | Losses | Net gain/loss | Seats % | Votes % | Votes | +/− | |
---|---|---|---|---|---|---|---|---|---|
Conservative | 41 | 1 | 4 | 3 | 58.57 | 50.16 | 132,462 | ||
Labour | 29 | 4 | 1 | 3 | 41.43 | 37.73 | 99,639 | ||
Liberal Democrats | 0 | 0 | 0 | 0.00 | 9.08 | 23,982 | |||
Green | 0 | 0 | 0 | 0.00 | 2.15 | 5,679 | |||
Residents | 0 | 0 | 0 | 0.00 | 0.66 | 1,745 | |||
SDP | 0 | 0 | 0 | 0.00 | 0.19 | 501 | |||
Peoples Choice | 0 | 0 | 0 | 0.00 | 0.03 | 79 | |||
Total | 70 | 264,087 |
41 | 29 |
Con | Labour |
Party | Candidate | Votes | % | |
---|---|---|---|---|
Labour Co-op | Jeremy P. Fitzpatrick | 2,241 | ||
Labour Co-op | Nancy T. Irwin | 2,219 | ||
Conservative | Richard J. Billington | 2,088 | ||
Labour Co-op | Martin D. Walker | 2,073 | ||
Conservative | Desmond J. Wright | 2,009 | ||
Conservative | Robert T.L. Vaudry | 1,941 | ||
Green | Patricia A. Matthews | 478 | ||
Green | Christopher J. Reeves | 424 | ||
Liberal Democrats | Patricia F. West | 414 | ||
Registered electors | 10,073 | |||
Turnout | 4,967 | 49.31 | ||
Rejected ballots | 9 | 0.18 | ||
Labour Co-op hold | ||||
Conservative gain from Labour Co-op | ||||
Party | Candidate | Votes | % | |
---|---|---|---|---|
Conservative | Edwin S. Arram | 1,640 | ||
Conservative | April E.M. Slipper | 1,529 | ||
Labour | Richard M. Plackett | 1,157 | ||
Labour | Brendan F. Dooley | 1,117 | ||
Green | Betty G. Browning | 371 | ||
Liberal Democrats | Paul F. West | 332 | ||
Turnout | 3,308 | 49.9 | ||
Registered electors | ||||
Conservative hold | ||||
Party | Candidate | Votes | % | |
---|---|---|---|---|
Labour Co-op | Paul R. Mee | 2,569 | ||
Labour Co-op | Helen S. Salmon | 2,566 | ||
Labour Co-op | Alison J. Roberts | 2,556 | ||
Conservative | Roger C. Taylor | 1,505 | ||
Conservative | Brian D. Shackle | 1,422 | ||
Conservative | Antony N. Youd | 1,337 | ||
Turnout | ||||
Registered electors | ||||
Labour Co-op hold | ||||
Party | Candidate | Votes | % | |
---|---|---|---|---|
Conservative | Michael D. Fisher | 1,442 | ||
Conservative | Steven L. Hollands | 1,413 | ||
Labour | Ruth McNerney | 1,342 | ||
Labour | David Turner | 1,177 | ||
Liberal Democrats | Leo C. E. Held | 244 | ||
Green | Laura M. Hooton | 225 | ||
Turnout | ||||
Registered electors | ||||
Conservative hold | ||||
Party | Candidate | Votes | % | |
---|---|---|---|---|
Labour Co-op | Rodney G. D. Matlock | 2,019 | ||
Labour Co-op | Anthony J. Slatcher | 1,926 | ||
Labour Co-op | Peter L. Spalding | 1,896 | ||
Conservative | Kelly Ellender | 1,004 | ||
Conservative | Mohammed I. Khokhar | 804 | ||
Conservative | Yvonne E. Singh | 785 | ||
Turnout | ||||
Registered electors | ||||
Labour Co-op gain from Labour | ||||
Party | Candidate | Votes | % | |
---|---|---|---|---|
Conservative | Christopher Wright | 2,562 | ||
Conservative | Susan T. Taylor | 2,512 | ||
Conservative | Andrew J. Pelling | 2,478 | ||
Liberal Democrats | Ian R. Atkins | 1,185 | ||
Liberal Democrats | John P. Callen | 1,114 | ||
Liberal Democrats | Hugh Pierce | 1,091 | ||
Labour | Sandra Connelly | 641 | ||
Labour | Margaret Conway | 625 | ||
Labour | Ian G. Payne | 600 | ||
Green | Angela M. Marshall | 413 | ||
Turnout | ||||
Registered electors | ||||
Conservative hold | ||||
Party | Candidate | Votes | % | |
---|---|---|---|---|
Conservative | Ian Croft | 2,813 | ||
Conservative | Peter S. Bowness | 2,750 | ||
Conservative | John P.B. Hecks | 2,656 | ||
Liberal Democrats | Michael T.A. Bishopp | 1,396 | ||
Liberal Democrats | Christopher G. Peacock | 1,351 | ||
Liberal Democrats | Roger D. George | 1,322 | ||
Labour | Patrick D. Holt | 727 | ||
Labour | Lydia E. Sookias | 613 | ||
Labour | Michael G. Ryan | 612 | ||
Green | Michael Spencer-Bowdage | 367 | ||
Peoples Choice | Mark R.L. Samuel | 79 | ||
Turnout | 5,103 | 50.8 | ||
Registered electors | 10,055 | |||
Conservative hold | ||||
Party | Candidate | Votes | % | |
---|---|---|---|---|
Conservative | John L. Aston | 2,943 | ||
Conservative | Robert W. Coatman | 2,848 | ||
Conservative | Michael D. Wunn | 2,677 | ||
Labour | Maria T. Dennis | 1,365 | ||
Labour | Joanna M. Moriarty | 1,328 | ||
Labour | John P. Golden | 1,292 | ||
Green | William T. Matthews | 514 | ||
Liberal Democrats | Philip H. Barron | 481 | ||
Liberal Democrats | John M. Jefkins | 361 | ||
Liberal Democrats | Roger W. Stephens | 351 | ||
SDP | Norman Harris | 257 | ||
SDP | Ian Dixie | 244 | ||
Turnout | ||||
Registered electors | ||||
Conservative hold | ||||
Party | Candidate | Votes | % | |
---|---|---|---|---|
Labour Co-op | James L. Walker | 1,558 | ||
Labour Co-op | Mary M. Walker | 1,397 | ||
Conservative | John R. Miller | 564 | ||
Conservative | Roy T. Miller | 498 | ||
Turnout | ||||
Registered electors | ||||
Labour Co-op hold | ||||
Party | Candidate | Votes | % | |
---|---|---|---|---|
Conservative | Mary M. H. Horden | 2,854 | ||
Conservative | Margaret V. Mead | 2,787 | ||
Conservative | Nicholas E. V. Perry | 2,780 | ||
Labour | Mark Chapman | 990 | ||
Labour | Leslie Campion | 966 | ||
Labour | Nicholas T. Waters | 876 | ||
Green | Jennifer A. Hayward | 559 | ||
Turnout | ||||
Registered electors | ||||
Conservative hold | ||||
Party | Candidate | Votes | % | |
---|---|---|---|---|
Conservative | Alan K. Carey | 1,902 | ||
Conservative | Brian G. Smith | 1,753 | ||
Liberal Democrats | Leonard A. Wright | 471 | ||
Liberal Democrats | William J. Brewer | 432 | ||
Labour | David P. Price | 417 | ||
Labour | David R. Evans | 408 | ||
Green | Hazel Veeder | 227 | ||
Turnout | ||||
Registered electors | ||||
Conservative hold | ||||
Party | Candidate | Votes | % | |
---|---|---|---|---|
Conservative | Audrey F. F. Cutbill | 2,710 | ||
Conservative | Derek R. Loughborough | 2,629 | ||
Labour | David L. Davis | 1,060 | ||
Labour | Marie E. Henderson | 984 | ||
Green | John P. Lilly | 385 | ||
Turnout | ||||
Registered electors | ||||
Conservative hold | ||||
Party | Candidate | Votes | % | |
---|---|---|---|---|
Labour | Brenda P. Kirkby | 2,068 | ||
Labour Co-op | Roger M. Burgess | 1,809 | ||
Labour Co-op | Geraint R. Davies | 1,707 | ||
Conservative | Maurice H. Piper | 890 | ||
Conservative | Alison J. Davis | 845 | ||
Conservative | Jeremy Williams | 773 | ||
Turnout | ||||
Registered electors | ||||
Labour hold | ||||
Labour Co-op hold | ||||
Party | Candidate | Votes | % | |
---|---|---|---|---|
Conservative | Lindsay R. Hodges | 2,162 | ||
Conservative | Colin Johnston | 2,157 | ||
Conservative | Bryan J. Kendall | 2,127 | ||
Labour | Nicholas B. Barnes | 2,081 | ||
Labour | Stuart A. Collins | 2,070 | ||
Labour | Michael D. Petrou | 1,888 | ||
Liberal Democrats | David Armer | 491 | ||
Liberal Democrats | Pamela E. Freeman | 480 | ||
Turnout | ||||
Registered electors | ||||
Conservative hold | ||||
Party | Candidate | Votes | % | |
---|---|---|---|---|
Conservative | Peter J. F. Macdonald | 2,869 | ||
Conservative | Derek G. Millard | 2,831 | ||
Conservative | David L. Congdon | 2,812 | ||
Liberal Democrats | Pamela A. Randall | 877 | ||
Liberal Democrats | Graham P. Wickham | 802 | ||
Residents | Cathryn Sansom | 797 | ||
Labour | Stephen Baister | 725 | ||
Liberal Democrats | Mark Thomas Steward | 695 | ||
Labour | Patricia A. Waters | 689 | ||
Labour | William E. J. Richardson | 654 | ||
Green | Bhavani Chellappah | 453 | ||
Turnout | ||||
Registered electors | ||||
Conservative hold | ||||
Party | Candidate | Votes | % | |
---|---|---|---|---|
Labour | Alan Buckfield | 1,488 | ||
Labour | David T. Petherbridge | 1,408 | ||
Conservative | Guy L. Harding | 1,279 | ||
Conservative | Ethel M. Mann | 1,172 | ||
Turnout | ||||
Registered electors | ||||
Labour gain from Conservative | ||||
Party | Candidate | Votes | % | |
---|---|---|---|---|
Conservative | Bruce T. H. Marshall | 2,534 | ||
Conservative | Graham T. W. Speed | 2,331 | ||
Liberal Democrats | Margaret L. Burnett | 703 | ||
Liberal Democrats | John Hatherley | 634 | ||
Labour | Robert J. Irwin | 574 | ||
Labour | Michael P. J. Phelan | 535 | ||
Turnout | ||||
Registered electors | ||||
Conservative hold | ||||
Party | Candidate | Votes | % | |
---|---|---|---|---|
Conservative | Richard H. R. Adamson | 2,584 | ||
Conservative | Dudley S. Mead | 2,553 | ||
Liberal Democrats | Gloria Truscott | 642 | ||
Liberal Democrats | Trevor J. Barker | 593 | ||
Labour | Philip J. S. Roberts | 582 | ||
Labour | Christine E. Patrick | 534 | ||
Turnout | ||||
Registered electors | ||||
Conservative hold | ||||
Party | Candidate | Votes | % | |
---|---|---|---|---|
Conservative | David Lipman | 1,747 | ||
Conservative | Eric J. Kings | 1,681 | ||
Conservative | Beryl Saunders | 1,639 | ||
Labour | Michael Jewitt | 1,613 | ||
Labour | Ben Earnshaw-Mansell | 1,612 | ||
Labour | Clive B. Fraser | 1,560 | ||
Liberal Democrats | Jonathan R. Cope | 474 | ||
Liberal Democrats | James E. Borkoles | 430 | ||
Liberal Democrats | Christopher M. Pocock | 413 | ||
Green | Christine C. M. Roberts | 373 | ||
Turnout | ||||
Registered electors | ||||
Conservative hold | ||||
Party | Candidate | Votes | % | |
---|---|---|---|---|
Conservative | Janet A. Marshall | 2,654 | ||
Conservative | Denis E. Perry | 2,632 | ||
Labour | Stephen C. Moyse | 1,226 | ||
Labour | Sandra Wilde | 1,188 | ||
Turnout | ||||
Registered electors | ||||
Conservative hold | ||||
Party | Candidate | Votes | % | |
---|---|---|---|---|
Labour | Adrian S. Dennis | 2,146 | ||
Labour | Wallace W. Garratt | 2,013 | ||
Labour | Trevor J. Laffin | 1,882 | ||
Conservative | Eric W. Howell | 1,400 | ||
Conservative | Bernard K. Ampaw | 1,336 | ||
Conservative | Catherine M. C. Wunn | 1,282 | ||
Green | Andrew H. Ellis | 414 | ||
Liberal Democrats | Helen M. Wallace | 339 | ||
Liberal Democrats | Julie Hardy-McBride | 327 | ||
Liberal Democrats | Beryl R. Pocock | 313 | ||
Turnout | ||||
Registered electors | ||||
Labour hold | ||||
Labour hold | ||||
Labour hold | ||||
Party | Candidate | Votes | % | |
---|---|---|---|---|
Conservative | Margaret C. V. Parfitt | 1,581 | ||
Conservative | John D. P. Yaxley | 1,408 | ||
Labour | Patrick T. Ryan | 1,282 | ||
Labour Co-op | Michael J. Anteney | 1,140 | ||
Liberal Democrats | Graem Peters | 263 | ||
Turnout | ||||
Registered electors | ||||
Conservative hold | ||||
Party | Candidate | Votes | % | |
---|---|---|---|---|
Labour | Christopher R. Allen | 2,484 | ||
Labour | Ann F. Allan | 2,401 | ||
Labour | Marilyn K. Allen | 2,322 | ||
Conservative | James J. Nea | 2,197 | ||
Conservative | Reginald H. Kent | 2,101 | ||
Conservative | Beverley S. Winborn | 2,054 | ||
Liberal Democrats | Joy I.D. Prince | 387 | ||
Liberal Democrats | Charles E. Burling | 350 | ||
Liberal Democrats | Mahmood I. Bhamji | 276 | ||
Turnout | 5,181 | 50.4 | ||
Registered electors | ||||
Labour gain from Conservative | ||||
Labour hold | ||||
Party | Candidate | Votes | % | |
---|---|---|---|---|
Labour | Gwendolyn E. Bernard | 2,246 | ||
Labour | Clarence A. McKenzie | 2,145 | ||
Labour Co-op | Elaine A. Gibbon | 1,809 | ||
Conservative | Alan E. Aylmer | 1,445 | ||
Conservative | Sarah M. Pelling | 1,306 | ||
Conservative | Yvonne A. L. Stewart | 1,225 | ||
Liberal Democrats | Simon L. Held | 631 | ||
Turnout | ||||
Registered electors | ||||
Labour hold | ||||
Labour hold | ||||
Labour Co-op hold | ||||
Party | Candidate | Votes | % | |
---|---|---|---|---|
Labour Co-op | Peter J. Champion | 2,108 | ||
Labour Co-op | Toni E. Letts | 1,915 | ||
Labour Co-op | Nuala O'Neill | 1,889 | ||
Conservative | Alexandra H. J. Burke | 1,183 | ||
Conservative | Daphne M. P. Read | 1,083 | ||
Conservative | Connell J. Stunell | 1,007 | ||
Liberal Democrats | David A. Holmes | 401 | ||
Turnout | ||||
Registered electors | ||||
Labour Co-op hold | ||||
Party | Candidate | Votes | % | |
---|---|---|---|---|
Conservative | Maurice A. Fowler | 2,585 | ||
Conservative | Anna Hawkins | 2,513 | ||
Conservative | Samuel J. Moore | 2,494 | ||
Liberal Democrats | Margaret R. A. Billenness | 1,105 | ||
Residents | Clare M. Shallcross | 948 | ||
Liberal Democrats | Trevor J. Austin | 934 | ||
Liberal Democrats | Keith C. Jacobs | 877 | ||
Labour | Albert G. Attwood | 709 | ||
Labour | Monica C. Ryan | 609 | ||
Labour | Mohammad S. Hoda | 558 | ||
Green | Stephen W. Lawlor | 476 | ||
Turnout | ||||
Registered electors | ||||
Conservative hold | ||||
Party | Candidate | Votes | % | |
---|---|---|---|---|
Labour Co-op | John C. Barlow | 1,338 | ||
Labour | David I. Trendell | 1,315 | ||
Conservative | Peter J. Campbell | 1,233 | ||
Conservative | Stephen G. Ghero | 1,122 | ||
Turnout | ||||
Registered electors | ||||
Labour Co-op hold | ||||
Labour hold | ||||
Abbey is an electoral ward in the London Borough of Barking and Dagenham, returning councillors to Barking and Dagenham London Borough Council. The population in 2011 was 12786.
River ward was an electoral ward in the London Borough of Barking and Dagenham from 1965 to 2022. It returning four councillors until 1978 and then three councillors to Barking and Dagenham London Borough Council. The boundaries of the ward were revised in 1978 and 2002.
Thames was a ward in the London Borough of Barking and Dagenham from 1978 to 2022.
West End is an electoral ward of the London borough of the City of Westminster, in the United Kingdom.
Oval is an electoral ward in the London Borough of Lambeth, United Kingdom. The ward has existed since the creation of the borough on 1 April 1965 and was first used in the 1964 elections. It returns three councillors to Lambeth London Borough Council.
Streatham St Leonard's is an electoral ward in the London Borough of Lambeth, United Kingdom. The ward has existed since the creation of the borough on 1 April 1965 and was first used in the 1964 elections. It returns three councillors to Lambeth London Borough Council.
The 1986 Barnet Council election took place on 8 May 1986 to elect members of Barnet London Borough Council in London, England. The whole council was up for election and the Conservative party stayed in overall control of the council.
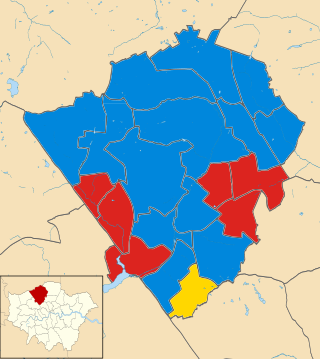
The 1990 Bromley Council election took place on 3 May 1990 to elect members of Bromley London Borough Council in London, England. The whole council was up for election and the Conservative party stayed in overall control of the council.
The 1990 Ealing Council election took place on 3 May 1990 to elect members of Ealing London Borough Council in London, England. The whole council was up for election and the Conservative party gained overall control of the council.
The 1990 Hammersmith and Fulham Council election took place on 3 May 1990 to elect members of Hammersmith and Fulham London Borough Council in London, England. The whole council was up for election and the Labour party stayed in overall control of the council.
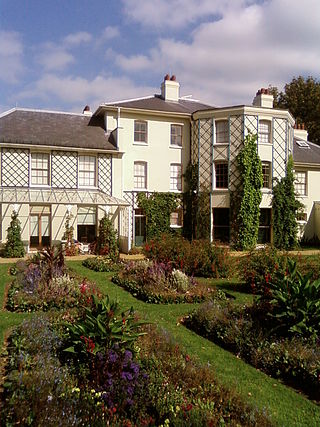
Darwin is an electoral ward in the London Borough of Bromley. The ward has existed since the creation of the borough on 1 April 1965 and was first used in the 1964 elections. It returns one councillor to Bromley London Borough Council. To date, the ward has only been represented by the Conservative Party. The ward covers the most rural part of the borough consisting a number of hamlets. It is the largest electoral ward in Greater London. As originally created in 1965 it included Downe, Cudham, Luxted, Single Street, Berry's Green, Horns Green and Knockholt. Leaves Green, Pratt's Bottom and South Street have also formed part of the ward at certain times. Since 2022 it has covered an area of 32.74 square kilometres (12.64 sq mi). The current elected political party's website for 2022, (Conservative), states that the Ward is the most southerly Ward within the London Borough of Bromley. And, that it comprisies Downe, Cudham, Leaves Green, Leavesden Estate, Westerham Hill, Beechwood, and Pratts Bottom.
Angell ward was an administrative division of the London Borough of Lambeth from 1965 to 2002.
Longbridge is an electoral ward in the London Borough of Barking and Dagenham, returning councillors to Barking and Dagenham London Borough Council.
Ardleigh Green was an electoral ward in the London Borough of Havering from 1978 to 2002. The ward was first used in the 1978 elections. It returned councillors to Havering London Borough Council.
Cranham West was an electoral ward in the London Borough of Havering from 1978 to 2002. The ward was first used in the 1978 elections and last used at the 1998 elections. It returned two councillors to Havering London Borough Council. It was replaced by the Cranham ward.
Cranham East was an electoral ward in the London Borough of Havering from 1978 to 2002. The ward was first used in the 1978 elections. It returned councillors to Havering London Borough Council.
St Edward's is an electoral ward in the London Borough of Havering. The ward was originally created in 1978 and abolished in 2002. It was created again in 2022. It returns councillors to Havering London Borough Council.
Harringay is an electoral ward in the London Borough of Haringey. The ward has existed since 1978 and was first used in the 1978 elections. It returns councillors to Haringey London Borough Council.
Shadwell is an electoral ward in the London Borough of Tower Hamlets. The ward has existed since the creation of the borough on 1 April 1965 and was first used in the 1964 elections. It returns councillors to Tower Hamlets London Borough Council.
Weavers is an electoral ward in the London Borough of Tower Hamlets. The ward was first used in the 1978 elections. It returns councillors to Tower Hamlets London Borough Council.